| Param | Original file | Final file |
|---|---|---|
| Filename | modeM0/AS1G05_240T02_9000000670_05278cztM0_level2.evt | modeM0/AS1G05_240T02_9000000670_05278cztM0_level2_quad_clean.evt |
| Size (bytes) | 894,896,640 | 132,652,800 |
| Size | 853.4 MB | 126.5 MB |
| Events in quadrant A | 5,387,000 | 831,520 |
| Events in quadrant B | 5,325,888 | 833,084 |
| Events in quadrant C | 5,030,227 | 815,257 |
| Events in quadrant D | 10,580,766 | 741,500 |
| Mode SS | |||
|---|---|---|---|
| Quadrant | BADHDUFLAG | Total packets | Discarded packets |
| A | 0 | 234 | 0 |
| B | 0 | 234 | 0 |
| C | 0 | 234 | 0 |
| D | 0 | 234 | 0 |
| Mode M9 | |||
|---|---|---|---|
| Quadrant | BADHDUFLAG | Total packets | Discarded packets |
| A | 0 | 19 | 0 |
| B | 0 | 19 | 0 |
| C | 0 | 19 | 0 |
| D | 0 | 19 | 0 |
| Mode M0 | |||
|---|---|---|---|
| Quadrant | BADHDUFLAG | Total packets | Discarded packets |
| A | 0 | 23918 | 5 |
| B | 0 | 23684 | 2 |
| C | 0 | 23279 | 2 |
| D | 0 | 39463 | 2 |
| Quadrant | Total seconds | Saturated seconds | Saturation percentage |
|---|---|---|---|
| A | 11499 | 105 | 0.913123% |
| B | 11500 | 54 | 0.469565% |
| C | 11500 | 37 | 0.321739% |
| D | 11500 | 1520 | 13.217391% |
Noise dominated data is calculated using 1-second bins in cleaned event files. If a bin has >2000 counts, and if more than 50% of those come from <1% of pixels, then it is considered to be noise-dominated and hence unusable.
| Quadrant | # 1 sec bins | Bins with >0 counts | Bins with >2000 counts | High rate bins dominated by noise | Noise dominated (total time) | Noise dominated (detector-on time) | Marked lightcurve |
|---|---|---|---|---|---|---|---|
| A | 13415 | 11501 | 30 | 30 | 0.22% | 0.26% |  |
| B | 13415 | 11501 | 0 | 0 | 0.00% | 0.00% |  |
| C | 13415 | 11501 | 0 | 0 | 0.00% | 0.00% |  |
| D | 13415 | 11501 | 1203 | 1203 | 8.97% | 10.46% | 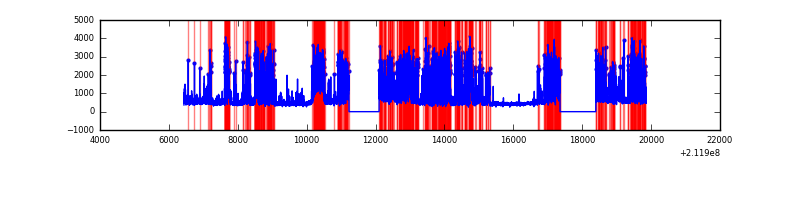 |
Top three noisy pixels from each quadrant. If the there are fewer than three noisy pixels in the level2.evt file, extra rows are filled as -1
| Pixel properties | Quadrant properties | ||||||
|---|---|---|---|---|---|---|---|
| Quadrant | DetID | PixID | Counts | Sigma | Mean | Median | Sigma |
| A | 0 | 50 | 175134 | 645.64 | 1318 | 1287 | 269.3 |
| A | 13 | 251 | 130745 | 480.79 | 1318 | 1287 | 269.3 |
| A | 0 | 226 | 13000 | 43.5 | 1318 | 1287 | 269.3 |
| B | 0 | 245 | 44973 | 170.12 | 1337 | 1304 | 256.7 |
| B | 15 | 204 | 36330 | 136.45 | 1337 | 1304 | 256.7 |
| B | 0 | 184 | 34689 | 130.06 | 1337 | 1304 | 256.7 |
| C | 13 | 61 | 10627 | 31.47 | 1284 | 1293 | 296.6 |
| C | 1 | 16 | 8513 | 24.35 | 1284 | 1293 | 296.6 |
| C | 12 | 4 | 6395 | 17.2 | 1284 | 1293 | 296.6 |
| D | 11 | 145 | 5049902 | 16914.66 | 1213 | 1173 | 298.5 |
| D | 2 | 136 | 432794 | 1446.05 | 1213 | 1173 | 298.5 |
| D | 8 | 195 | 264236 | 881.34 | 1213 | 1173 | 298.5 |
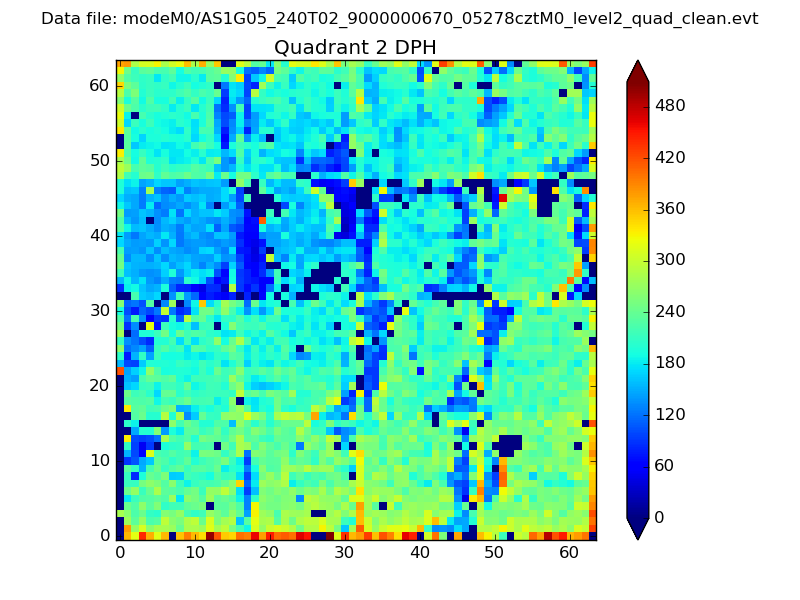
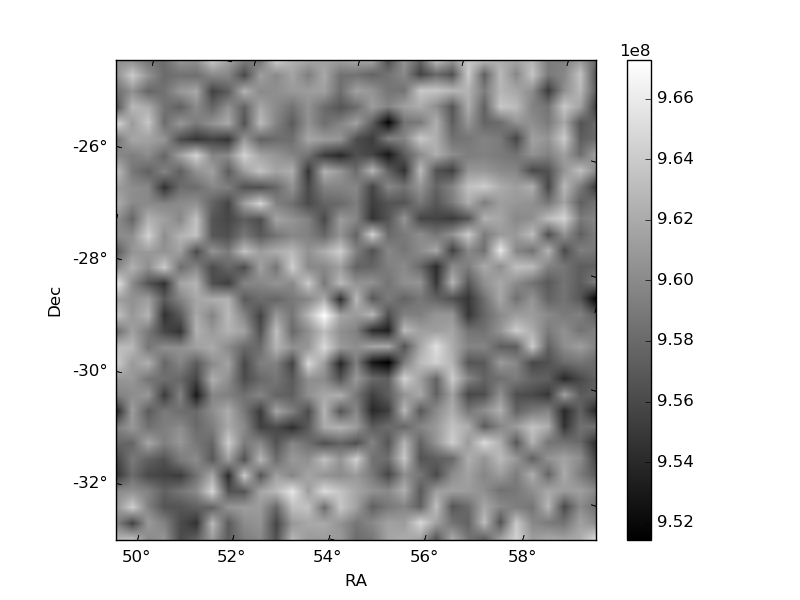
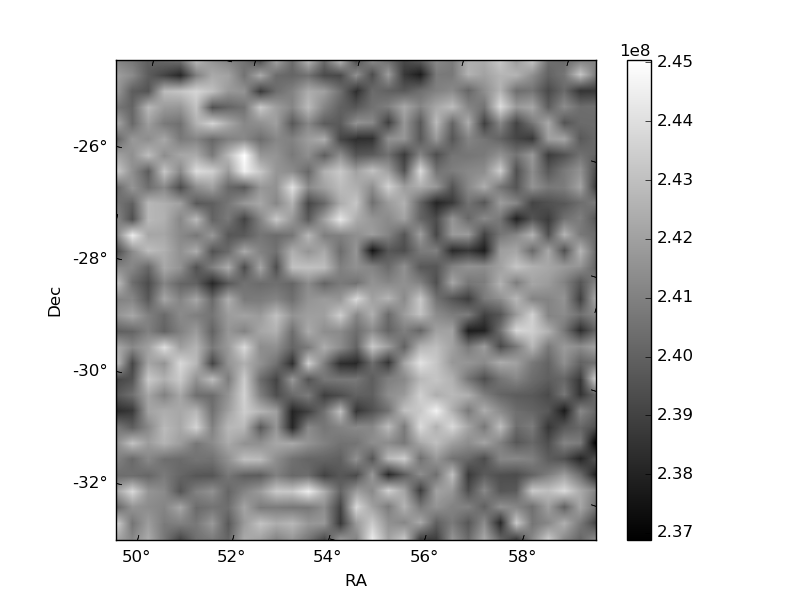
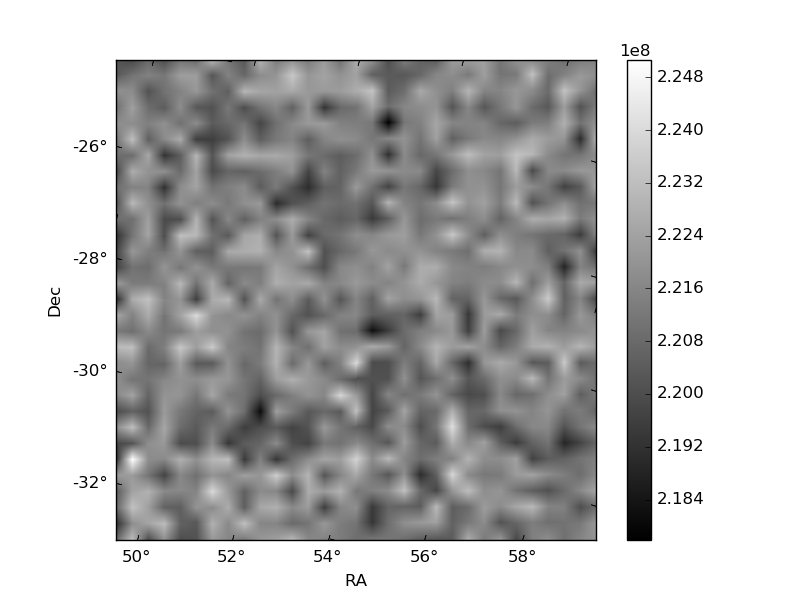
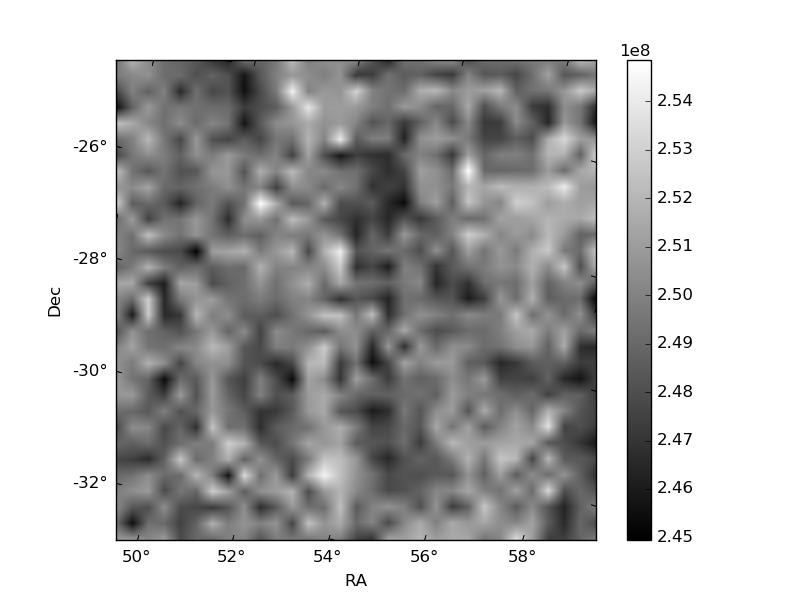
Histogram calculated using DETX and DETY for each event in the final _common_clean file
| Quadrant A |  |
 |
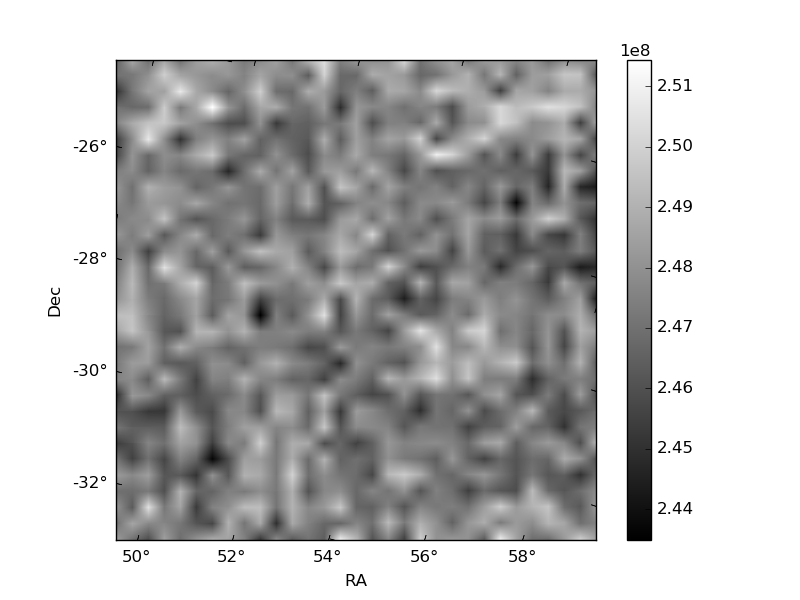
Quadrant B |
|---|---|---|---|
| Quadrant D | 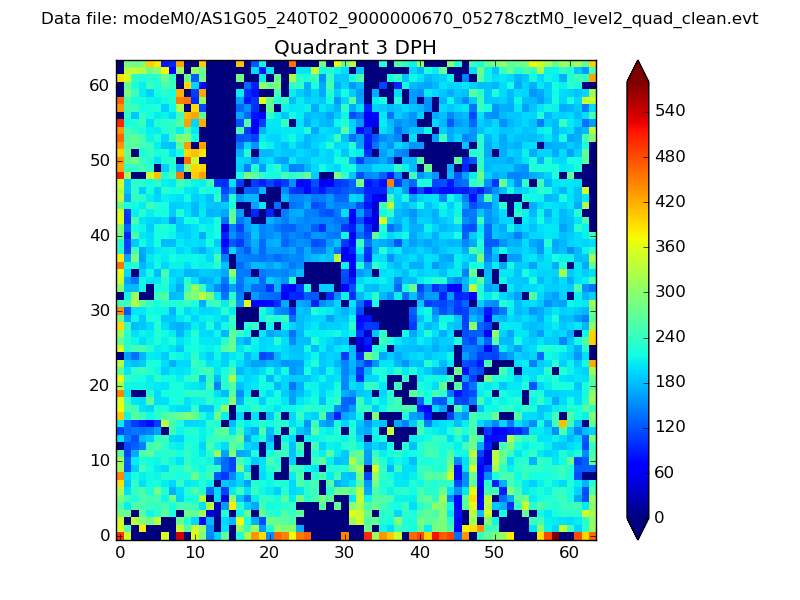 |
 |
Quadrant C |
| Plot type | Count rate plots | Images |
|---|---|---|
| Comparison with Poisson distribution Blue bars denote a histogram of data divided into 1 sec bins. Red curve is a Poisson curve with rate = median count rate of data. |
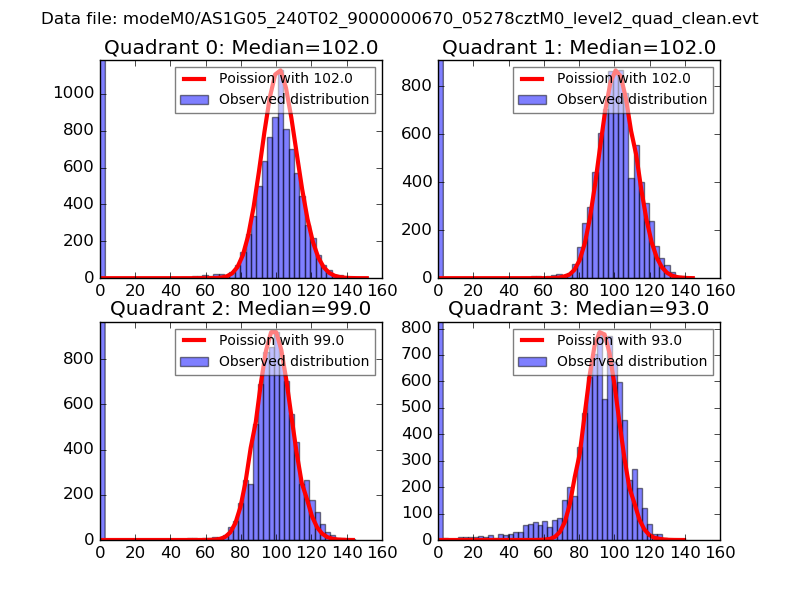 |
 |
| Quadrant-wise count rates Data is divided into 100 sec bins |
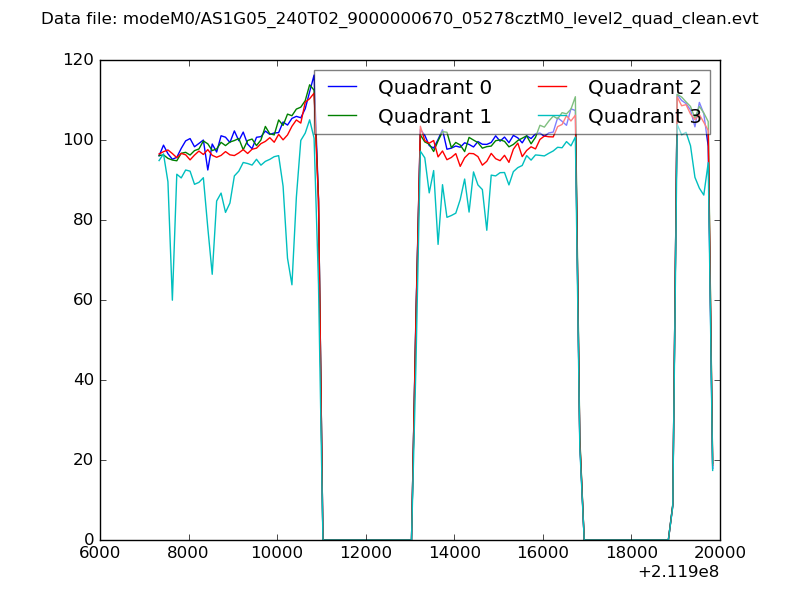 |
|
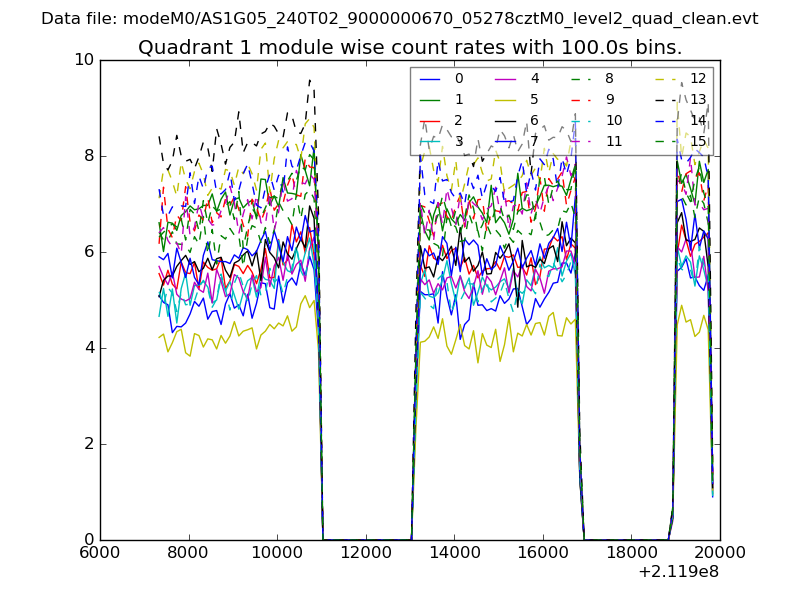
| Module-wise count rates for Quadrant A Data is divided into 100 sec bins |
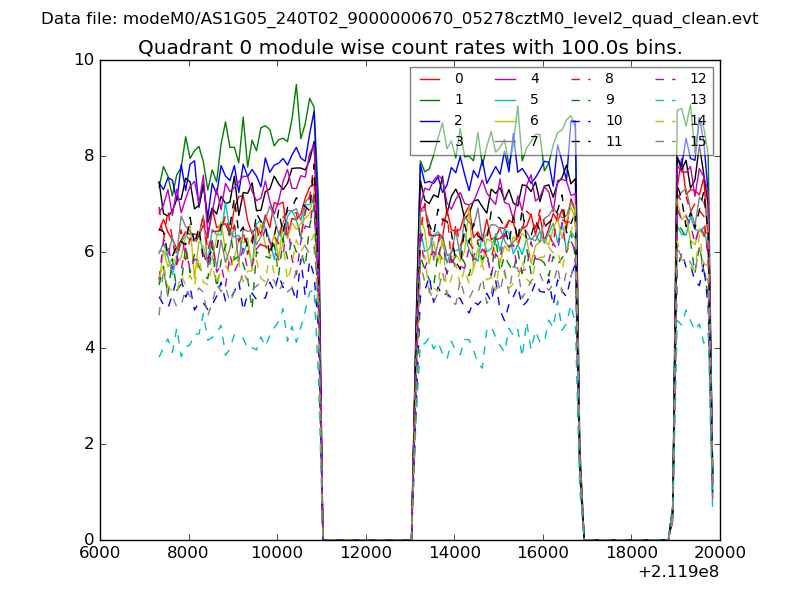 |
 |
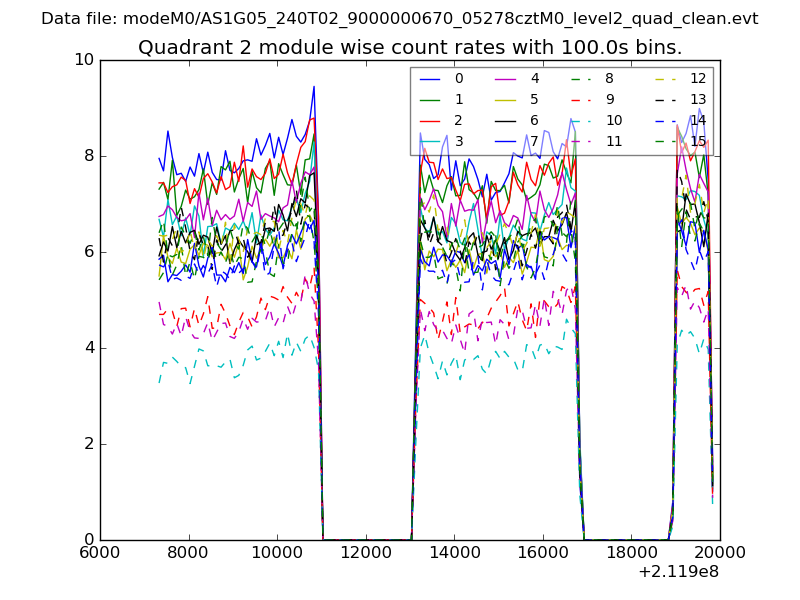
| Module-wise count rates for Quadrant B Data is divided into 100 sec bins |
 |
 |
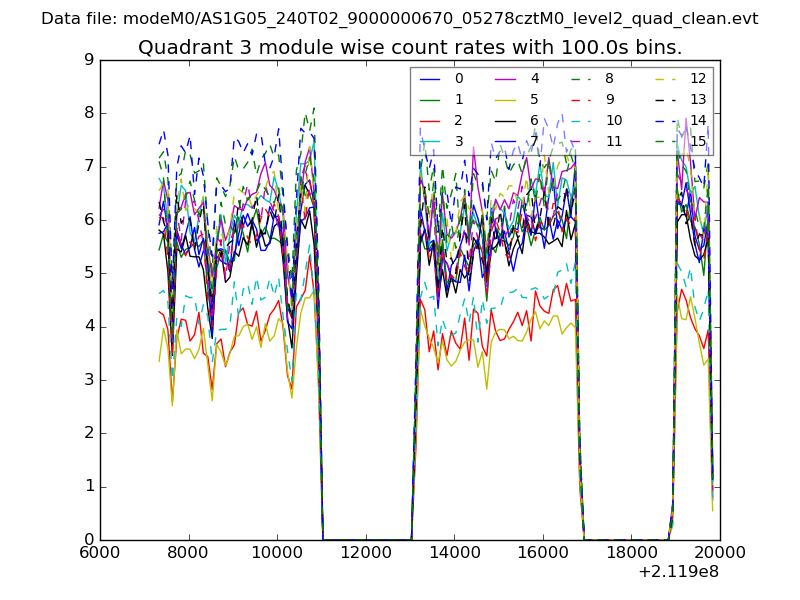
| Module-wise count rates for Quadrant C Data is divided into 100 sec bins |
 |
 |
| Module-wise count rates for Quadrant D Data is divided into 100 sec bins |
 |
 |
| Parameter | Plot |
|---|---|
| CZT HV Monitor | 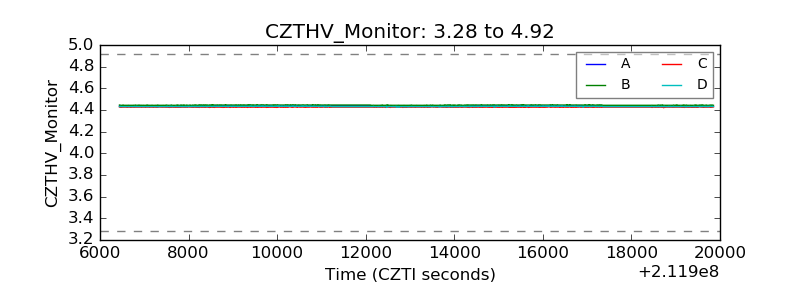 |
| D_VDD | 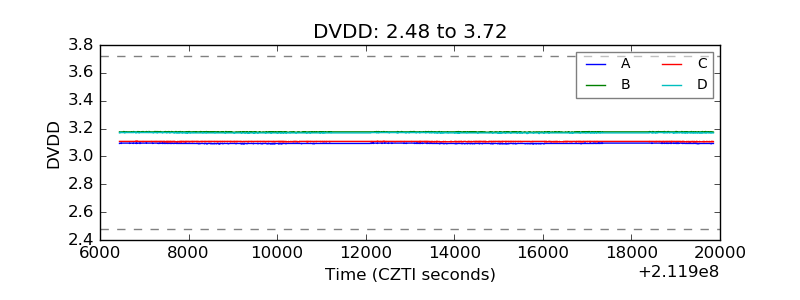 |
| Temperature 1 | 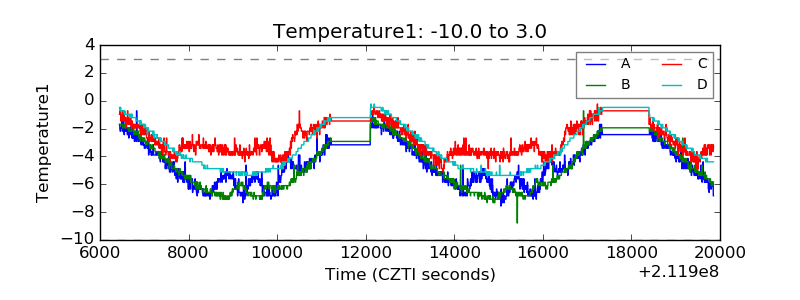 |
| Veto HV Monitor | 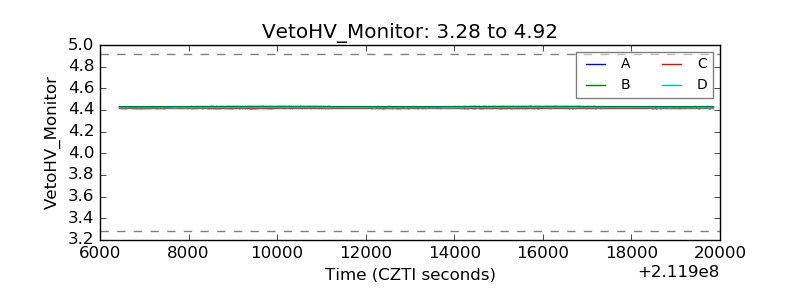 |
| Veto LLD | 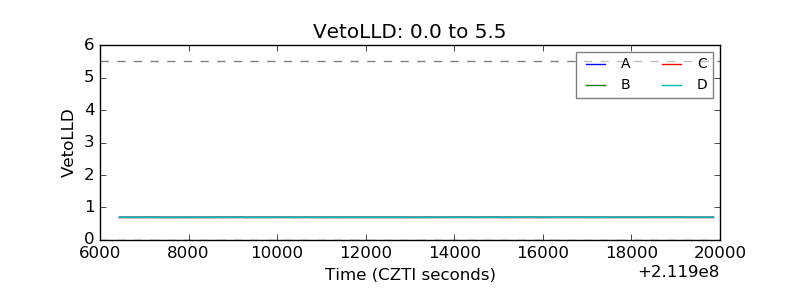 |
| Alpha Counter | 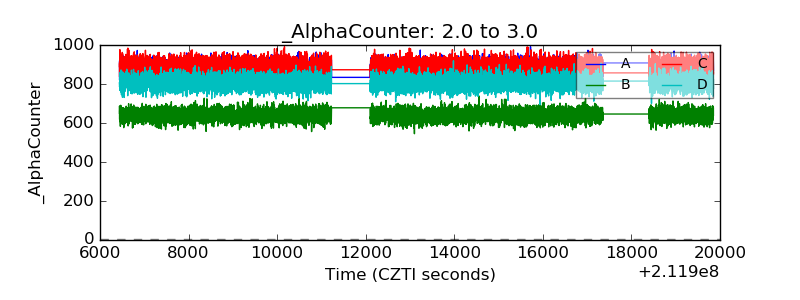 |
| _CPM_Rate | 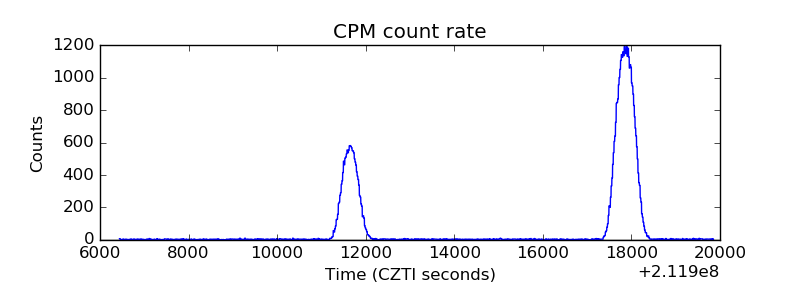 |
| CZT Counter | 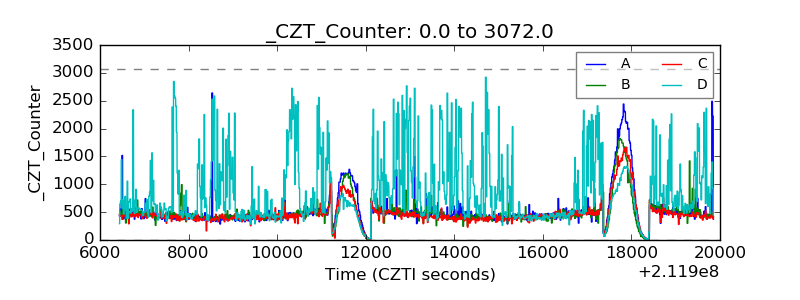 |
| +2.5 Volts monitor | 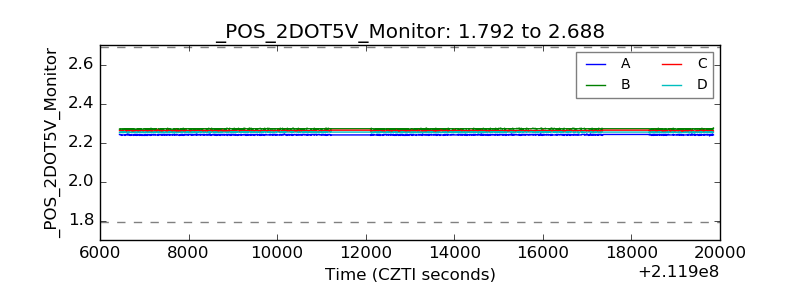 |
| +5 Volts monitor |  |
| _ROLL_ROT | 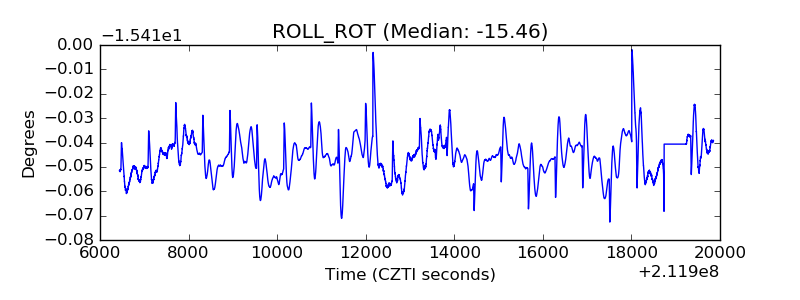 |
| _Roll_DEC | 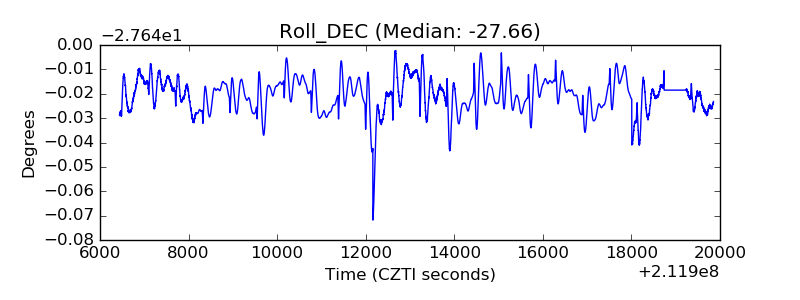 |
| _Roll_RA | 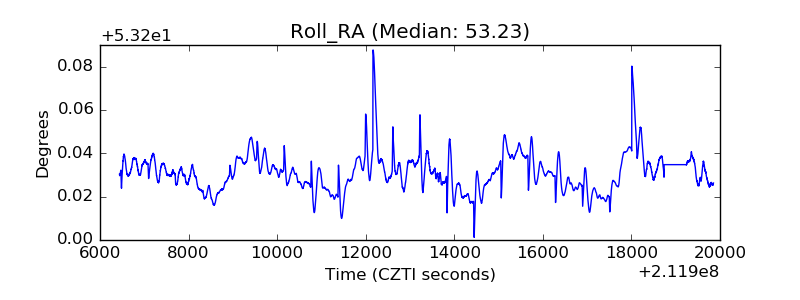 |
| Veto Counter | 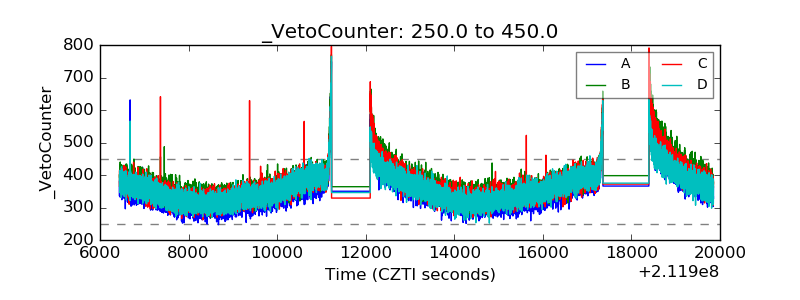 |