| Param | Original file | Final file |
|---|---|---|
| Filename | modeM0/AS1G05_240T02_9000000670_05281cztM0_level2.evt | modeM0/AS1G05_240T02_9000000670_05281cztM0_level2_quad_clean.evt |
| Size (bytes) | 554,564,160 | 89,015,040 |
| Size | 528.9 MB | 84.9 MB |
| Events in quadrant A | 3,429,560 | 564,993 |
| Events in quadrant B | 3,420,911 | 582,976 |
| Events in quadrant C | 3,220,701 | 565,200 |
| Events in quadrant D | 6,255,645 | 501,455 |
| Mode SS | |||
|---|---|---|---|
| Quadrant | BADHDUFLAG | Total packets | Discarded packets |
| A | 0 | 144 | 0 |
| B | 0 | 144 | 0 |
| C | 0 | 144 | 0 |
| D | 0 | 144 | 0 |
| Mode M9 | |||
|---|---|---|---|
| Quadrant | BADHDUFLAG | Total packets | Discarded packets |
| A | 0 | 24 | 0 |
| B | 0 | 24 | 0 |
| C | 0 | 24 | 0 |
| D | 0 | 24 | 0 |
| Mode M0 | |||
|---|---|---|---|
| Quadrant | BADHDUFLAG | Total packets | Discarded packets |
| A | 0 | 14791 | 3 |
| B | 0 | 14651 | 2 |
| C | 0 | 14208 | 2 |
| D | 0 | 23315 | 2 |
| Quadrant | Total seconds | Saturated seconds | Saturation percentage |
|---|---|---|---|
| A | 6894 | 123 | 1.784160% |
| B | 6894 | 54 | 0.783290% |
| C | 6894 | 21 | 0.304613% |
| D | 6894 | 846 | 12.271540% |
Noise dominated data is calculated using 1-second bins in cleaned event files. If a bin has >2000 counts, and if more than 50% of those come from <1% of pixels, then it is considered to be noise-dominated and hence unusable.
| Quadrant | # 1 sec bins | Bins with >0 counts | Bins with >2000 counts | High rate bins dominated by noise | Noise dominated (total time) | Noise dominated (detector-on time) | Marked lightcurve |
|---|---|---|---|---|---|---|---|
| A | 9319 | 6896 | 43 | 43 | 0.46% | 0.62% | 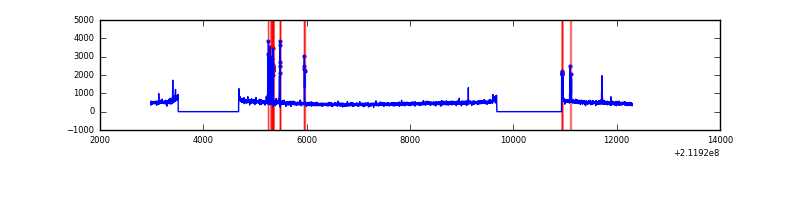 |
| B | 9319 | 6896 | 5 | 5 | 0.05% | 0.07% | 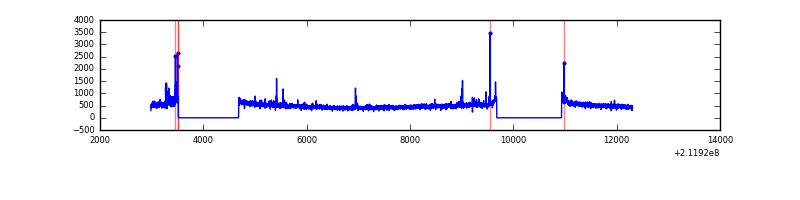 |
| C | 9319 | 6896 | 0 | 0 | 0.00% | 0.00% | 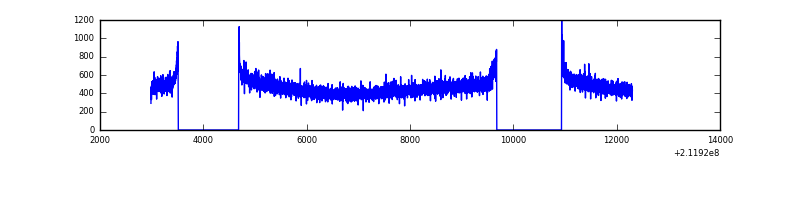 |
| D | 9319 | 6895 | 691 | 691 | 7.41% | 10.02% | 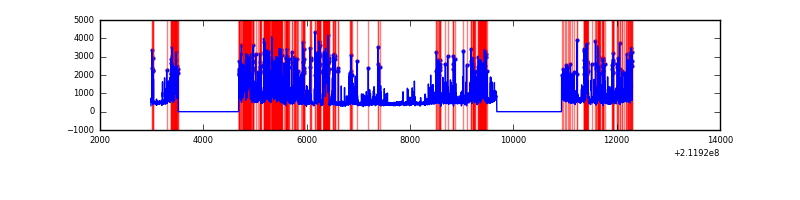 |
Top three noisy pixels from each quadrant. If the there are fewer than three noisy pixels in the level2.evt file, extra rows are filled as -1
| Pixel properties | Quadrant properties | ||||||
|---|---|---|---|---|---|---|---|
| Quadrant | DetID | PixID | Counts | Sigma | Mean | Median | Sigma |
| A | 0 | 50 | 224602 | 1333.46 | 828 | 810 | 167.8 |
| A | 13 | 251 | 17589 | 99.98 | 828 | 810 | 167.8 |
| A | 12 | 194 | 8113 | 43.51 | 828 | 810 | 167.8 |
| B | 4 | 48 | 32706 | 198.43 | 849 | 831 | 160.6 |
| B | 15 | 204 | 29296 | 177.21 | 849 | 831 | 160.6 |
| B | 10 | 16 | 27971 | 168.96 | 849 | 831 | 160.6 |
| C | 1 | 16 | 18778 | 94.99 | 818 | 823 | 189.0 |
| C | 13 | 61 | 6702 | 31.1 | 818 | 823 | 189.0 |
| C | 7 | 190 | 5553 | 25.02 | 818 | 823 | 189.0 |
| D | 11 | 145 | 2830936 | 14942.62 | 763 | 739 | 189.4 |
| D | 2 | 136 | 286394 | 1508.18 | 763 | 739 | 189.4 |
| D | 8 | 195 | 149383 | 784.8 | 763 | 739 | 189.4 |
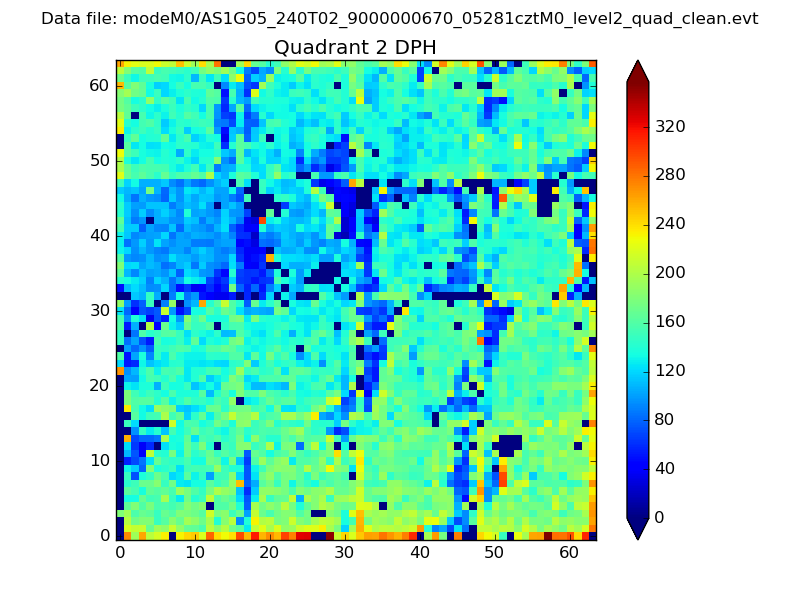
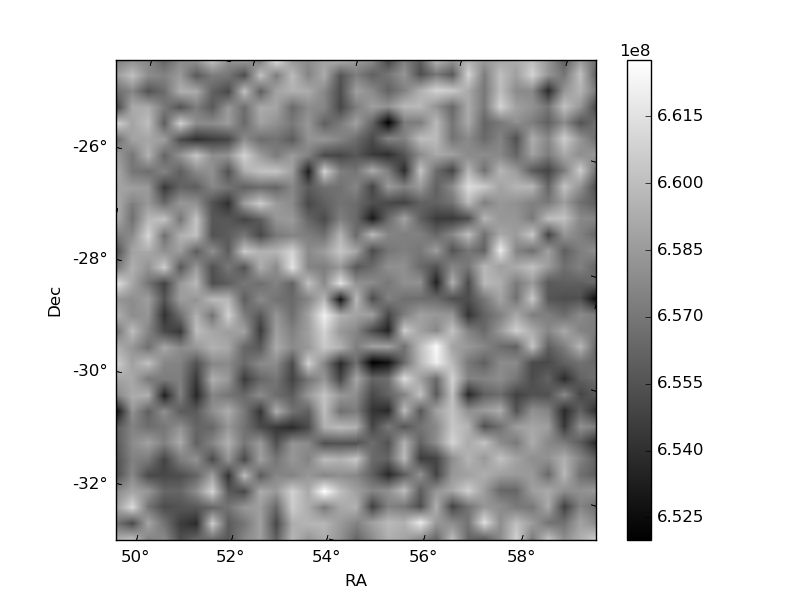
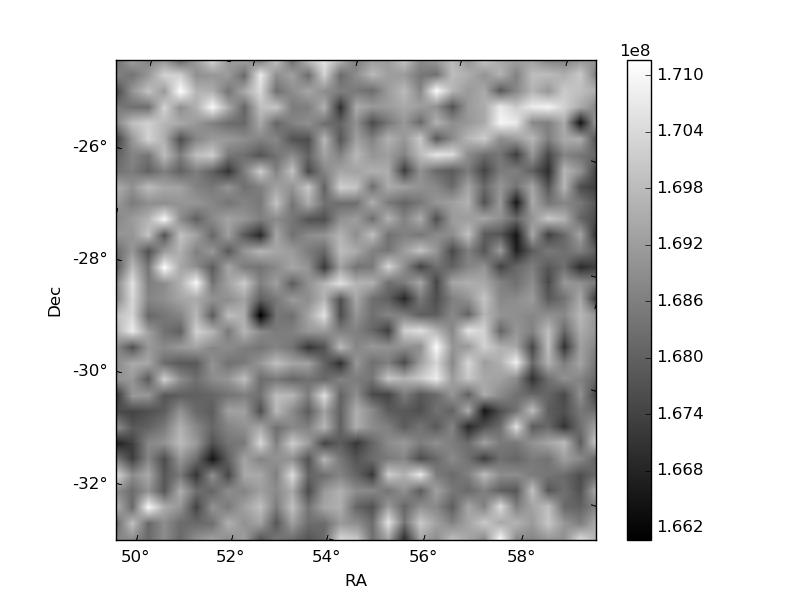
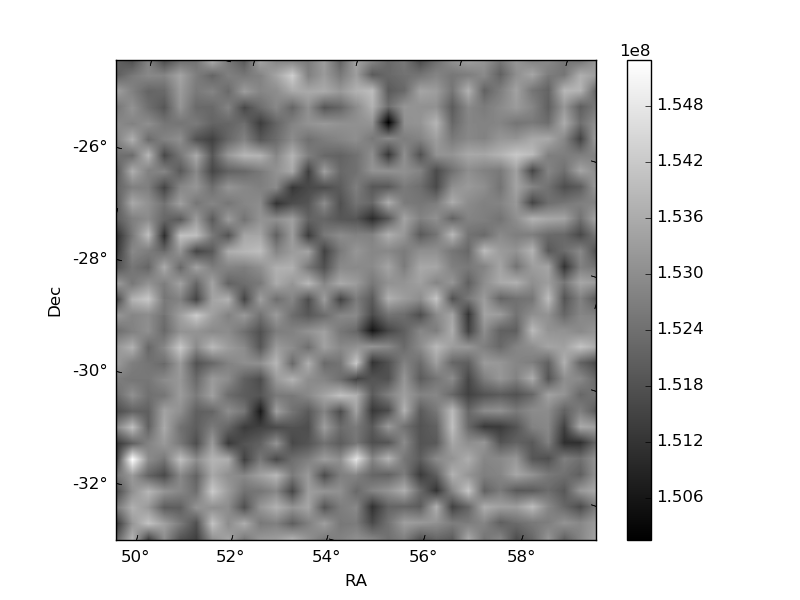
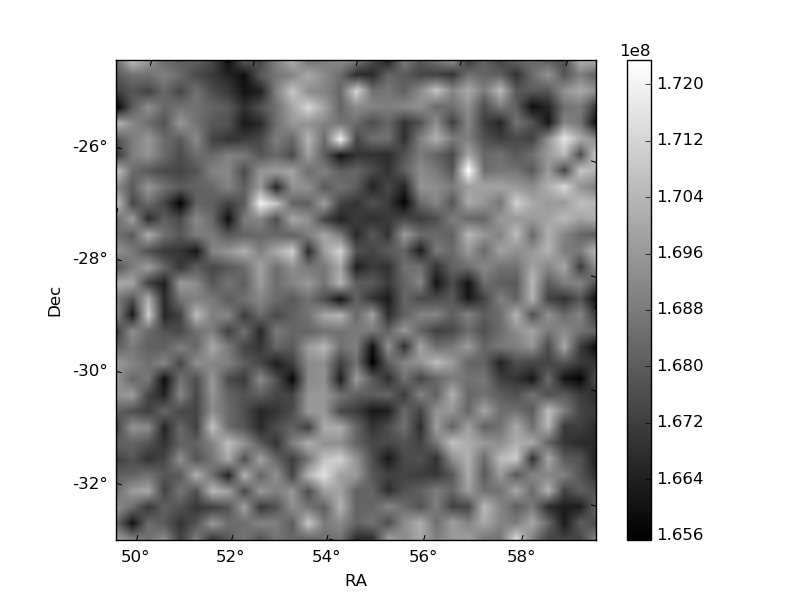
Histogram calculated using DETX and DETY for each event in the final _common_clean file
| Quadrant A | 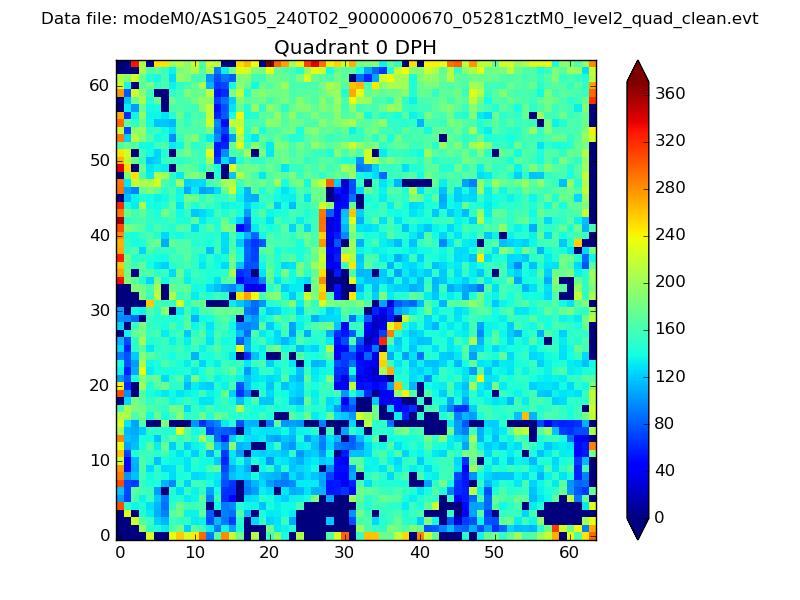 |
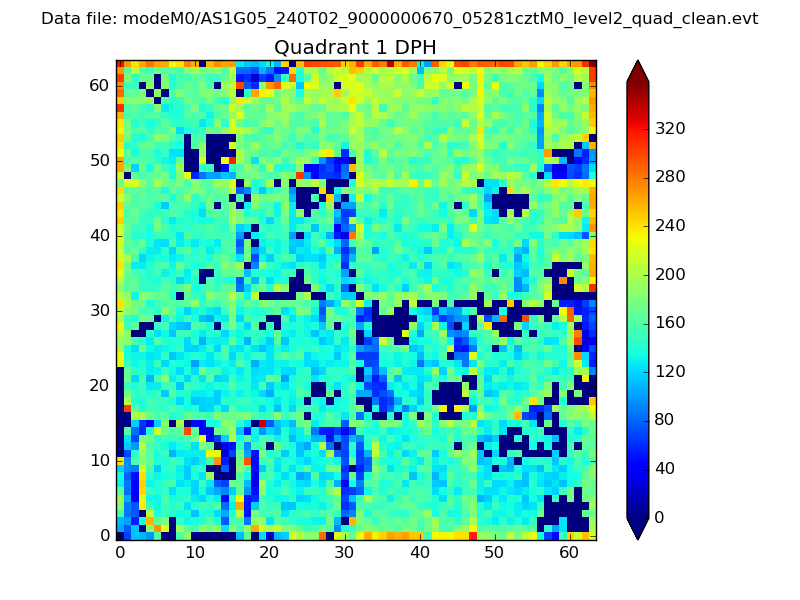 |
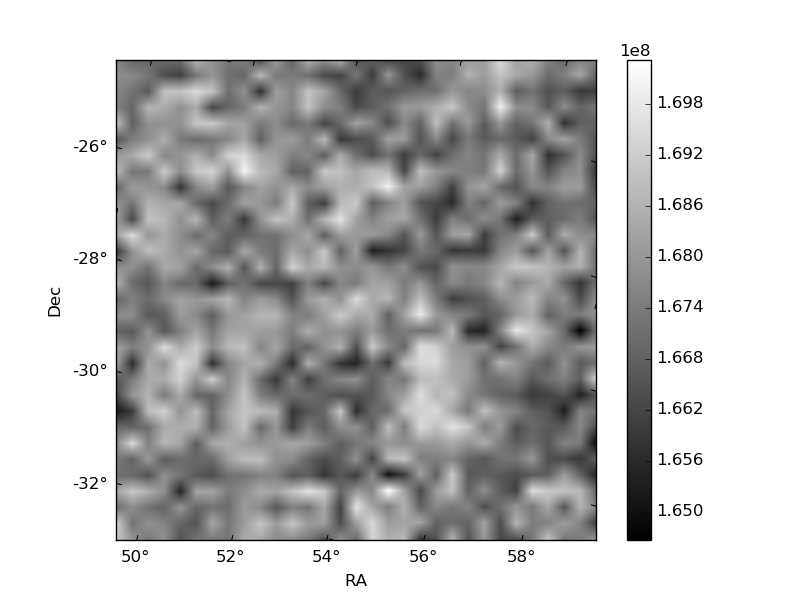
Quadrant B |
|---|---|---|---|
| Quadrant D | 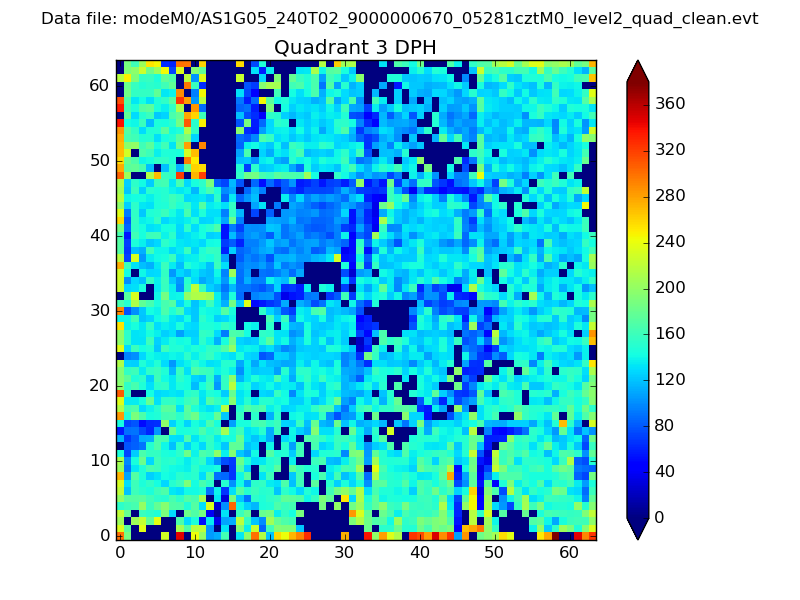 |
 |
Quadrant C |
| Plot type | Count rate plots | Images |
|---|---|---|
| Comparison with Poisson distribution Blue bars denote a histogram of data divided into 1 sec bins. Red curve is a Poisson curve with rate = median count rate of data. |
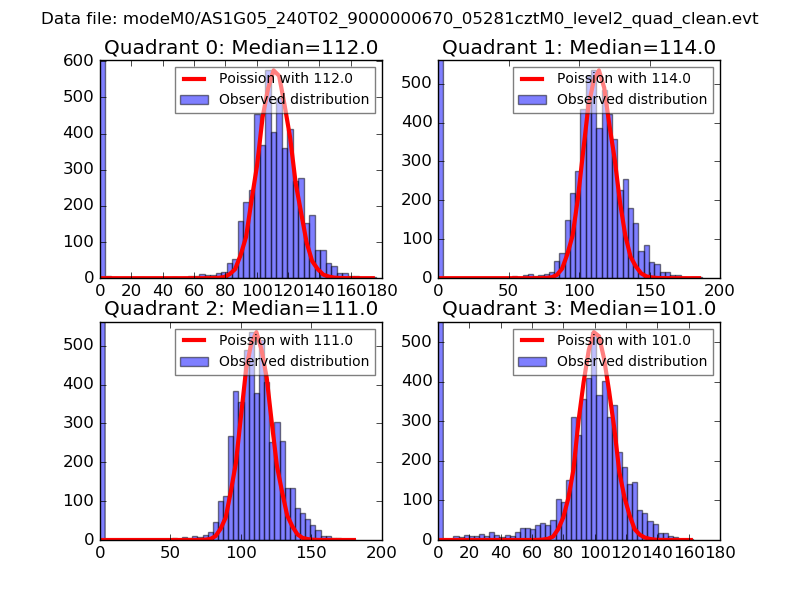 |
 |
| Quadrant-wise count rates Data is divided into 100 sec bins |
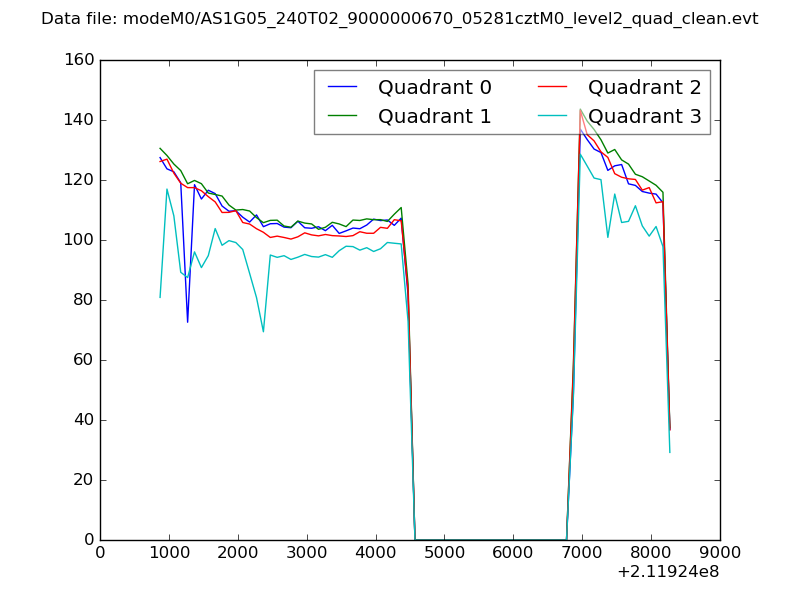 |
|
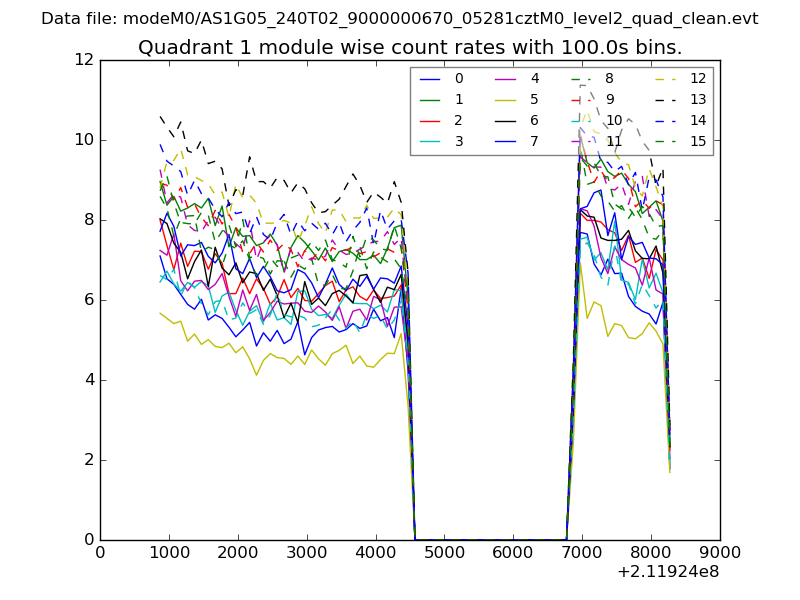
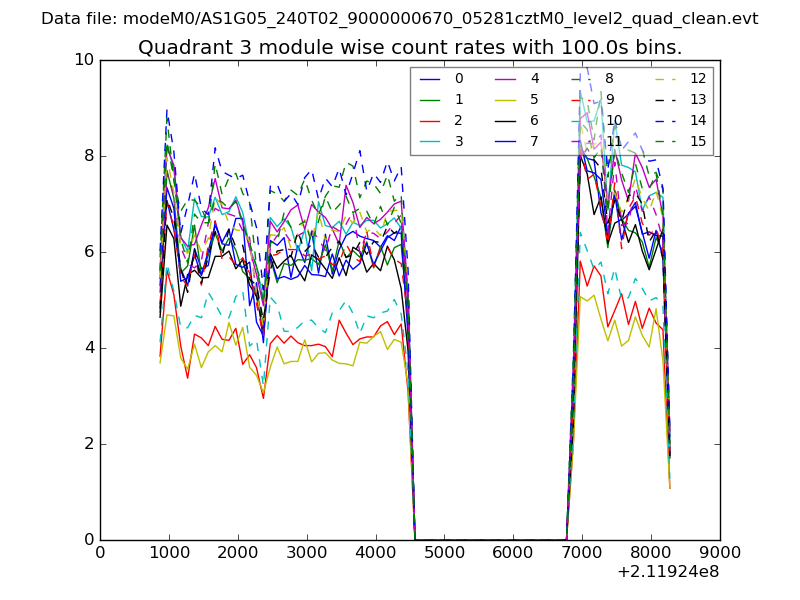
| Module-wise count rates for Quadrant A Data is divided into 100 sec bins |
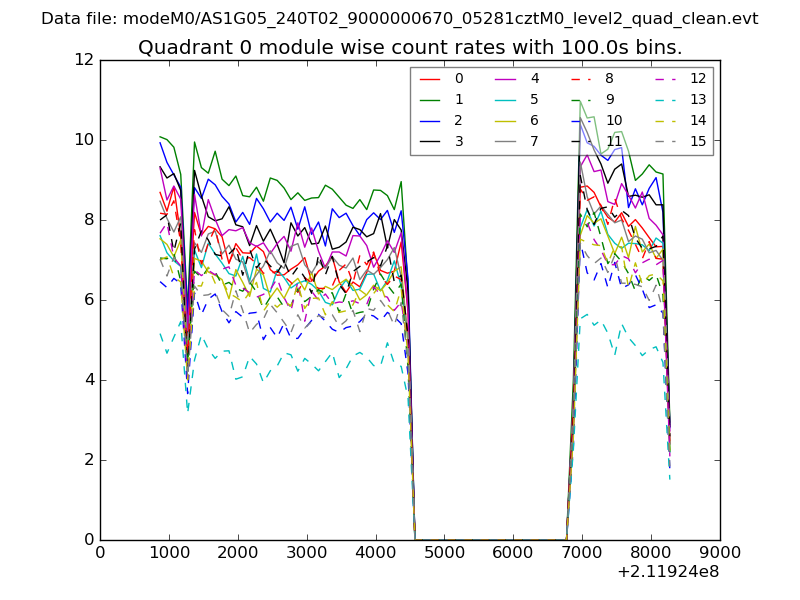 |
 |
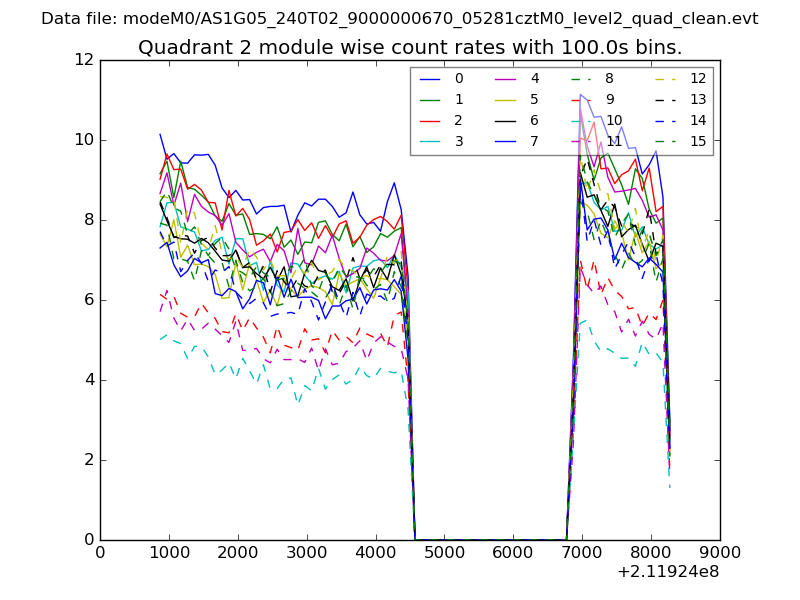
| Module-wise count rates for Quadrant B Data is divided into 100 sec bins |
 |
 |
| Module-wise count rates for Quadrant C Data is divided into 100 sec bins |
 |
 |
| Module-wise count rates for Quadrant D Data is divided into 100 sec bins |
 |
 |
| Parameter | Plot |
|---|---|
| CZT HV Monitor | 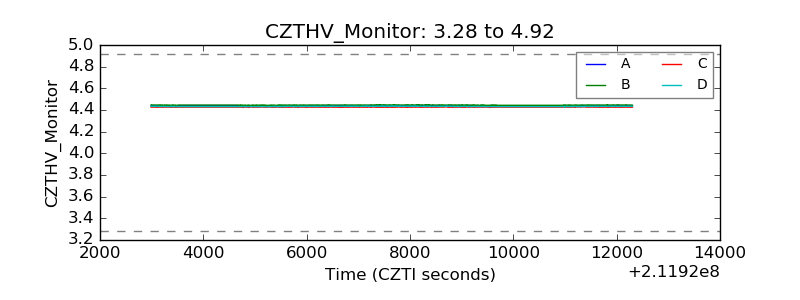 |
| D_VDD | 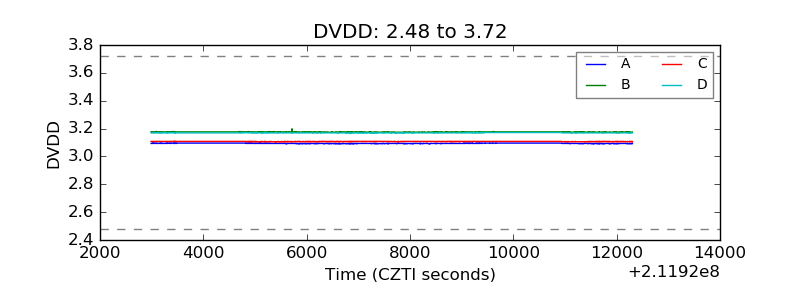 |
| Temperature 1 | 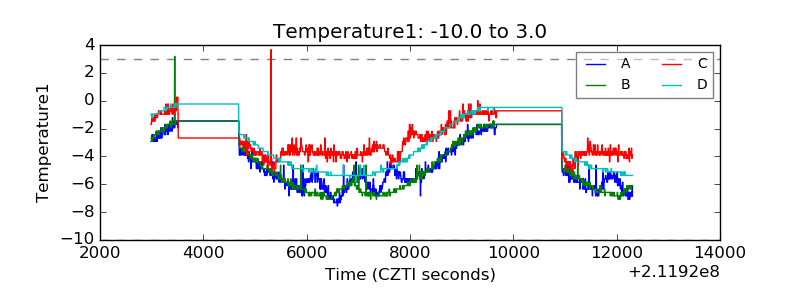 |
| Veto HV Monitor | 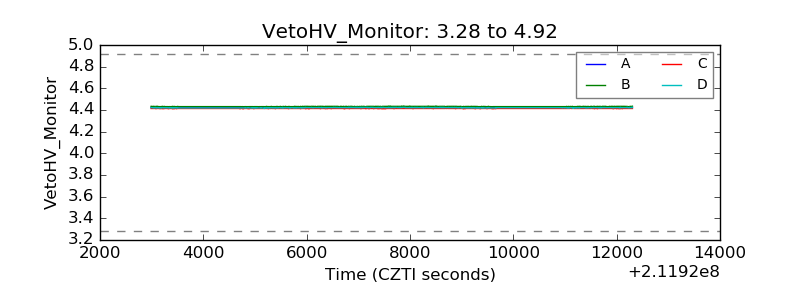 |
| Veto LLD | 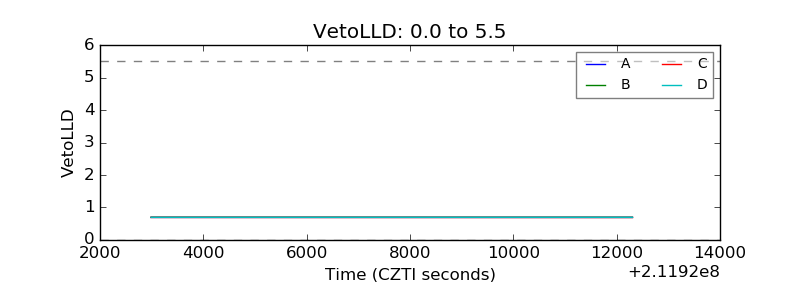 |
| Alpha Counter | 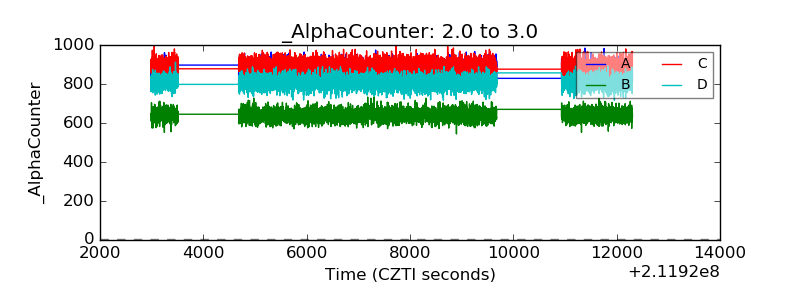 |
| _CPM_Rate | 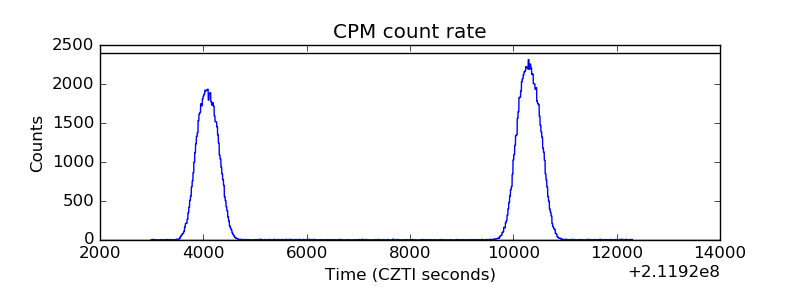 |
| CZT Counter | 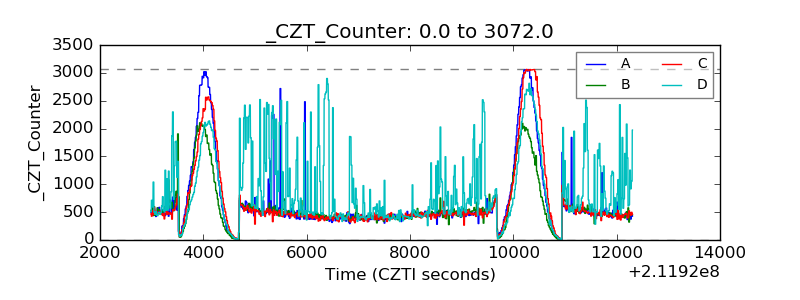 |
| +2.5 Volts monitor |  |
| +5 Volts monitor |  |
| _ROLL_ROT | 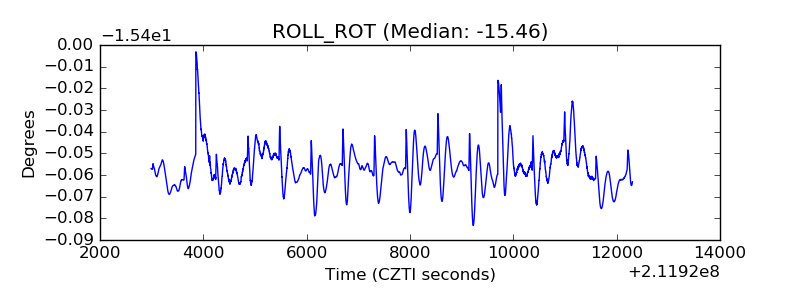 |
| _Roll_DEC | 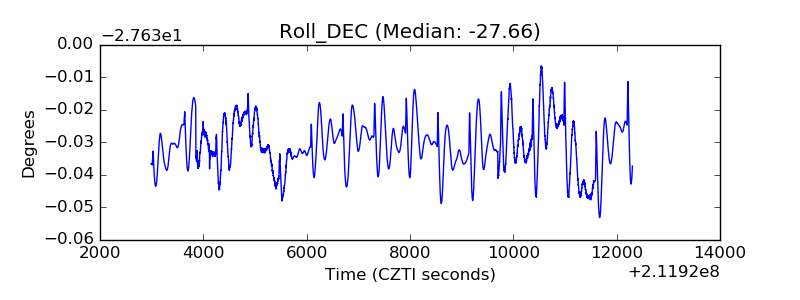 |
| _Roll_RA | 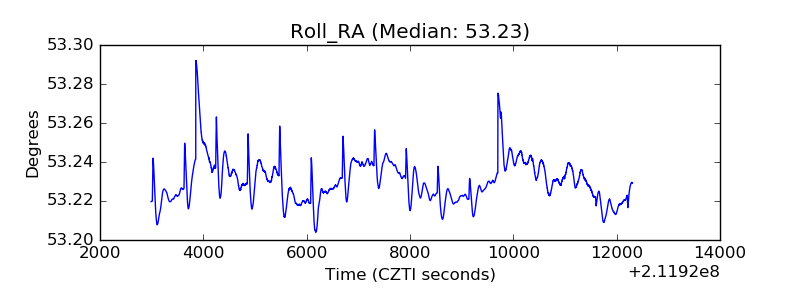 |
| Veto Counter | 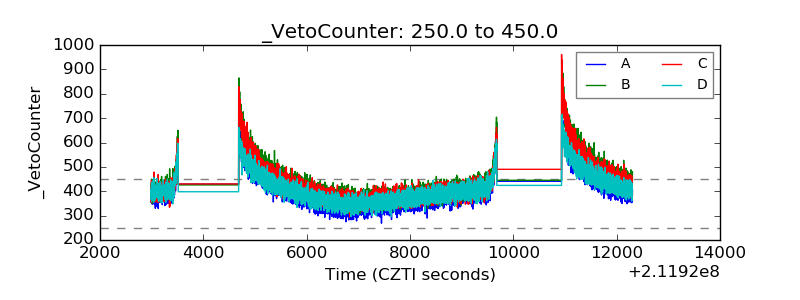 |