| Param | Original file | Final file |
|---|---|---|
| Filename | modeM0/AS1G05_240T02_9000000670_05282cztM0_level2.evt | modeM0/AS1G05_240T02_9000000670_05282cztM0_level2_quad_clean.evt |
| Size (bytes) | 523,540,800 | 84,101,760 |
| Size | 499.3 MB | 80.2 MB |
| Events in quadrant A | 2,947,292 | 541,234 |
| Events in quadrant B | 3,012,350 | 561,152 |
| Events in quadrant C | 2,889,495 | 540,908 |
| Events in quadrant D | 6,590,966 | 475,927 |
| Mode SS | |||
|---|---|---|---|
| Quadrant | BADHDUFLAG | Total packets | Discarded packets |
| A | 0 | 124 | 0 |
| B | 0 | 124 | 0 |
| C | 0 | 124 | 0 |
| D | 0 | 124 | 0 |
| Mode M9 | |||
|---|---|---|---|
| Quadrant | BADHDUFLAG | Total packets | Discarded packets |
| A | 0 | 20 | 0 |
| B | 0 | 20 | 0 |
| C | 0 | 20 | 0 |
| D | 0 | 21 | 0 |
| Mode M0 | |||
|---|---|---|---|
| Quadrant | BADHDUFLAG | Total packets | Discarded packets |
| A | 0 | 12824 | 3 |
| B | 0 | 12889 | 2 |
| C | 0 | 12619 | 2 |
| D | 0 | 23852 | 2 |
| Quadrant | Total seconds | Saturated seconds | Saturation percentage |
|---|---|---|---|
| A | 6123 | 48 | 0.783929% |
| B | 6123 | 29 | 0.473624% |
| C | 6123 | 11 | 0.179650% |
| D | 6123 | 1154 | 18.846970% |
Noise dominated data is calculated using 1-second bins in cleaned event files. If a bin has >2000 counts, and if more than 50% of those come from <1% of pixels, then it is considered to be noise-dominated and hence unusable.
| Quadrant | # 1 sec bins | Bins with >0 counts | Bins with >2000 counts | High rate bins dominated by noise | Noise dominated (total time) | Noise dominated (detector-on time) | Marked lightcurve |
|---|---|---|---|---|---|---|---|
| A | 7433 | 6124 | 9 | 9 | 0.12% | 0.15% | 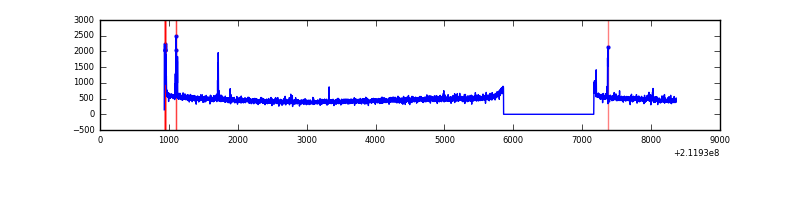 |
| B | 7433 | 6124 | 5 | 5 | 0.07% | 0.08% | 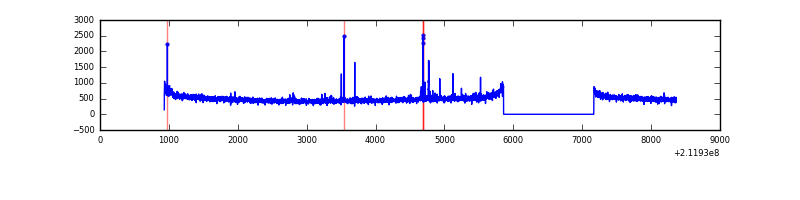 |
| C | 7433 | 6124 | 0 | 0 | 0.00% | 0.00% | 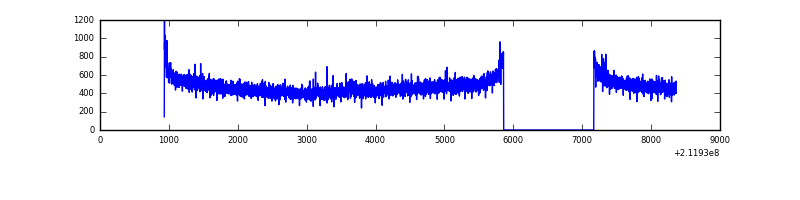 |
| D | 7433 | 6124 | 948 | 948 | 12.75% | 15.48% | 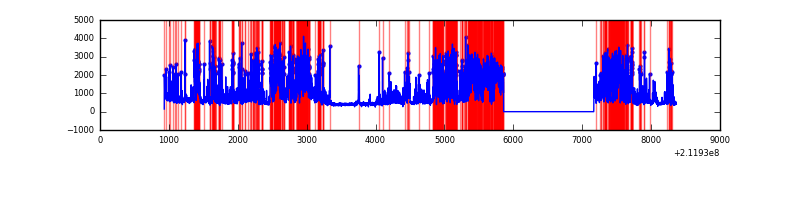 |
Top three noisy pixels from each quadrant. If the there are fewer than three noisy pixels in the level2.evt file, extra rows are filled as -1
| Pixel properties | Quadrant properties | ||||||
|---|---|---|---|---|---|---|---|
| Quadrant | DetID | PixID | Counts | Sigma | Mean | Median | Sigma |
| A | 0 | 50 | 95956 | 638.84 | 738 | 722 | 149.1 |
| A | 13 | 251 | 7986 | 48.73 | 738 | 722 | 149.1 |
| A | 0 | 226 | 7258 | 43.84 | 738 | 722 | 149.1 |
| B | 10 | 16 | 36806 | 251.76 | 758 | 741 | 143.3 |
| B | 4 | 48 | 15508 | 103.09 | 758 | 741 | 143.3 |
| B | 15 | 204 | 13530 | 89.28 | 758 | 741 | 143.3 |
| C | 1 | 16 | 12179 | 67.78 | 732 | 738 | 168.8 |
| C | 12 | 4 | 6356 | 33.28 | 732 | 738 | 168.8 |
| C | 13 | 61 | 6004 | 31.2 | 732 | 738 | 168.8 |
| D | 11 | 145 | 2959237 | 18144.28 | 660 | 643 | 163.1 |
| D | 2 | 136 | 975871 | 5980.82 | 660 | 643 | 163.1 |
| D | 8 | 195 | 64273 | 390.23 | 660 | 643 | 163.1 |
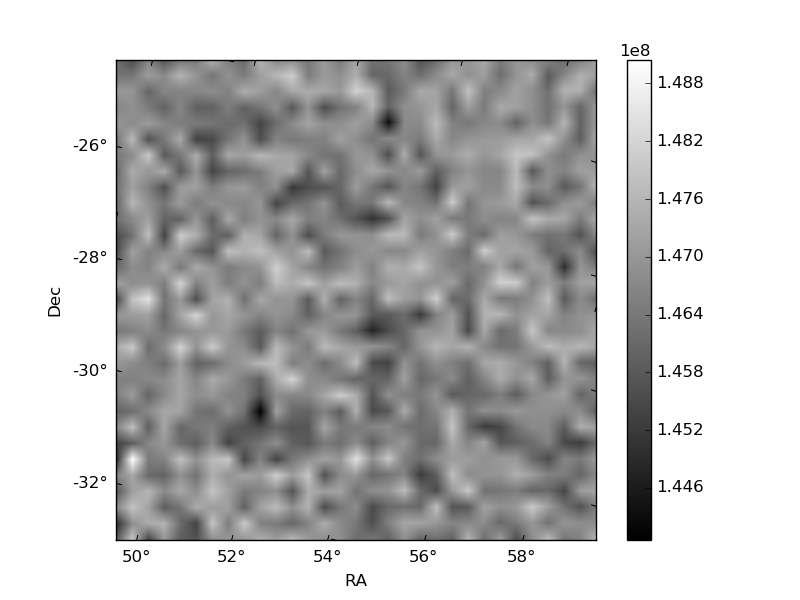
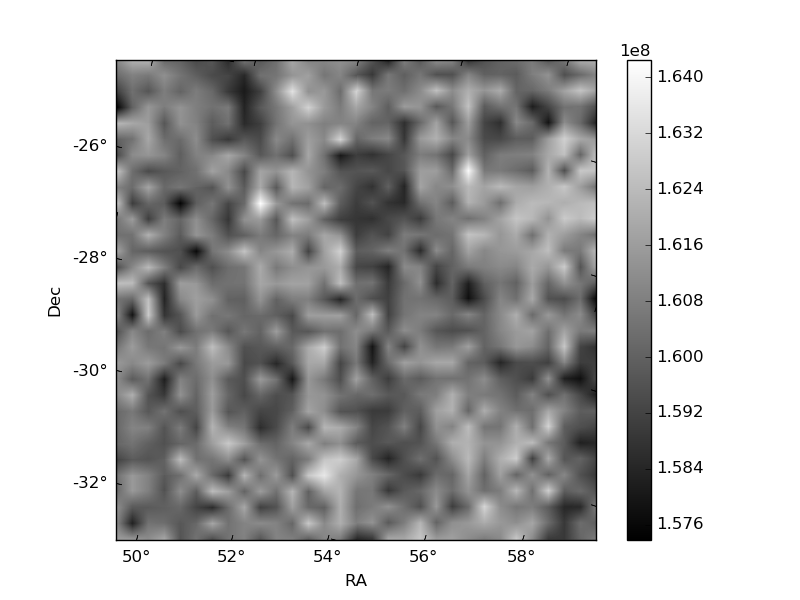
Histogram calculated using DETX and DETY for each event in the final _common_clean file
| Quadrant A | 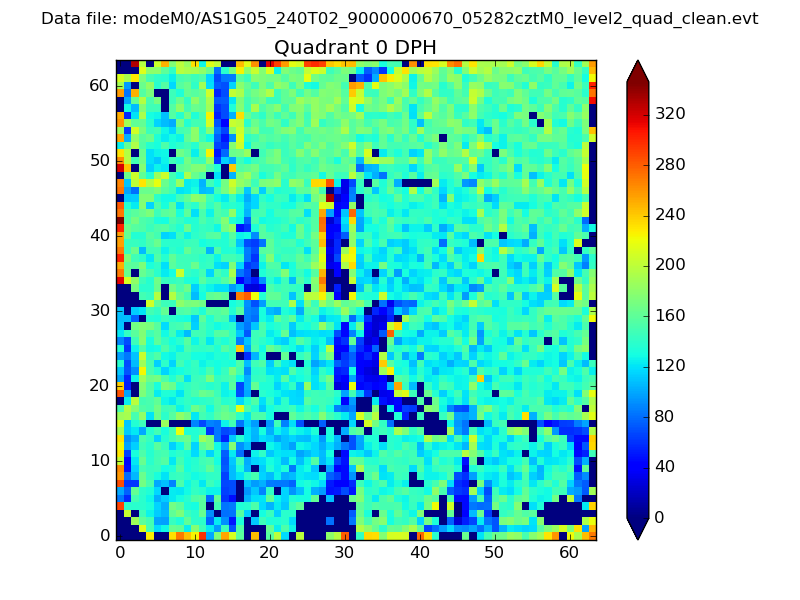 |
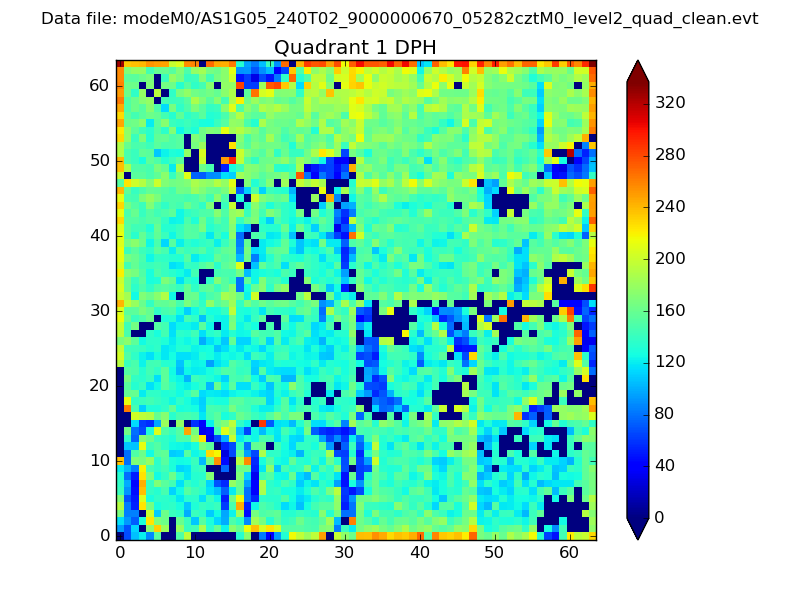 |
Quadrant B |
|---|---|---|---|
| Quadrant D |  |
 |
Quadrant C |
| Plot type | Count rate plots | Images |
|---|---|---|
| Comparison with Poisson distribution Blue bars denote a histogram of data divided into 1 sec bins. Red curve is a Poisson curve with rate = median count rate of data. |
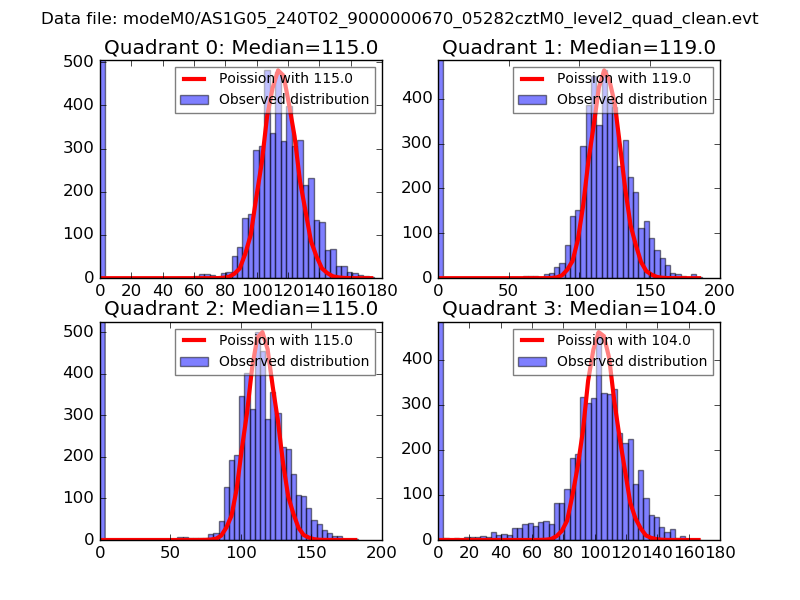 |
 |
| Quadrant-wise count rates Data is divided into 100 sec bins |
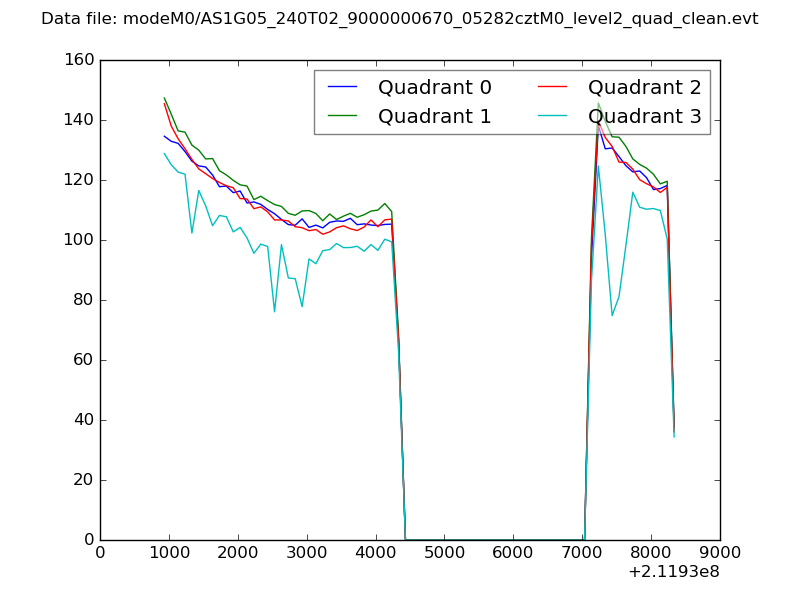 |
|
| Module-wise count rates for Quadrant A Data is divided into 100 sec bins |
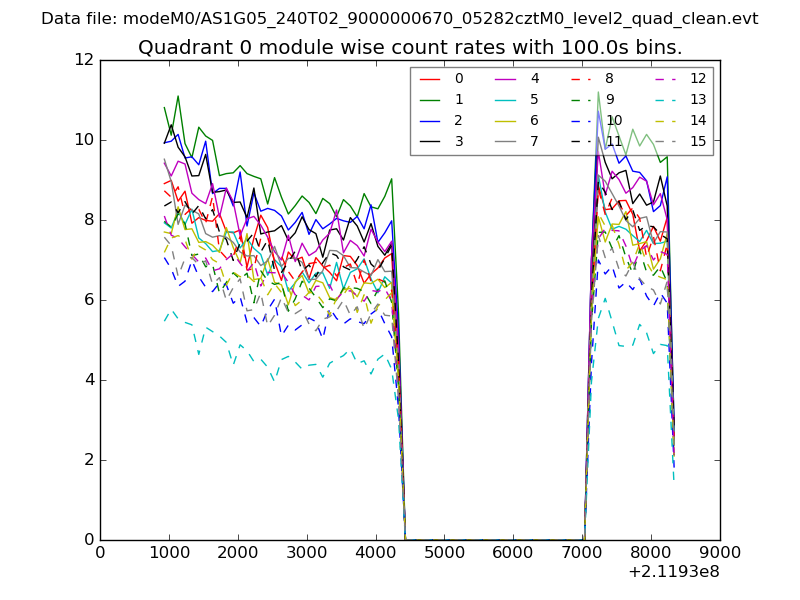 |
 |
| Module-wise count rates for Quadrant B Data is divided into 100 sec bins |
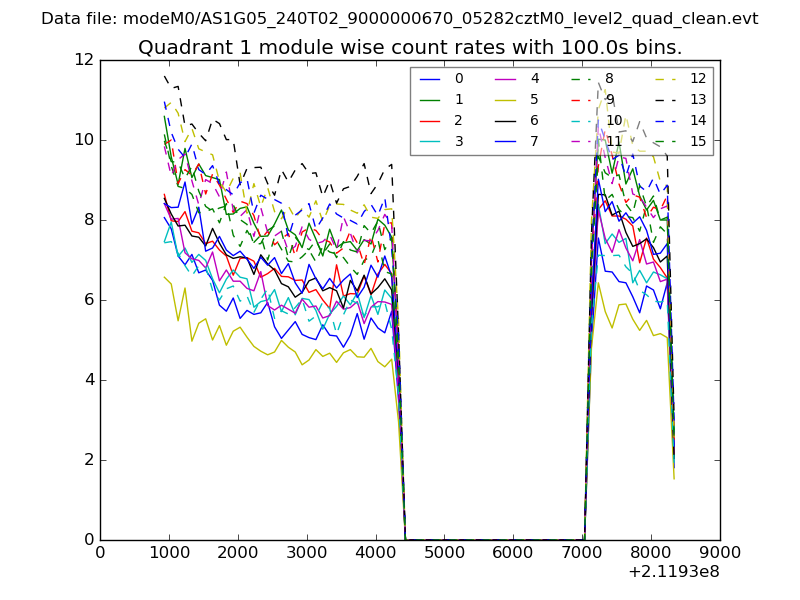 |
 |
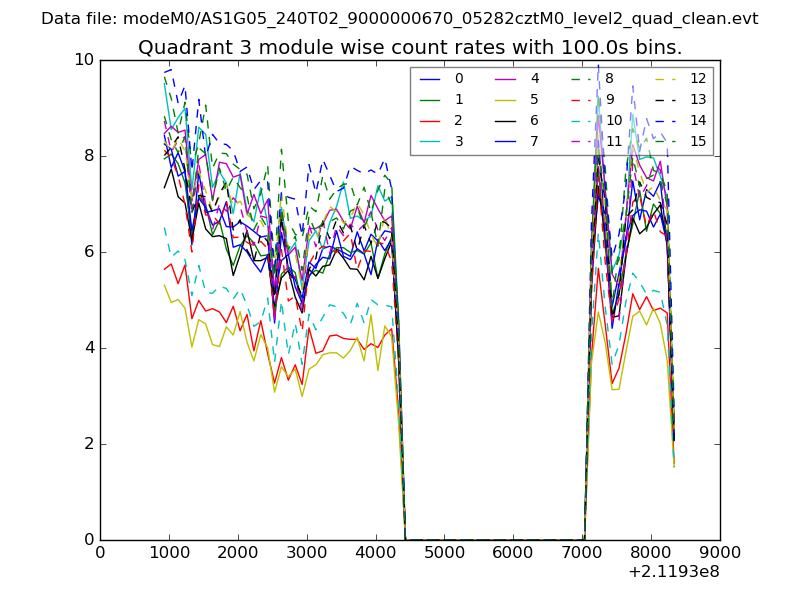
| Module-wise count rates for Quadrant C Data is divided into 100 sec bins |
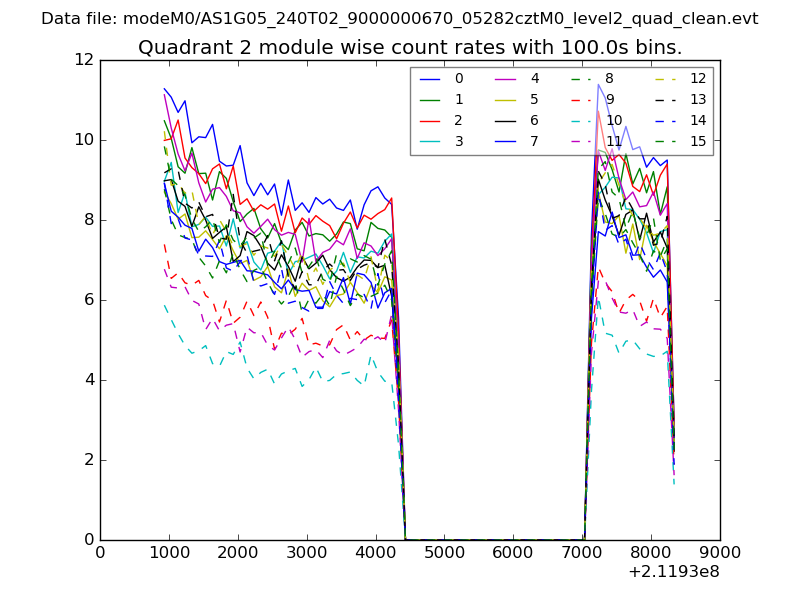 |
 |
| Module-wise count rates for Quadrant D Data is divided into 100 sec bins |
 |
 |
| Parameter | Plot |
|---|---|
| CZT HV Monitor | 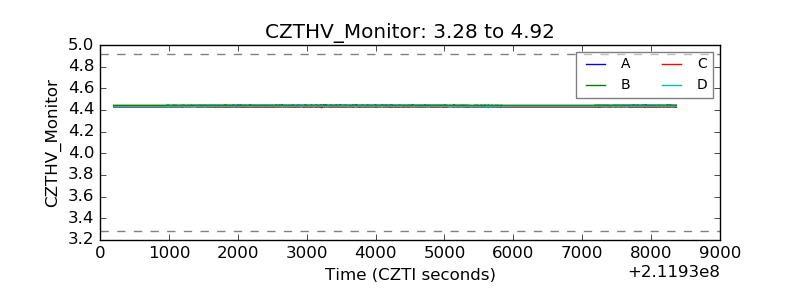 |
| D_VDD |  |
| Temperature 1 | 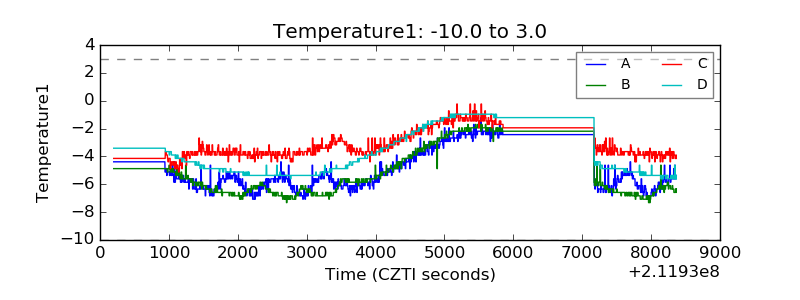 |
| Veto HV Monitor | 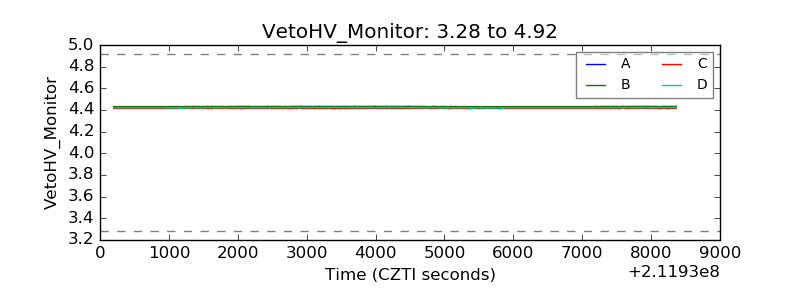 |
| Veto LLD | 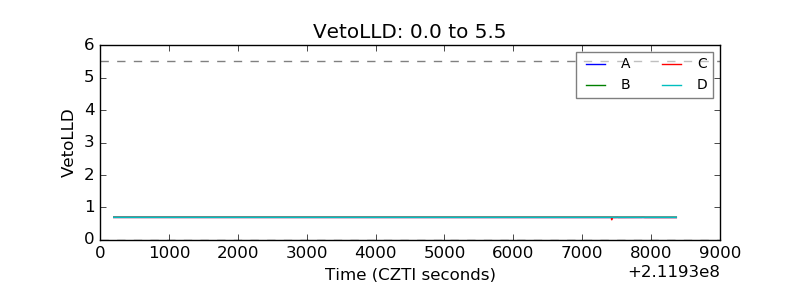 |
| Alpha Counter | 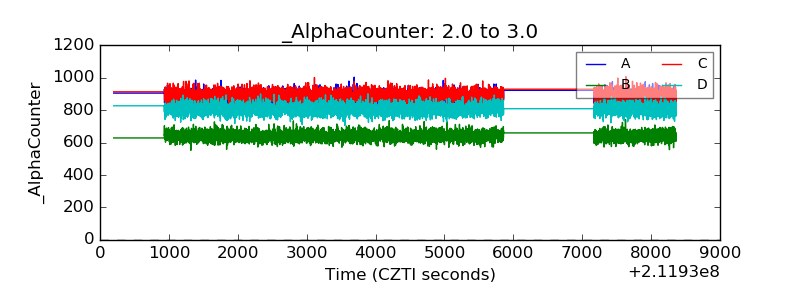 |
| _CPM_Rate | 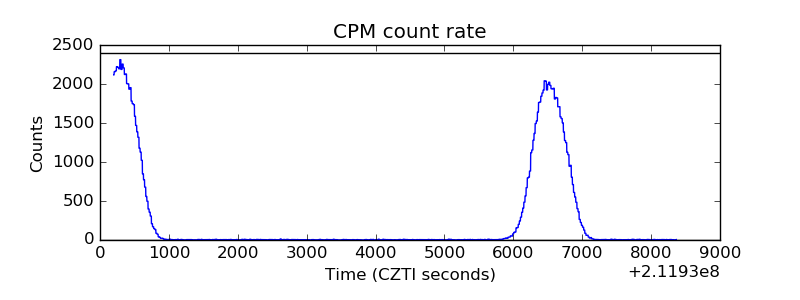 |
| CZT Counter |  |
| +2.5 Volts monitor |  |
| +5 Volts monitor |  |
| _ROLL_ROT | 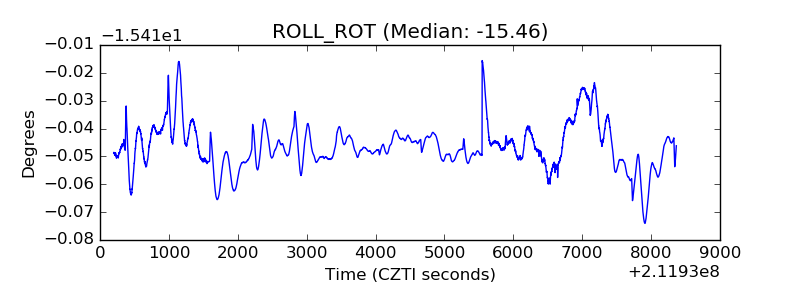 |
| _Roll_DEC | 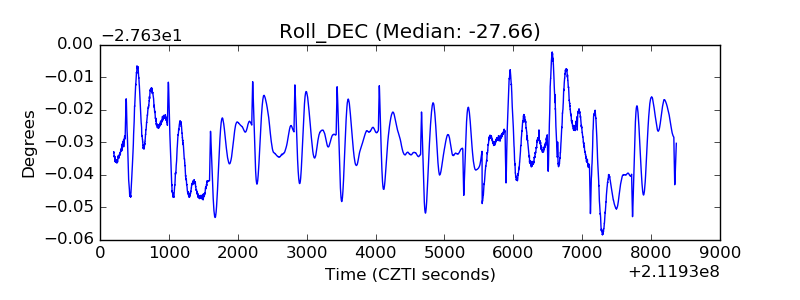 |
| _Roll_RA | 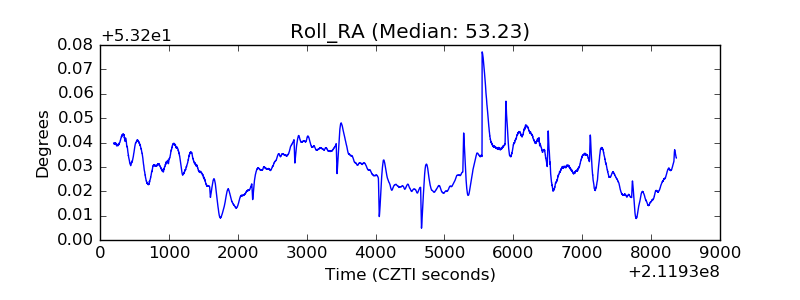 |
| Veto Counter | 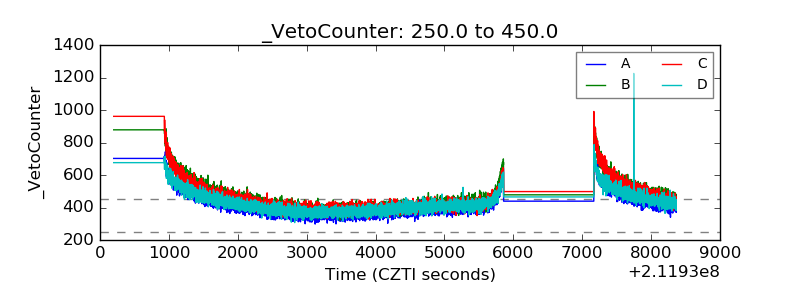 |