| Param | Original file | Final file |
|---|---|---|
| Filename | modeM0/AS1G05_240T02_9000000670_05283cztM0_level2.evt | modeM0/AS1G05_240T02_9000000670_05283cztM0_level2_quad_clean.evt |
| Size (bytes) | 534,576,960 | 85,170,240 |
| Size | 509.8 MB | 81.2 MB |
| Events in quadrant A | 3,078,389 | 543,526 |
| Events in quadrant B | 3,220,636 | 560,151 |
| Events in quadrant C | 3,075,943 | 541,942 |
| Events in quadrant D | 6,368,955 | 475,264 |
| Mode SS | |||
|---|---|---|---|
| Quadrant | BADHDUFLAG | Total packets | Discarded packets |
| A | 0 | 134 | 0 |
| B | 0 | 134 | 0 |
| C | 0 | 134 | 0 |
| D | 0 | 134 | 0 |
| Mode M9 | |||
|---|---|---|---|
| Quadrant | BADHDUFLAG | Total packets | Discarded packets |
| A | 0 | 20 | 0 |
| B | 0 | 20 | 0 |
| C | 0 | 20 | 0 |
| D | 0 | 21 | 0 |
| Mode M0 | |||
|---|---|---|---|
| Quadrant | BADHDUFLAG | Total packets | Discarded packets |
| A | 0 | 13591 | 3 |
| B | 0 | 13784 | 2 |
| C | 0 | 13490 | 2 |
| D | 0 | 23604 | 2 |
| Quadrant | Total seconds | Saturated seconds | Saturation percentage |
|---|---|---|---|
| A | 6567 | 19 | 0.289325% |
| B | 6567 | 26 | 0.395919% |
| C | 6567 | 11 | 0.167504% |
| D | 6567 | 973 | 14.816507% |
Noise dominated data is calculated using 1-second bins in cleaned event files. If a bin has >2000 counts, and if more than 50% of those come from <1% of pixels, then it is considered to be noise-dominated and hence unusable.
| Quadrant | # 1 sec bins | Bins with >0 counts | Bins with >2000 counts | High rate bins dominated by noise | Noise dominated (total time) | Noise dominated (detector-on time) | Marked lightcurve |
|---|---|---|---|---|---|---|---|
| A | 7877 | 6568 | 1 | 1 | 0.01% | 0.02% |  |
| B | 7877 | 6568 | 0 | 0 | 0.00% | 0.00% | 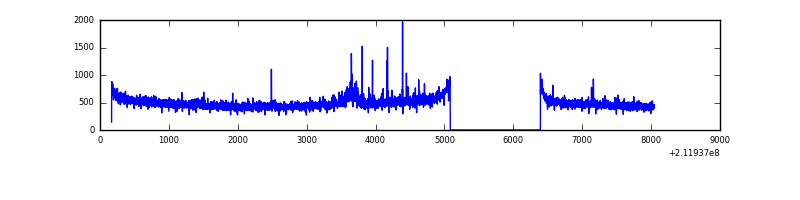 |
| C | 7877 | 6568 | 0 | 0 | 0.00% | 0.00% |  |
| D | 7877 | 6568 | 784 | 784 | 9.95% | 11.94% | 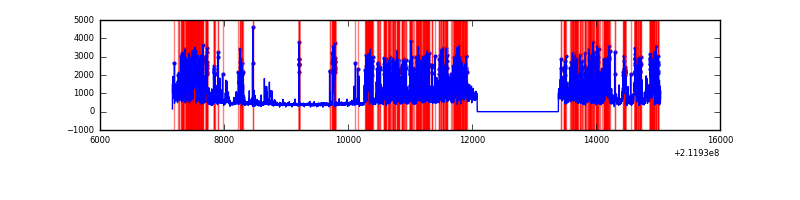 |
Top three noisy pixels from each quadrant. If the there are fewer than three noisy pixels in the level2.evt file, extra rows are filled as -1
| Pixel properties | Quadrant properties | ||||||
|---|---|---|---|---|---|---|---|
| Quadrant | DetID | PixID | Counts | Sigma | Mean | Median | Sigma |
| A | 0 | 50 | 34990 | 216.35 | 786 | 769 | 158.2 |
| A | 13 | 14 | 9126 | 52.83 | 786 | 769 | 158.2 |
| A | 0 | 226 | 7674 | 43.65 | 786 | 769 | 158.2 |
| B | 4 | 48 | 75636 | 491.26 | 805 | 787 | 152.4 |
| B | 15 | 54 | 15996 | 99.82 | 805 | 787 | 152.4 |
| B | 12 | 111 | 13868 | 85.86 | 805 | 787 | 152.4 |
| C | 8 | 128 | 17085 | 90.52 | 779 | 783 | 180.1 |
| C | 8 | 112 | 7467 | 37.12 | 779 | 783 | 180.1 |
| C | 8 | 144 | 6609 | 32.35 | 779 | 783 | 180.1 |
| D | 11 | 145 | 3159286 | 17769.07 | 720 | 698 | 177.8 |
| D | 2 | 136 | 196677 | 1102.51 | 720 | 698 | 177.8 |
| D | 2 | 16 | 138602 | 775.8 | 720 | 698 | 177.8 |
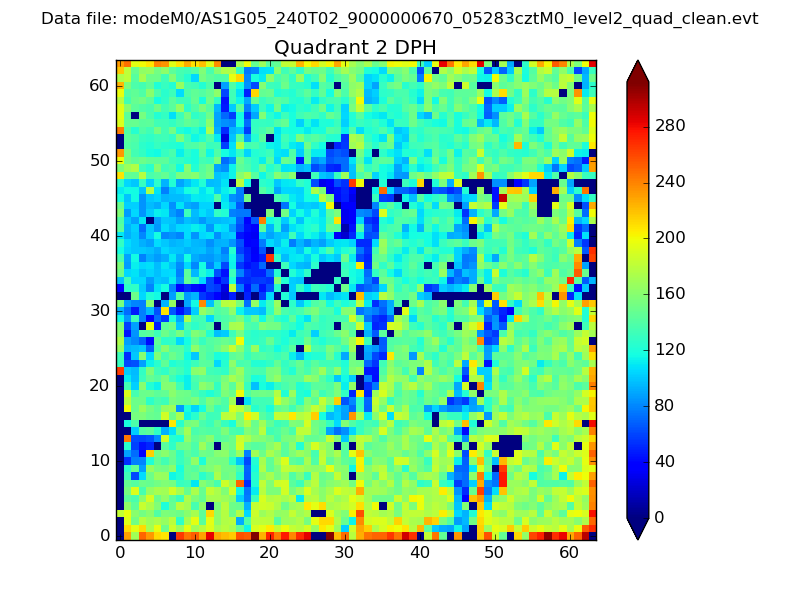
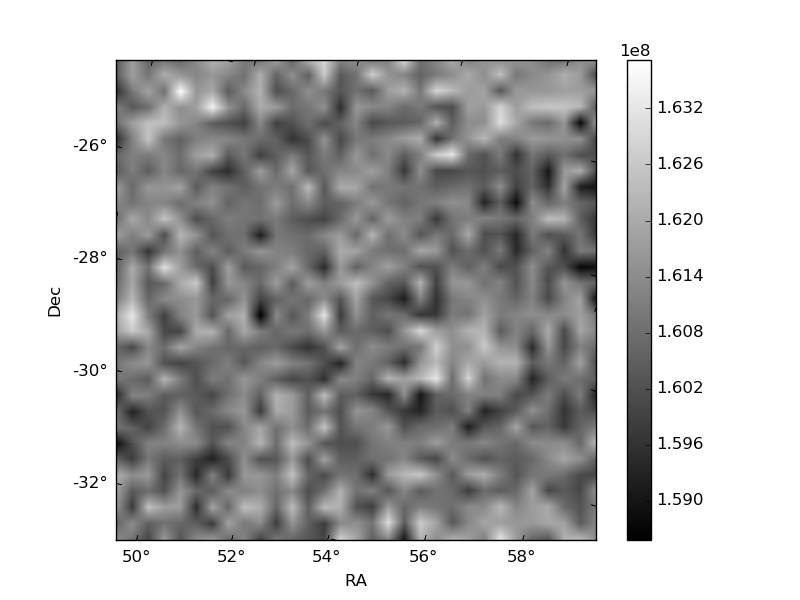
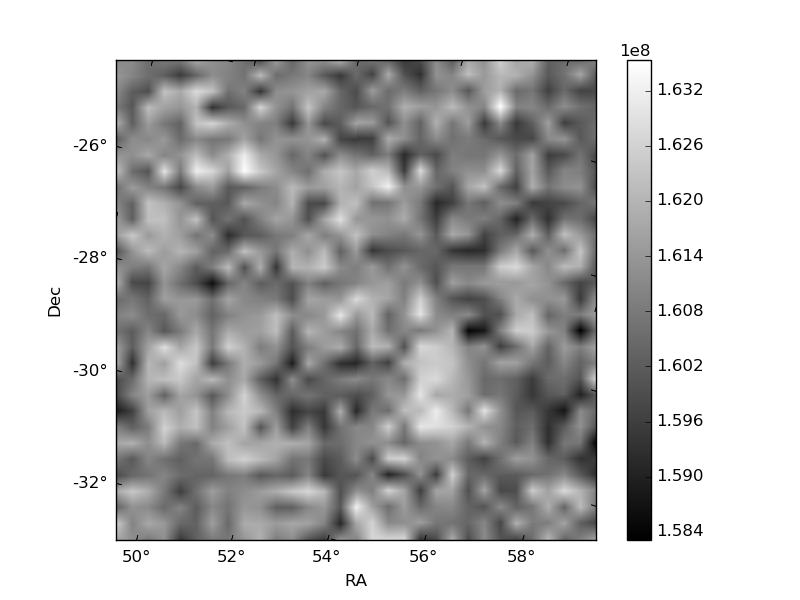
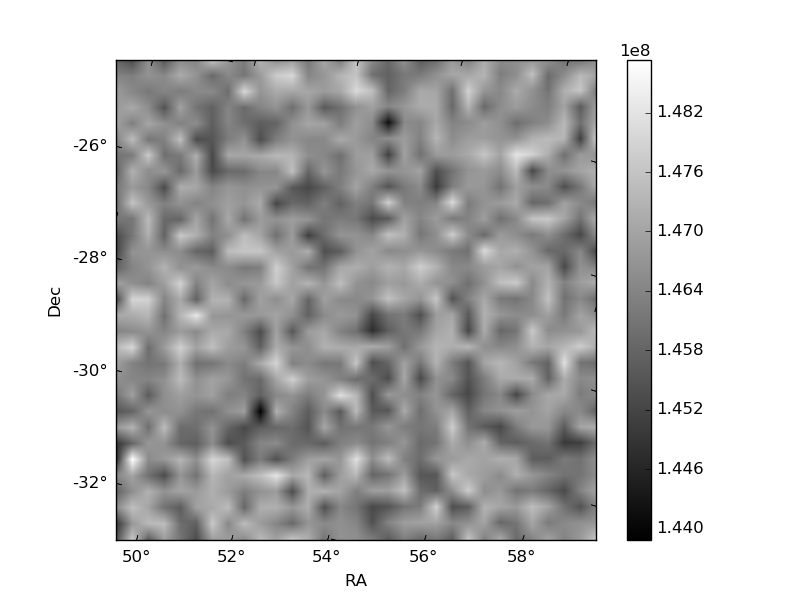
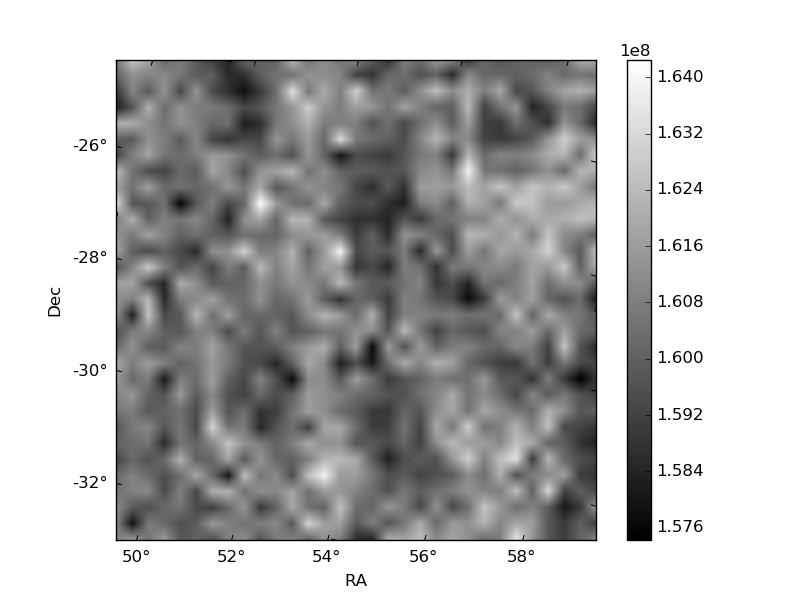
Histogram calculated using DETX and DETY for each event in the final _common_clean file
| Quadrant A | 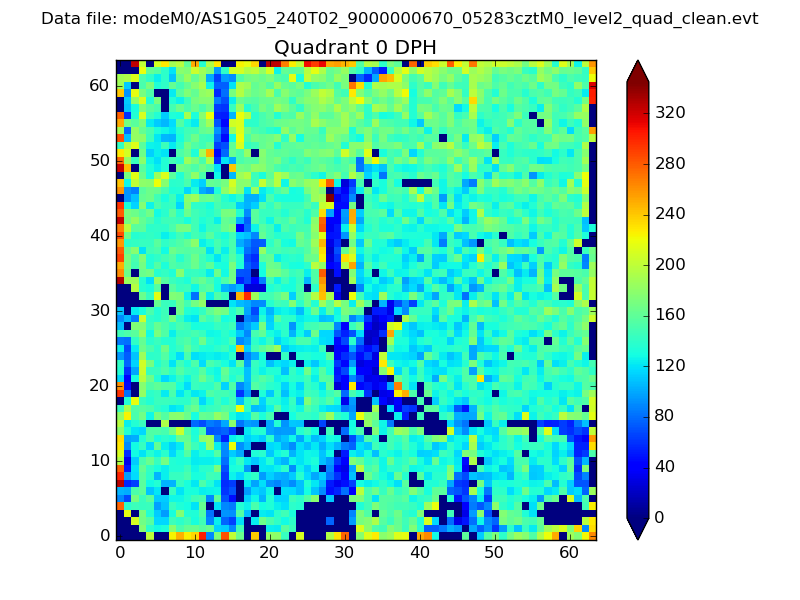 |
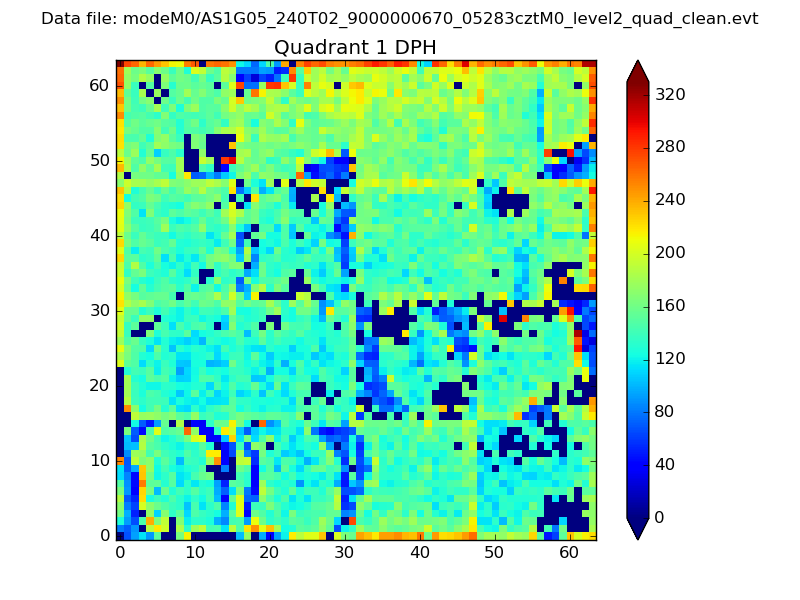 |
Quadrant B |
|---|---|---|---|
| Quadrant D | 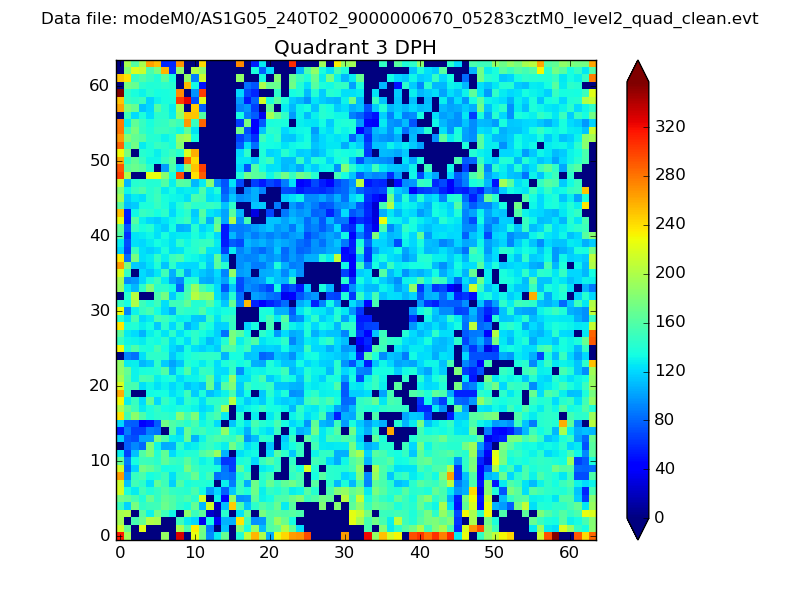 |
 |
Quadrant C |
| Plot type | Count rate plots | Images |
|---|---|---|
| Comparison with Poisson distribution Blue bars denote a histogram of data divided into 1 sec bins. Red curve is a Poisson curve with rate = median count rate of data. |
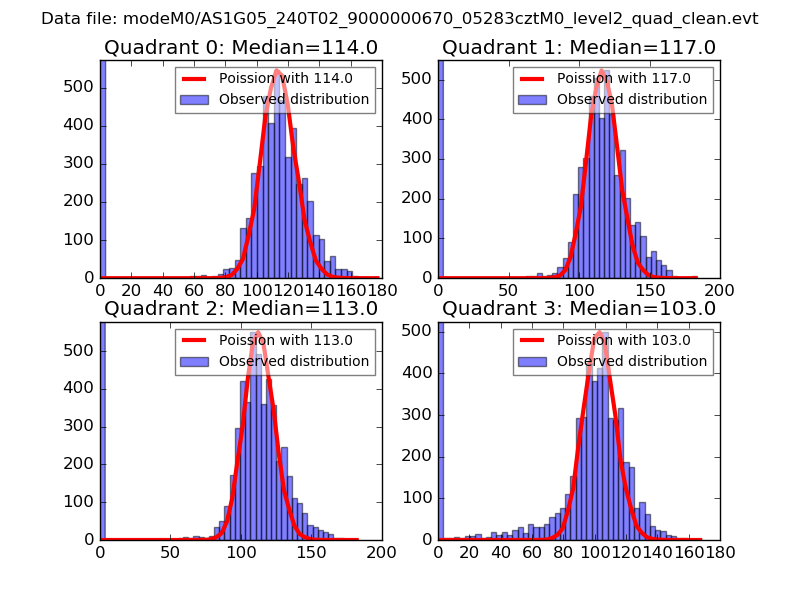 |
 |
| Quadrant-wise count rates Data is divided into 100 sec bins |
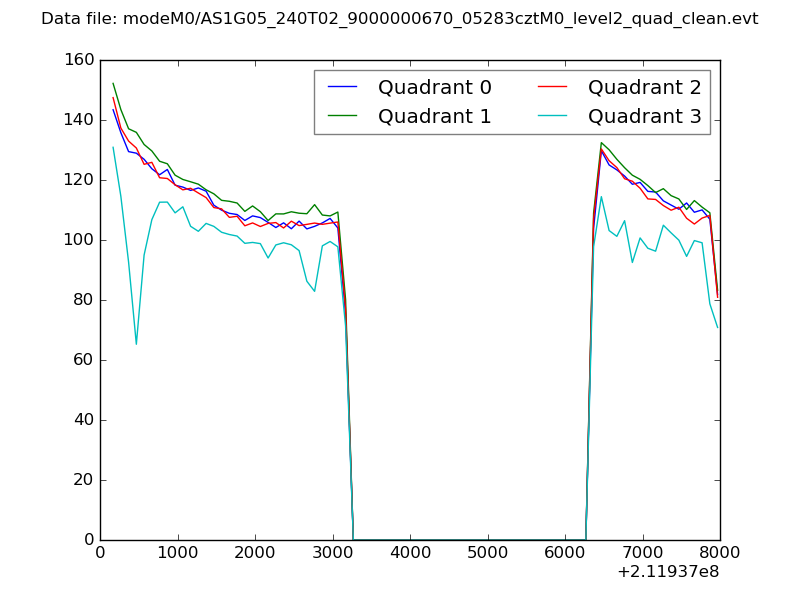 |
|
| Module-wise count rates for Quadrant A Data is divided into 100 sec bins |
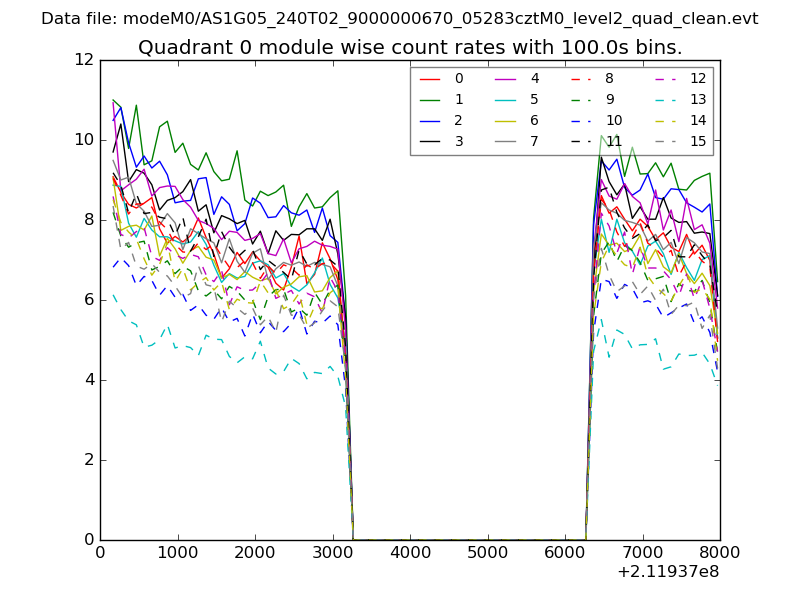 |
 |
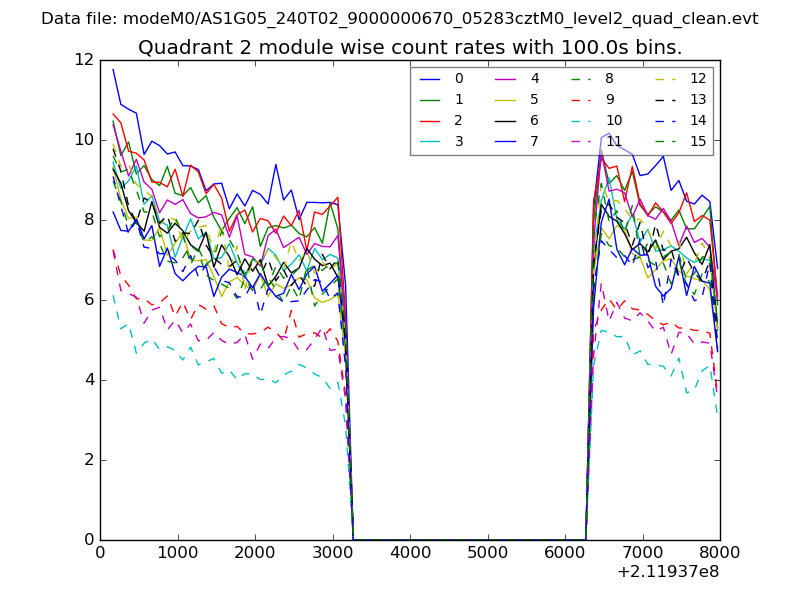
| Module-wise count rates for Quadrant B Data is divided into 100 sec bins |
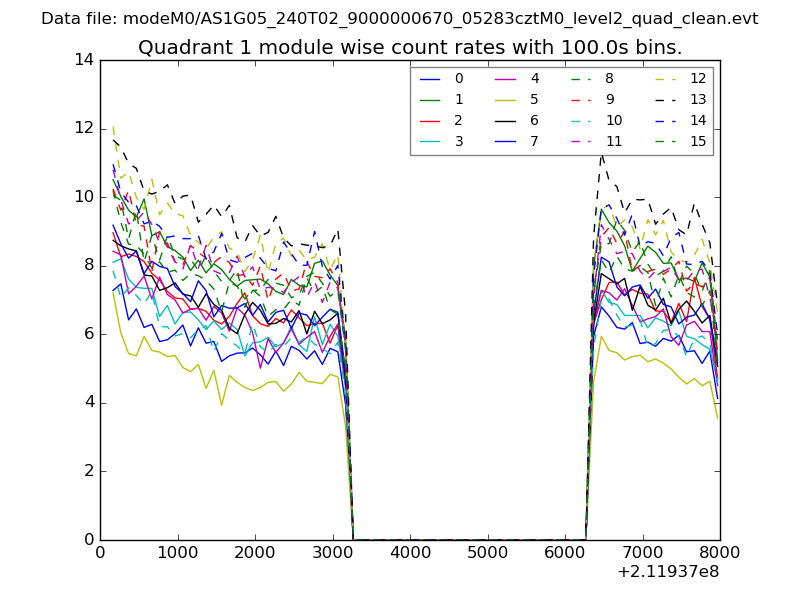 |
 |
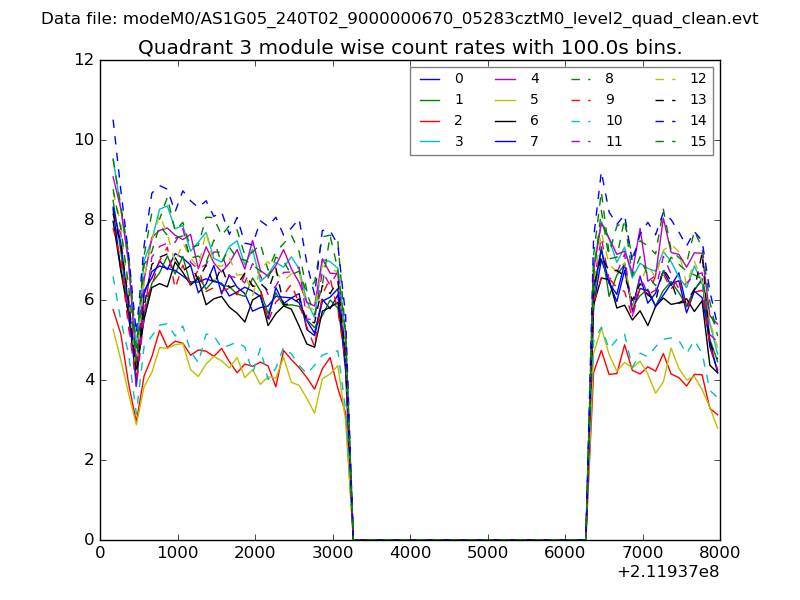
| Module-wise count rates for Quadrant C Data is divided into 100 sec bins |
 |
 |
| Module-wise count rates for Quadrant D Data is divided into 100 sec bins |
 |
 |
| Parameter | Plot |
|---|---|
| CZT HV Monitor | 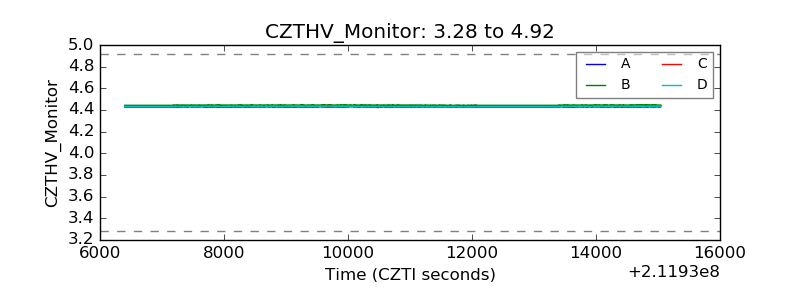 |
| D_VDD | 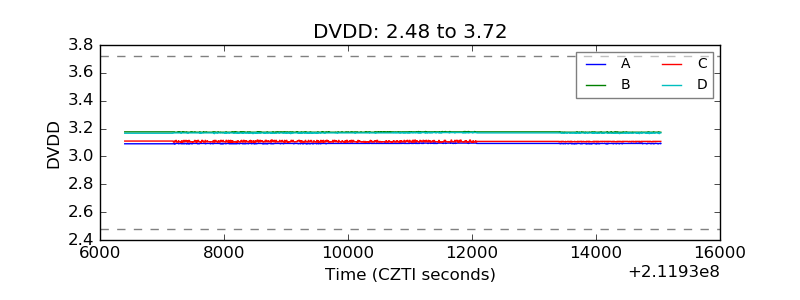 |
| Temperature 1 | 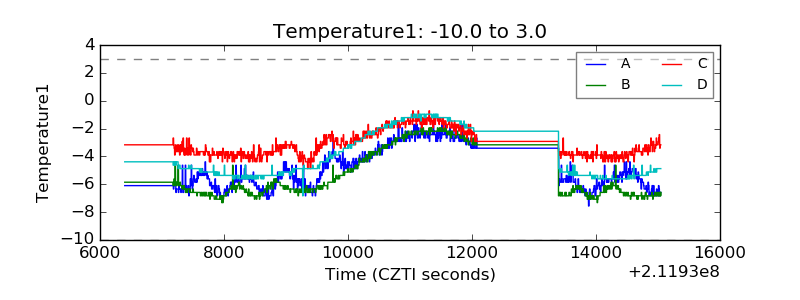 |
| Veto HV Monitor | 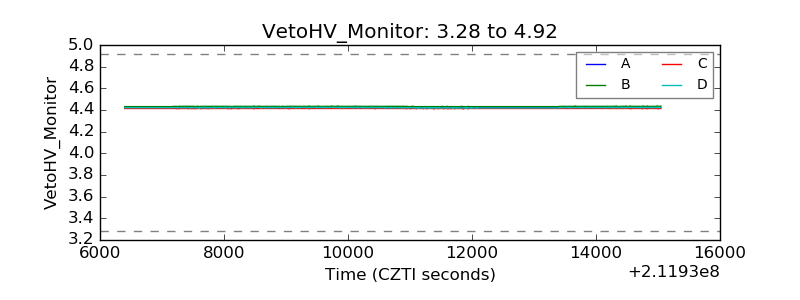 |
| Veto LLD | 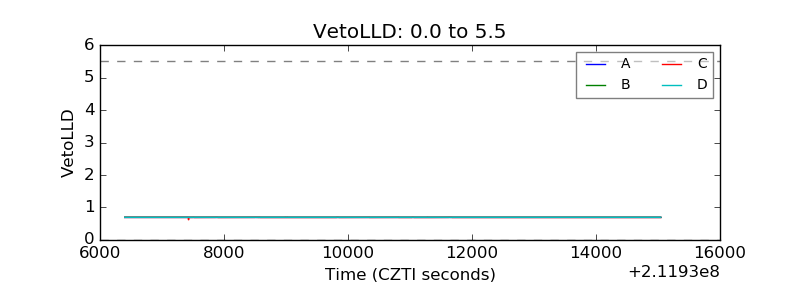 |
| Alpha Counter | 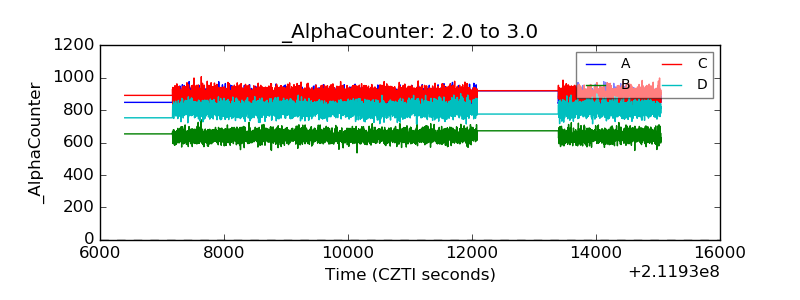 |
| _CPM_Rate | 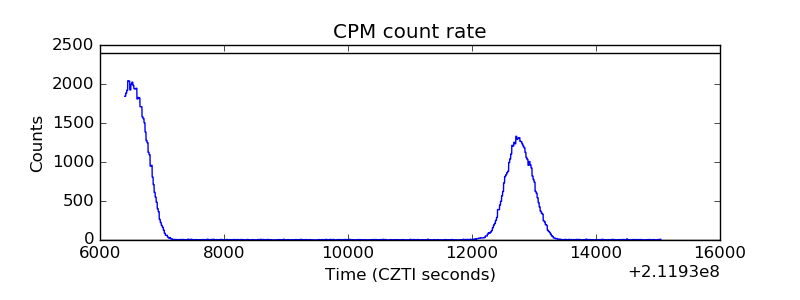 |
| CZT Counter | 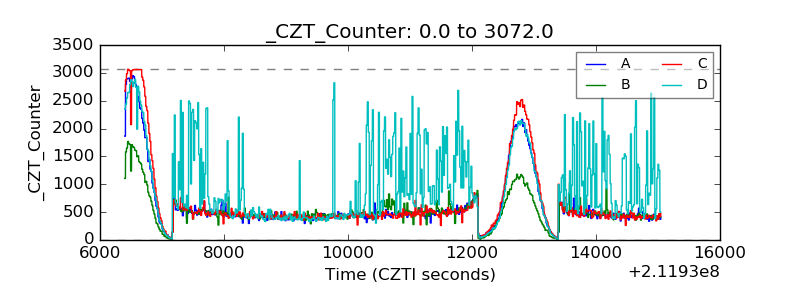 |
| +2.5 Volts monitor | 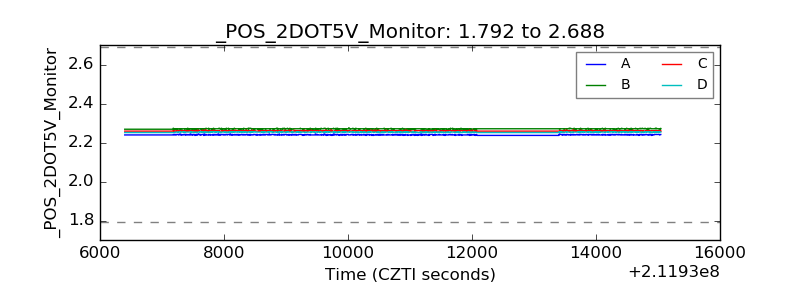 |
| +5 Volts monitor |  |
| _ROLL_ROT | 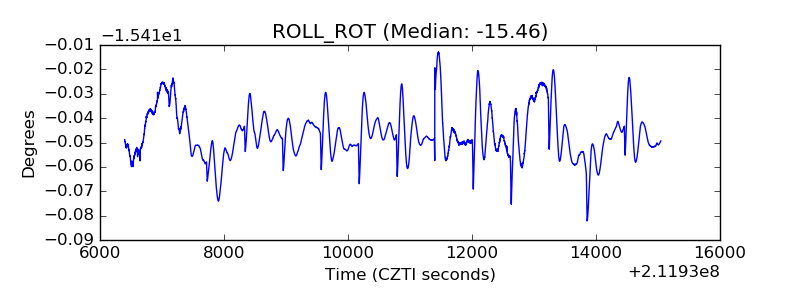 |
| _Roll_DEC | 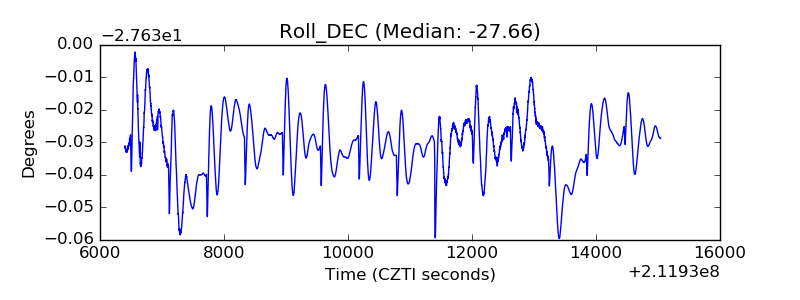 |
| _Roll_RA | 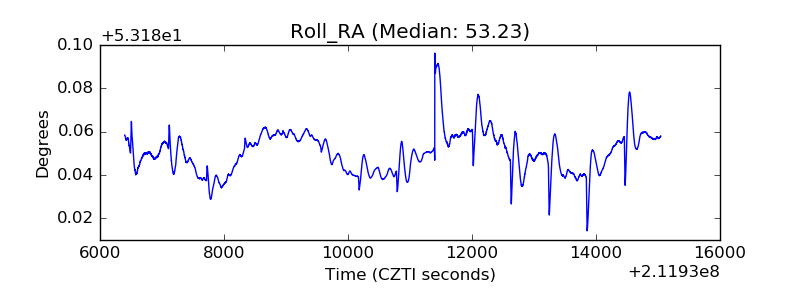 |
| Veto Counter | 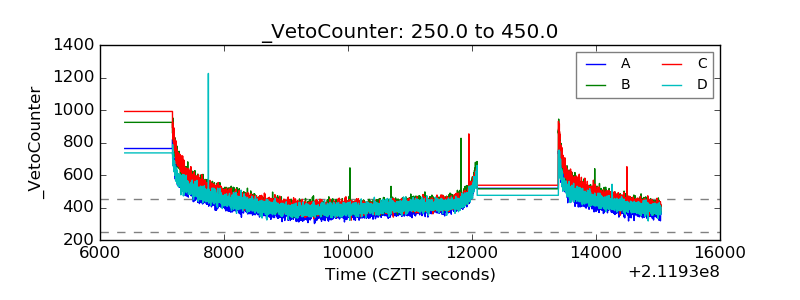 |