| Param | Original file | Final file |
|---|---|---|
| Filename | modeM0/AS1G05_240T02_9000000670_05284cztM0_level2.evt | modeM0/AS1G05_240T02_9000000670_05284cztM0_level2_quad_clean.evt |
| Size (bytes) | 207,236,160 | 43,683,840 |
| Size | 197.6 MB | 41.7 MB |
| Events in quadrant A | 1,149,393 | 291,640 |
| Events in quadrant B | 1,188,832 | 298,781 |
| Events in quadrant C | 1,154,164 | 291,171 |
| Events in quadrant D | 2,604,737 | 254,153 |
| Mode SS | |||
|---|---|---|---|
| Quadrant | BADHDUFLAG | Total packets | Discarded packets |
| A | 0 | 54 | 2 |
| B | 0 | 54 | 0 |
| C | 0 | 54 | 0 |
| D | 0 | 54 | 0 |
| Mode M9 | |||
|---|---|---|---|
| Quadrant | BADHDUFLAG | Total packets | Discarded packets |
| A | 0 | 7 | 0 |
| B | 0 | 7 | 0 |
| C | 0 | 7 | 0 |
| D | 0 | 8 | 0 |
| Mode M0 | |||
|---|---|---|---|
| Quadrant | BADHDUFLAG | Total packets | Discarded packets |
| A | 0 | 5320 | 16 |
| B | 0 | 5326 | 19 |
| C | 0 | 5300 | 15 |
| D | 0 | 9673 | 139 |
| Quadrant | Total seconds | Saturated seconds | Saturation percentage |
|---|---|---|---|
| A | 2605 | 2 | 0.076775% |
| B | 2603 | 5 | 0.192086% |
| C | 2605 | 3 | 0.115163% |
| D | 2581 | 290 | 11.235955% |
Noise dominated data is calculated using 1-second bins in cleaned event files. If a bin has >2000 counts, and if more than 50% of those come from <1% of pixels, then it is considered to be noise-dominated and hence unusable.
| Quadrant | # 1 sec bins | Bins with >0 counts | Bins with >2000 counts | High rate bins dominated by noise | Noise dominated (total time) | Noise dominated (detector-on time) | Marked lightcurve |
|---|---|---|---|---|---|---|---|
| A | 2612 | 2612 | 0 | 0 | 0.00% | 0.00% |  |
| B | 2612 | 2612 | 1 | 1 | 0.04% | 0.04% | 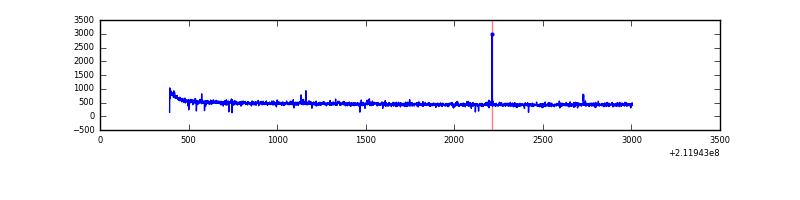 |
| C | 2612 | 2612 | 0 | 0 | 0.00% | 0.00% |  |
| D | 2612 | 2608 | 292 | 292 | 11.18% | 11.20% | 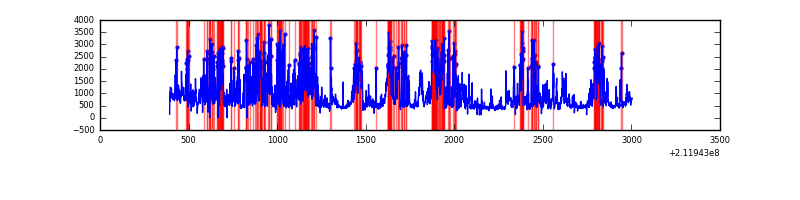 |
Top three noisy pixels from each quadrant. If the there are fewer than three noisy pixels in the level2.evt file, extra rows are filled as -1
| Pixel properties | Quadrant properties | ||||||
|---|---|---|---|---|---|---|---|
| Quadrant | DetID | PixID | Counts | Sigma | Mean | Median | Sigma |
| A | 0 | 50 | 8877 | 141.34 | 295 | 288 | 60.8 |
| A | 8 | 4 | 4770 | 73.76 | 295 | 288 | 60.8 |
| A | 0 | 226 | 2869 | 42.47 | 295 | 288 | 60.8 |
| B | 0 | 170 | 6854 | 111.55 | 303 | 298 | 58.8 |
| B | 12 | 111 | 5389 | 86.62 | 303 | 298 | 58.8 |
| B | 11 | 111 | 4098 | 64.65 | 303 | 298 | 58.8 |
| C | 13 | 61 | 2365 | 29.66 | 295 | 297 | 69.7 |
| C | 3 | 202 | 722 | 6.1 | 295 | 297 | 69.7 |
| C | 1 | 16 | 697 | 5.74 | 295 | 297 | 69.7 |
| D | 11 | 145 | 1427889 | 20771.38 | 274 | 266 | 68.7 |
| D | 2 | 16 | 103346 | 1499.78 | 274 | 266 | 68.7 |
| D | 8 | 195 | 19609 | 281.43 | 274 | 266 | 68.7 |
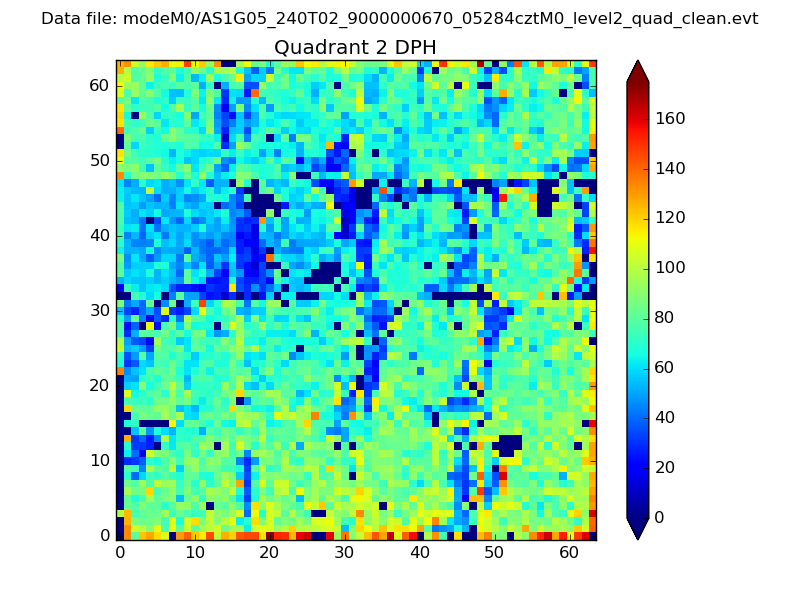
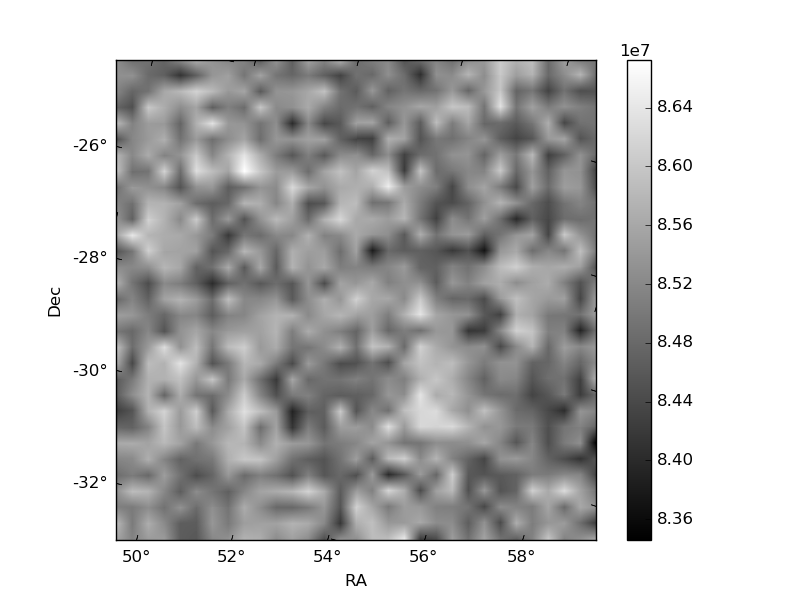
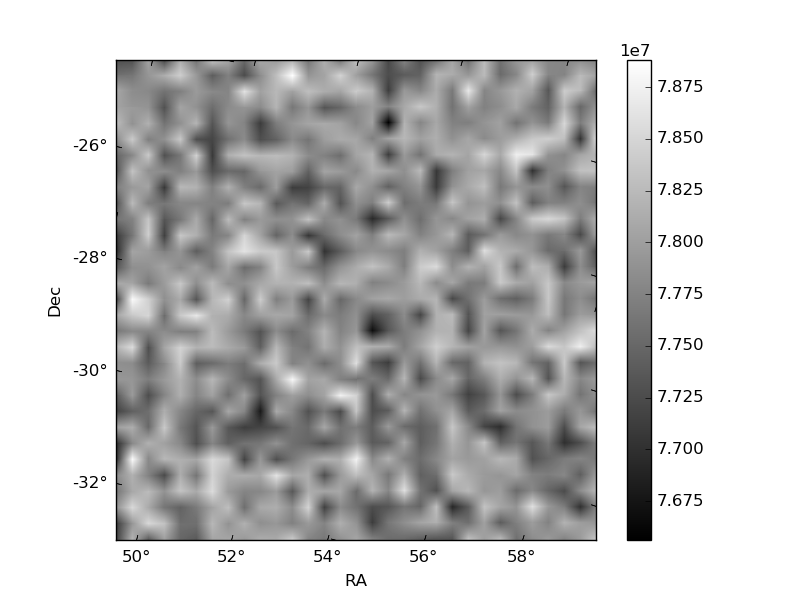
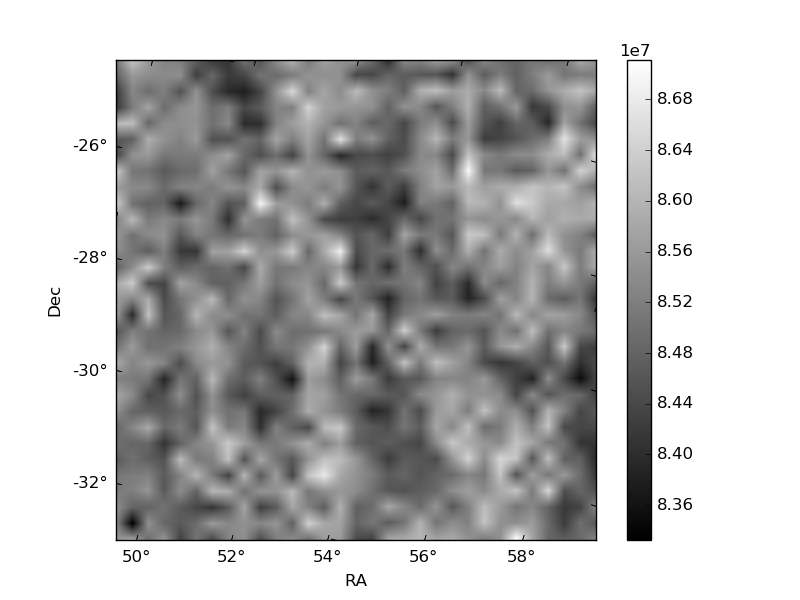
Histogram calculated using DETX and DETY for each event in the final _common_clean file
| Quadrant A | 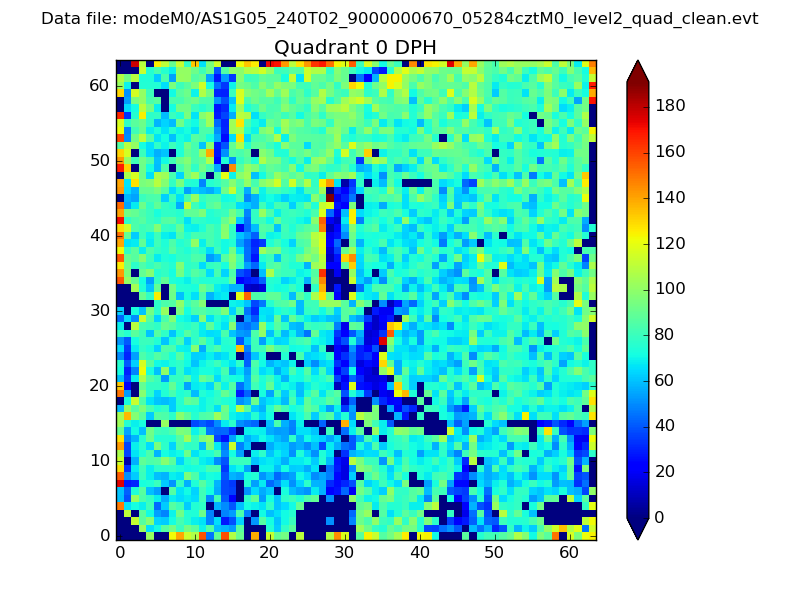 |
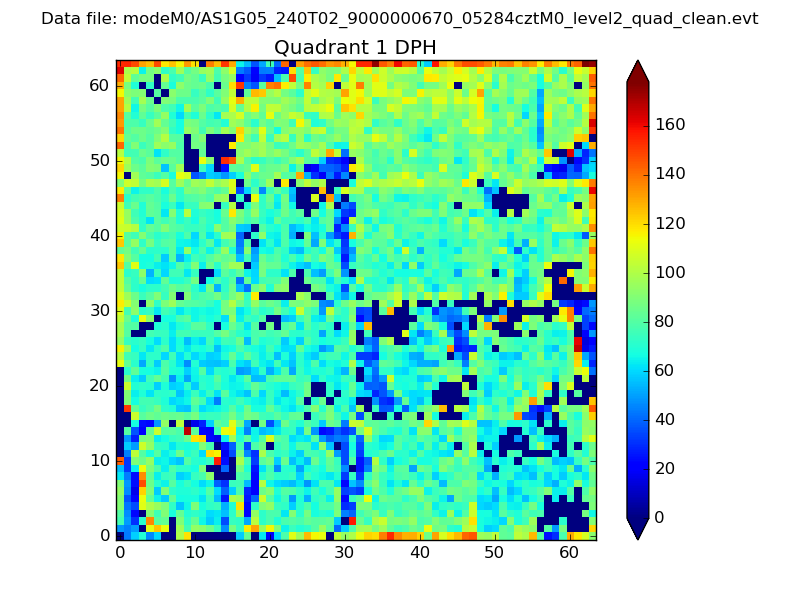 |
Quadrant B |
|---|---|---|---|
| Quadrant D | 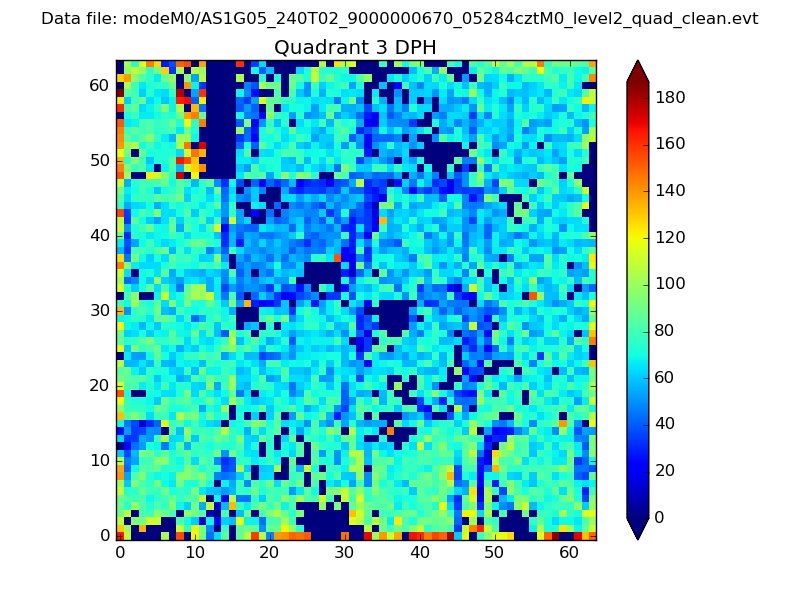 |
 |
Quadrant C |
| Plot type | Count rate plots | Images |
|---|---|---|
| Comparison with Poisson distribution Blue bars denote a histogram of data divided into 1 sec bins. Red curve is a Poisson curve with rate = median count rate of data. |
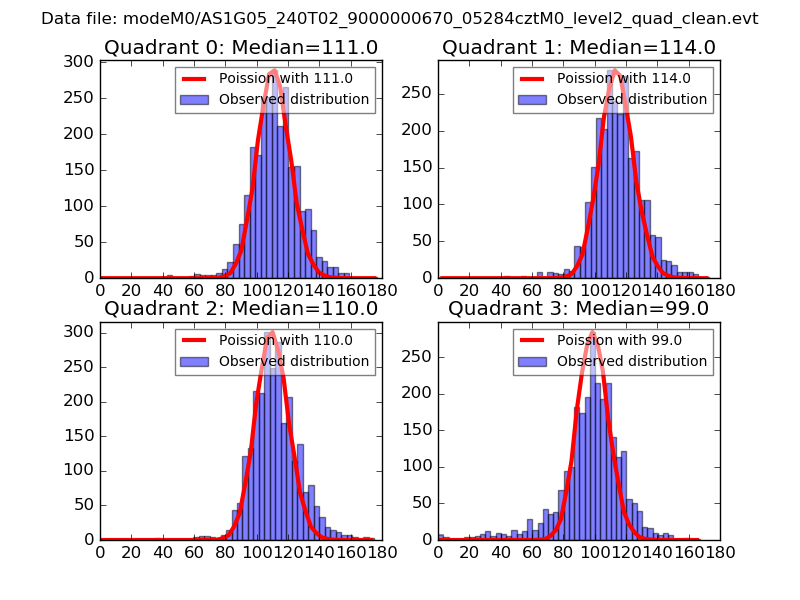 |
 |
| Quadrant-wise count rates Data is divided into 100 sec bins |
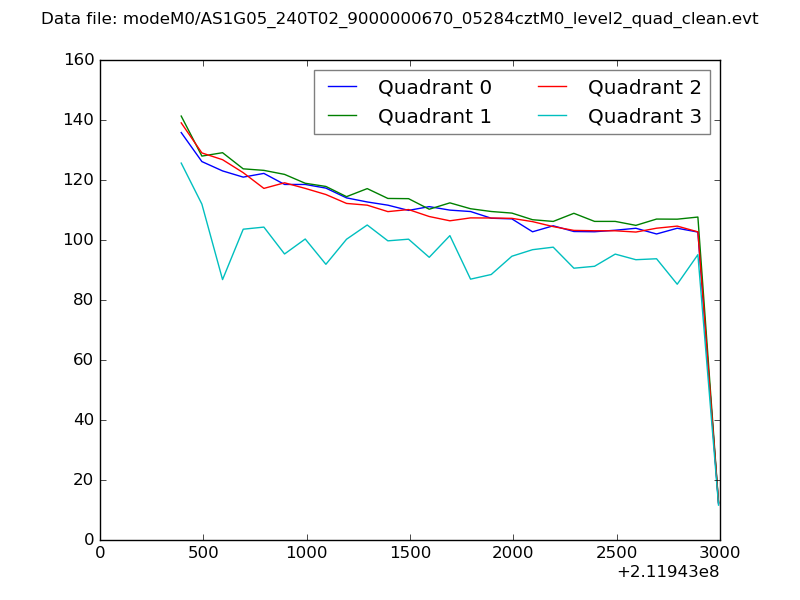 |
|
| Module-wise count rates for Quadrant A Data is divided into 100 sec bins |
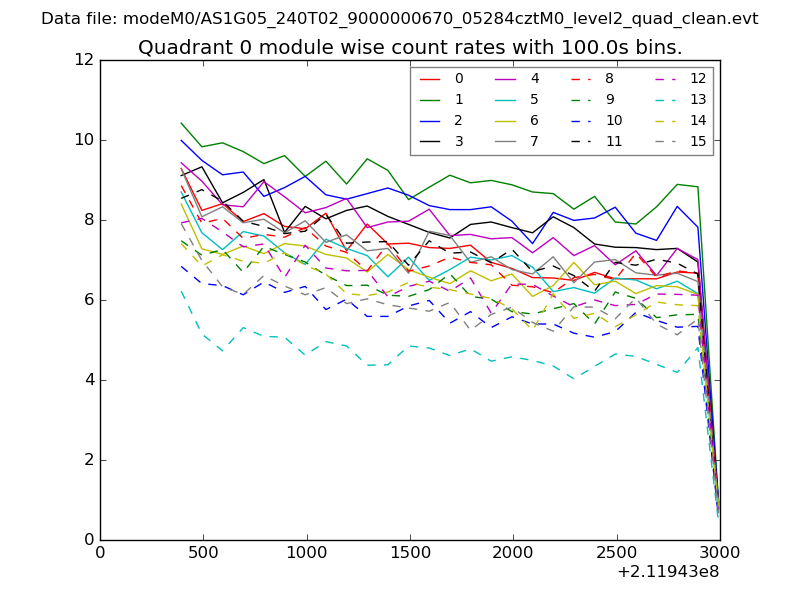 |
 |
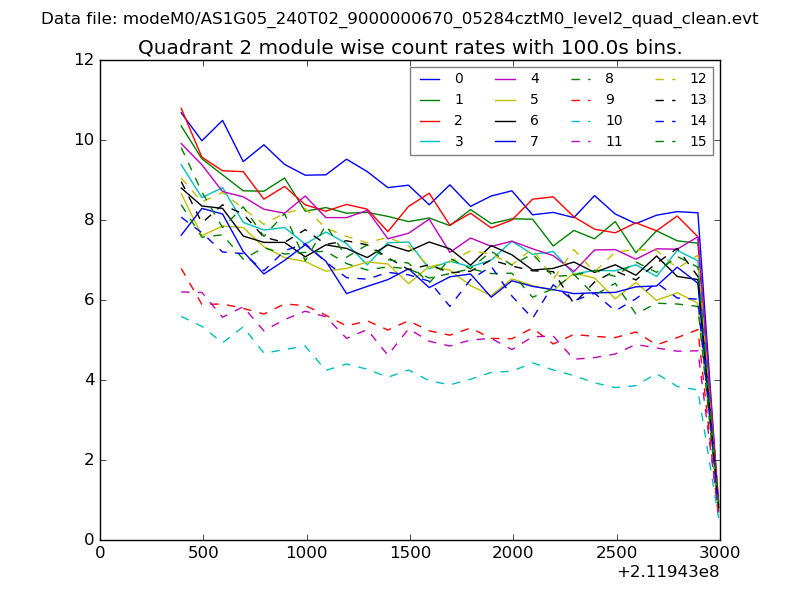
| Module-wise count rates for Quadrant B Data is divided into 100 sec bins |
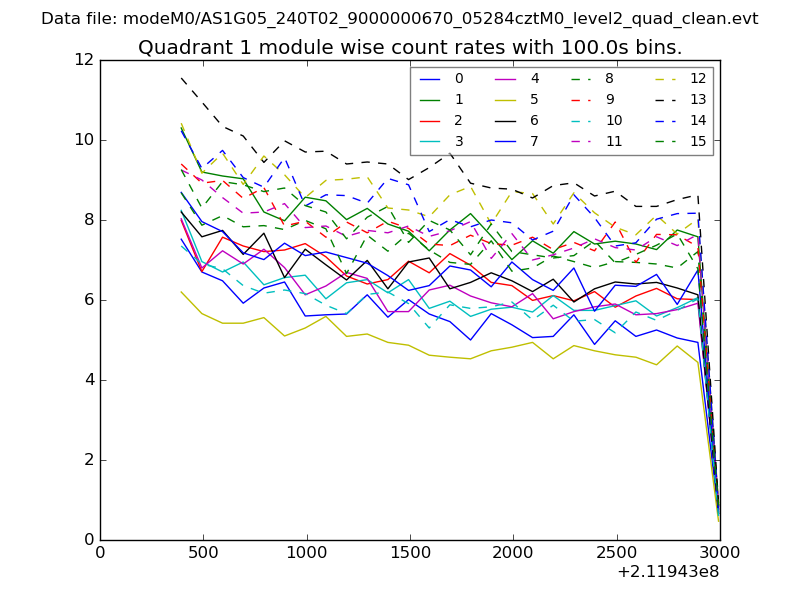 |
 |
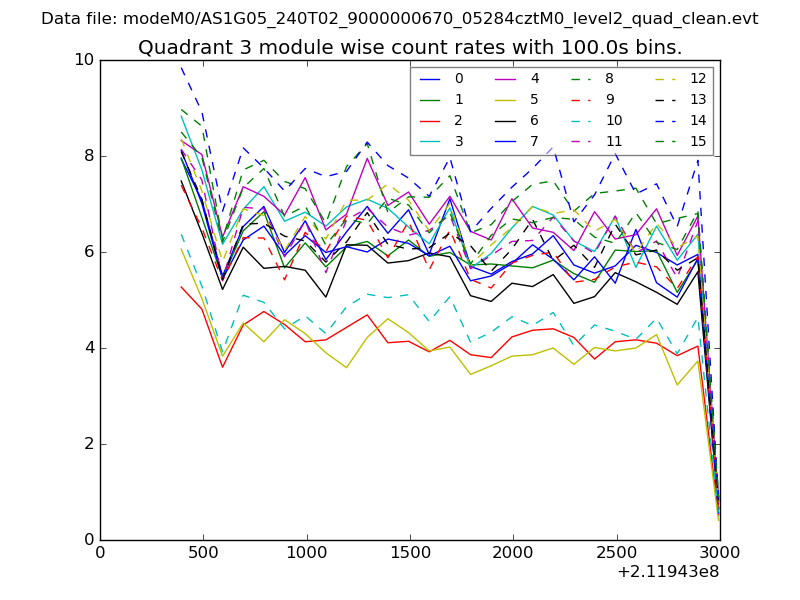
| Module-wise count rates for Quadrant C Data is divided into 100 sec bins |
 |
 |
| Module-wise count rates for Quadrant D Data is divided into 100 sec bins |
 |
 |
| Parameter | Plot |
|---|---|
| CZT HV Monitor | 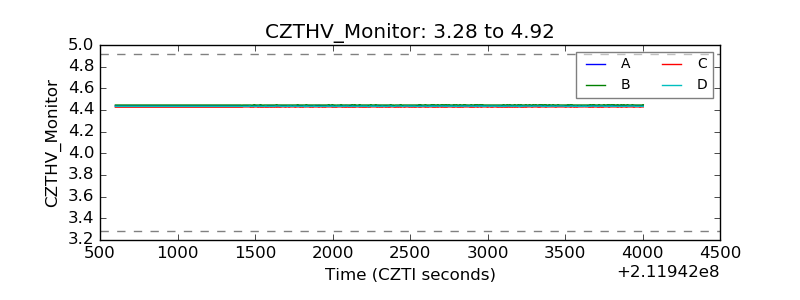 |
| D_VDD | 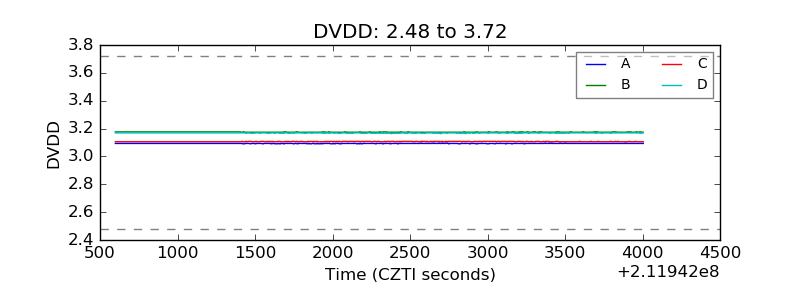 |
| Temperature 1 | 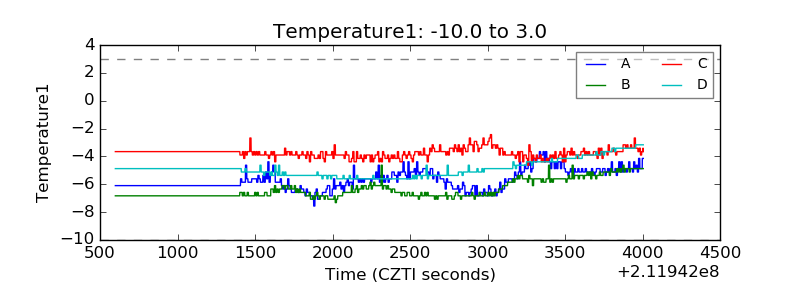 |
| Veto HV Monitor | 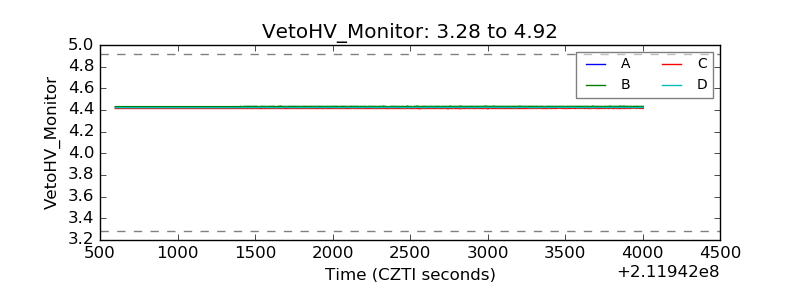 |
| Veto LLD | 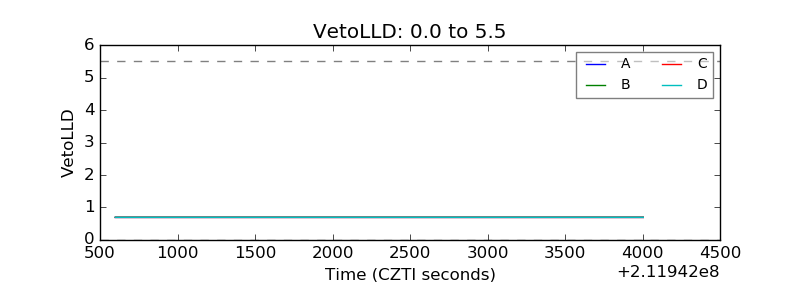 |
| Alpha Counter | 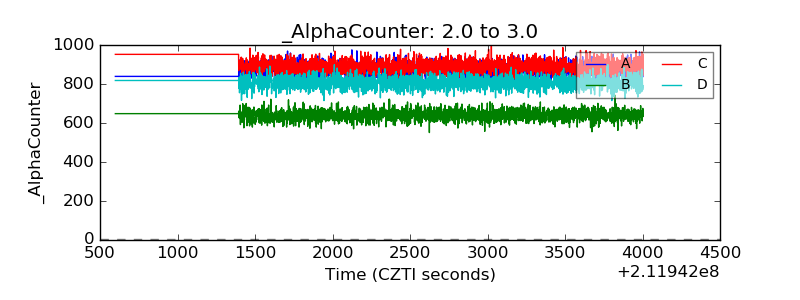 |
| _CPM_Rate | 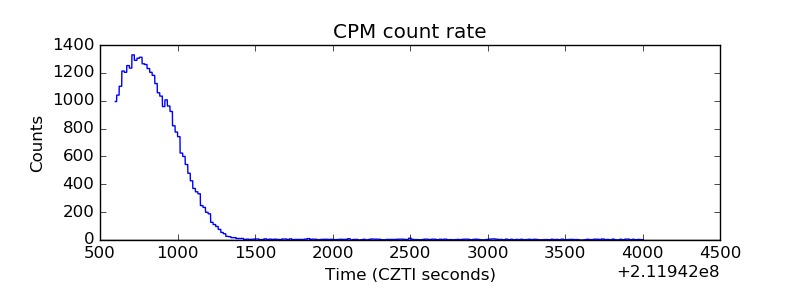 |
| CZT Counter | 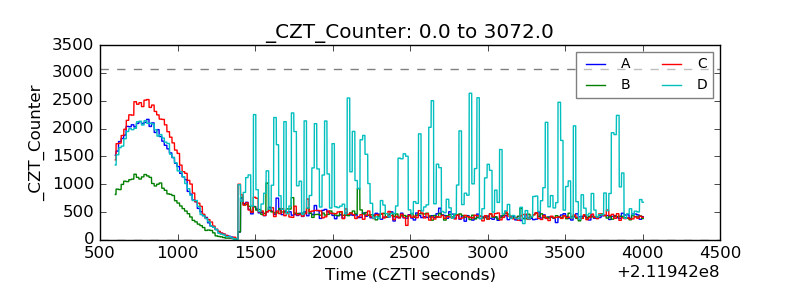 |
| +2.5 Volts monitor |  |
| +5 Volts monitor |  |
| _ROLL_ROT | 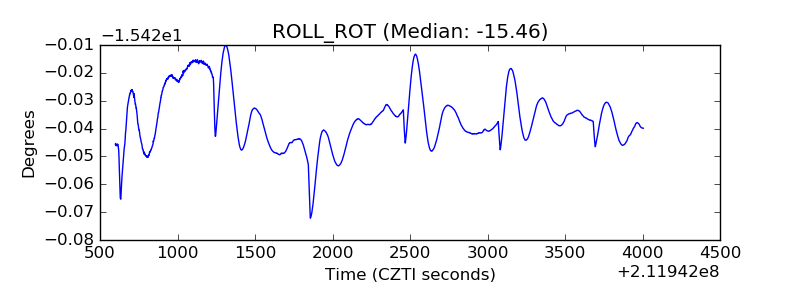 |
| _Roll_DEC | 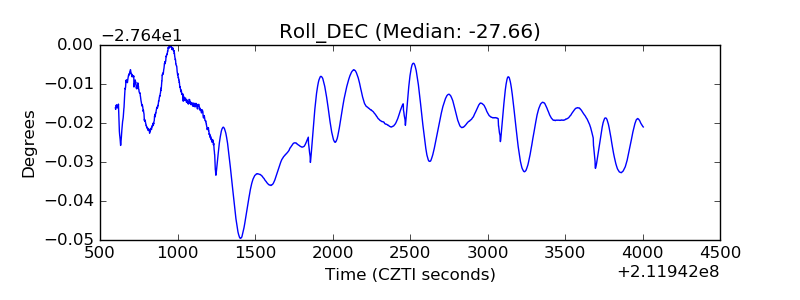 |
| _Roll_RA | 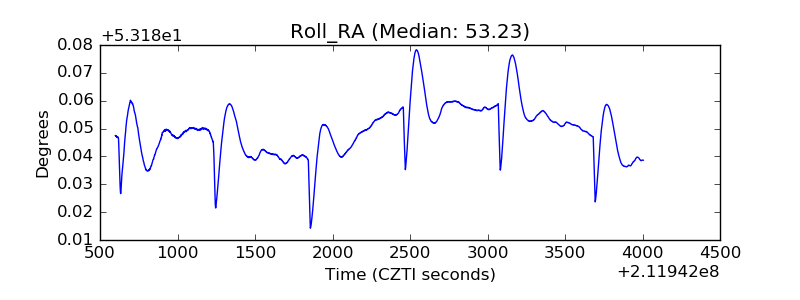 |
| Veto Counter | 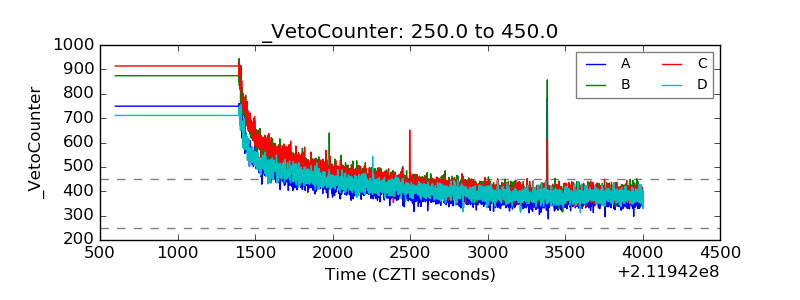 |