| Param | Original file | Final file |
|---|---|---|
| Filename | modeM0/AS1G05_240T02_9000000670_05285cztM0_level2.evt | modeM0/AS1G05_240T02_9000000670_05285cztM0_level2_quad_clean.evt |
| Size (bytes) | 464,921,280 | 55,589,760 |
| Size | 443.4 MB | 53.0 MB |
| Events in quadrant A | 2,976,517 | 328,372 |
| Events in quadrant B | 2,809,049 | 332,360 |
| Events in quadrant C | 2,741,718 | 325,832 |
| Events in quadrant D | 5,150,807 | 283,354 |
| Mode SS | |||
|---|---|---|---|
| Quadrant | BADHDUFLAG | Total packets | Discarded packets |
| A | 0 | 156 | 24 |
| B | 0 | 156 | 36 |
| C | 0 | 155 | 29 |
| D | 0 | 155 | 27 |
| Mode M9 | |||
|---|---|---|---|
| Quadrant | BADHDUFLAG | Total packets | Discarded packets |
| A | 0 | 12 | 2 |
| B | 0 | 12 | 2 |
| C | 0 | 12 | 1 |
| D | 0 | 13 | 2 |
| Mode M0 | |||
|---|---|---|---|
| Quadrant | BADHDUFLAG | Total packets | Discarded packets |
| A | 0 | 16601 | 3684 |
| B | 0 | 16097 | 3783 |
| C | 0 | 15923 | 3686 |
| D | 0 | 29988 | 10843 |
| Quadrant | Total seconds | Saturated seconds | Saturation percentage |
|---|---|---|---|
| A | 6016 | 53 | 0.880984% |
| B | 5988 | 35 | 0.584502% |
| C | 6002 | 11 | 0.183272% |
| D | 5514 | 614 | 11.135292% |
Noise dominated data is calculated using 1-second bins in cleaned event files. If a bin has >2000 counts, and if more than 50% of those come from <1% of pixels, then it is considered to be noise-dominated and hence unusable.
| Quadrant | # 1 sec bins | Bins with >0 counts | Bins with >2000 counts | High rate bins dominated by noise | Noise dominated (total time) | Noise dominated (detector-on time) | Marked lightcurve |
|---|---|---|---|---|---|---|---|
| A | 8923 | 6635 | 20 | 20 | 0.22% | 0.30% |  |
| B | 8923 | 6620 | 0 | 0 | 0.00% | 0.00% | 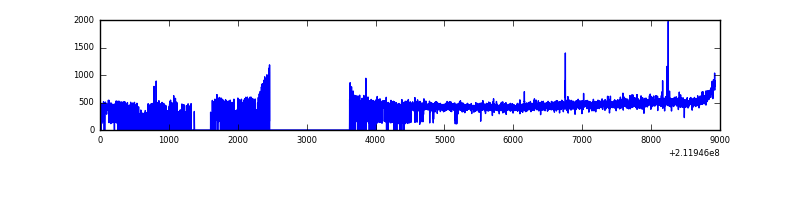 |
| C | 8923 | 6613 | 0 | 0 | 0.00% | 0.00% | 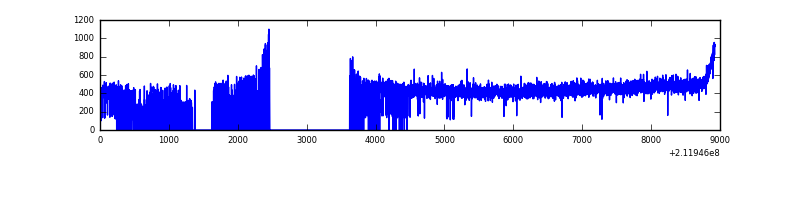 |
| D | 8923 | 5984 | 449 | 449 | 5.03% | 7.50% |  |
Top three noisy pixels from each quadrant. If the there are fewer than three noisy pixels in the level2.evt file, extra rows are filled as -1
| Pixel properties | Quadrant properties | ||||||
|---|---|---|---|---|---|---|---|
| Quadrant | DetID | PixID | Counts | Sigma | Mean | Median | Sigma |
| A | 13 | 251 | 232614 | 1596.41 | 708 | 690 | 145.3 |
| A | 12 | 194 | 7093 | 44.07 | 708 | 690 | 145.3 |
| A | 0 | 226 | 7089 | 44.05 | 708 | 690 | 145.3 |
| B | 15 | 204 | 30068 | 212.57 | 713 | 697 | 138.2 |
| B | 12 | 111 | 12511 | 85.5 | 713 | 697 | 138.2 |
| B | 15 | 54 | 10821 | 73.27 | 713 | 697 | 138.2 |
| C | 8 | 128 | 18515 | 109.65 | 693 | 697 | 162.5 |
| C | 8 | 112 | 7412 | 41.32 | 693 | 697 | 162.5 |
| C | 8 | 144 | 7099 | 39.4 | 693 | 697 | 162.5 |
| D | 11 | 145 | 2261334 | 15159.36 | 604 | 585 | 149.1 |
| D | 1 | 239 | 255965 | 1712.44 | 604 | 585 | 149.1 |
| D | 2 | 136 | 132985 | 887.8 | 604 | 585 | 149.1 |
Histogram calculated using DETX and DETY for each event in the final _common_clean file
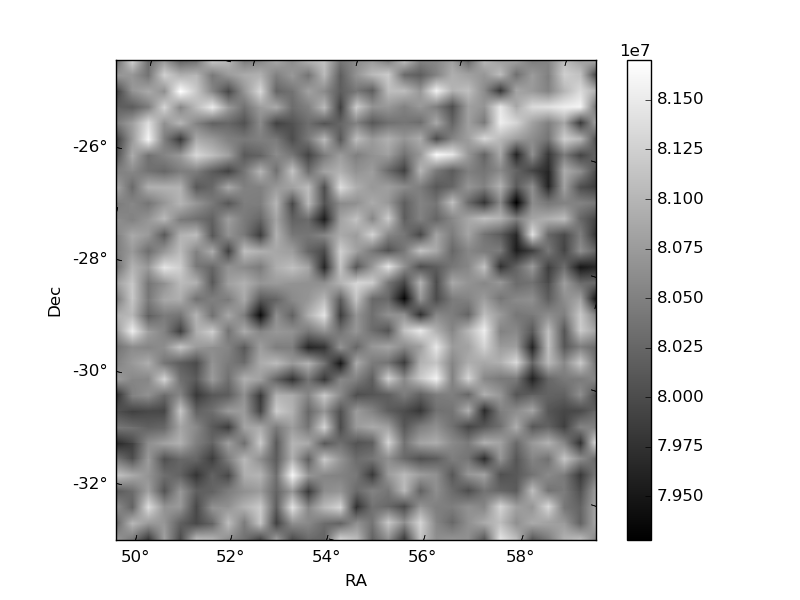
| Quadrant A | 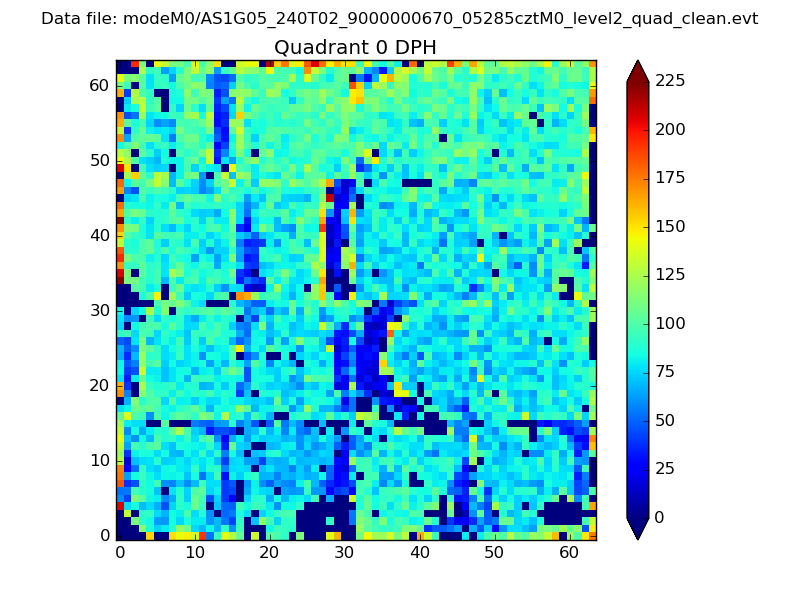 |
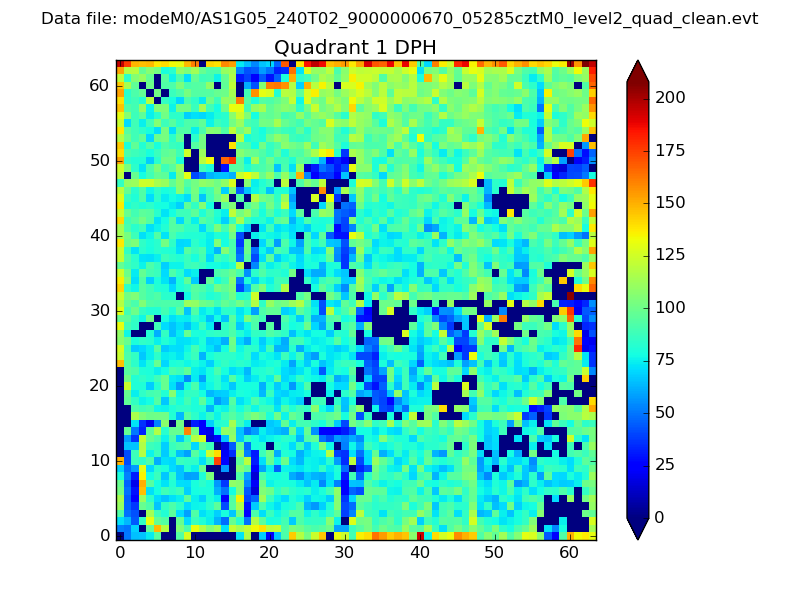 |
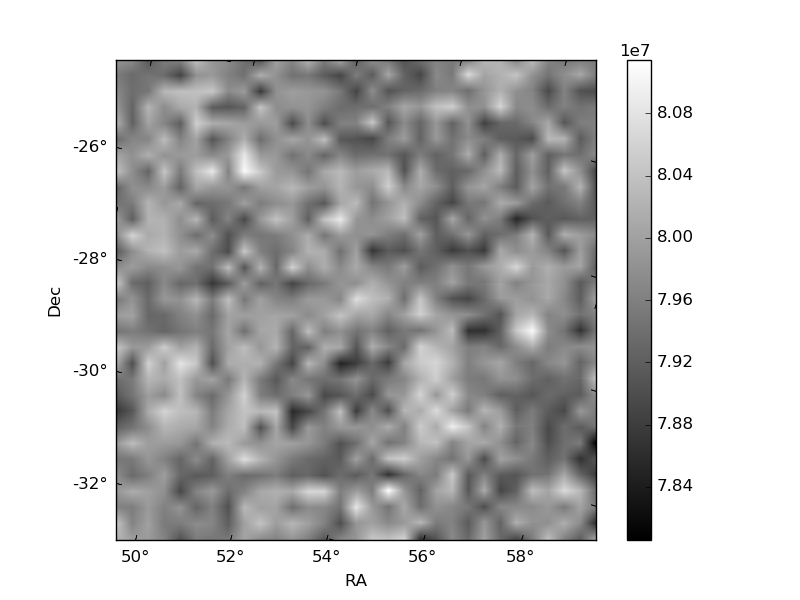
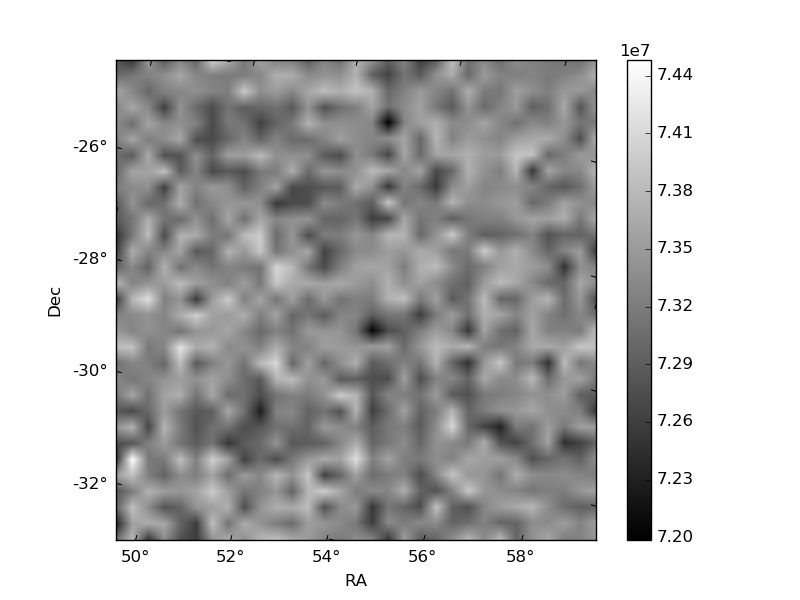
Quadrant B |
|---|---|---|---|
| Quadrant D |  |
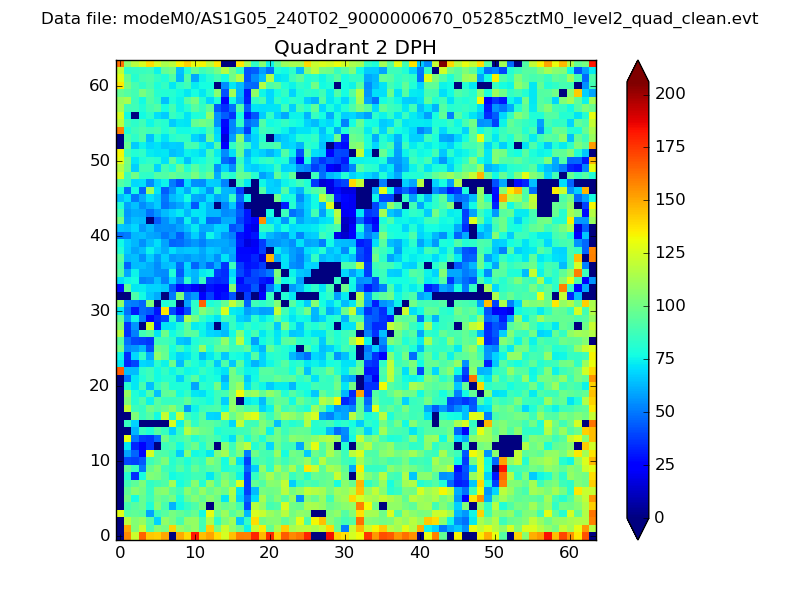 |
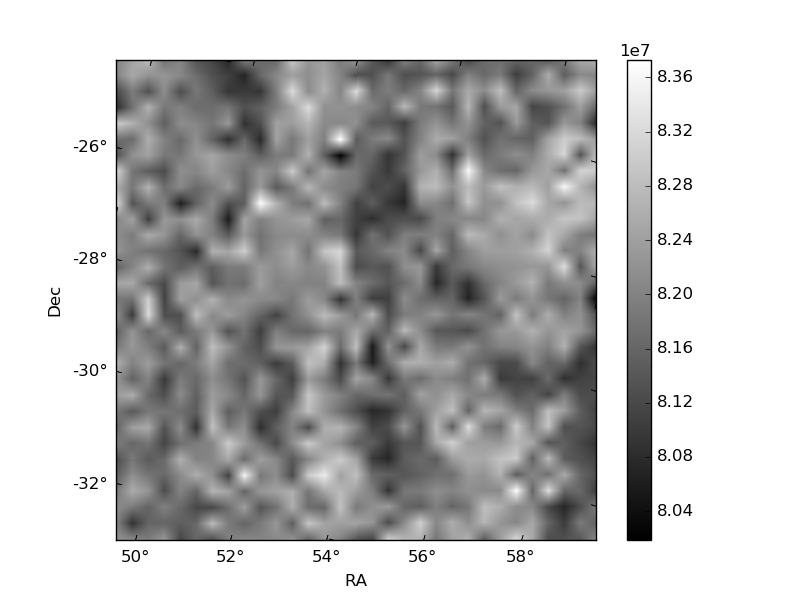
Quadrant C |
| Plot type | Count rate plots | Images |
|---|---|---|
| Comparison with Poisson distribution Blue bars denote a histogram of data divided into 1 sec bins. Red curve is a Poisson curve with rate = median count rate of data. |
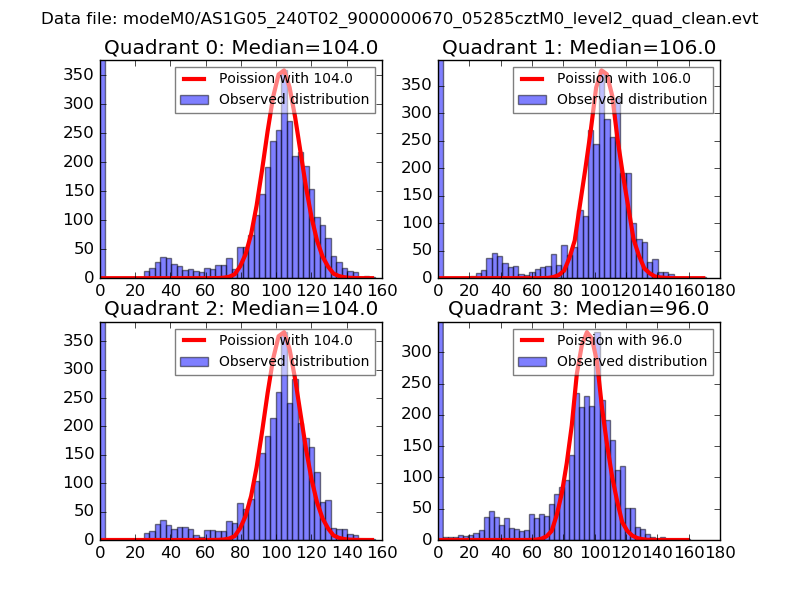 |
 |
| Quadrant-wise count rates Data is divided into 100 sec bins |
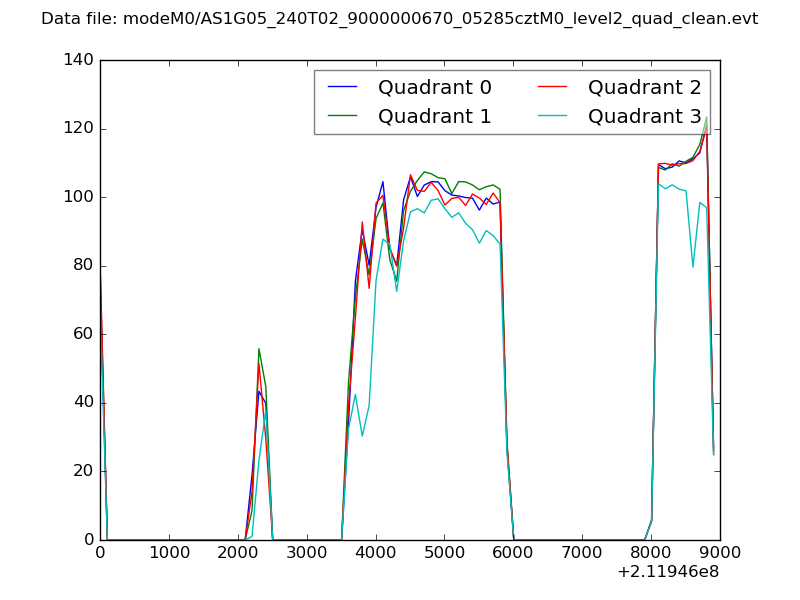 |
|
| Module-wise count rates for Quadrant A Data is divided into 100 sec bins |
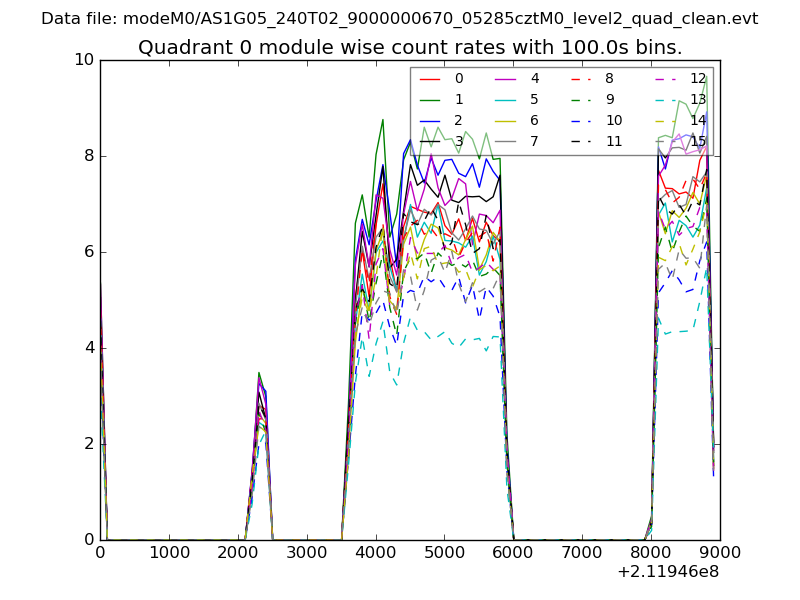 |
 |
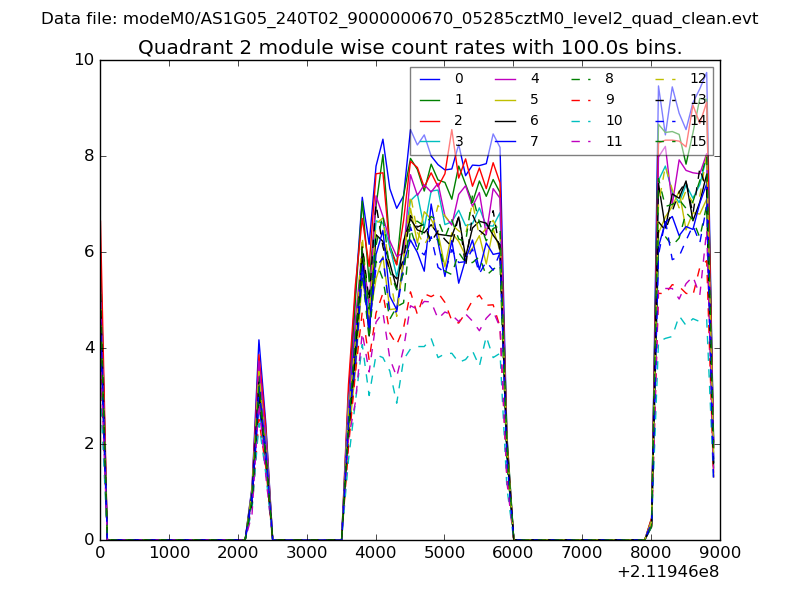
| Module-wise count rates for Quadrant B Data is divided into 100 sec bins |
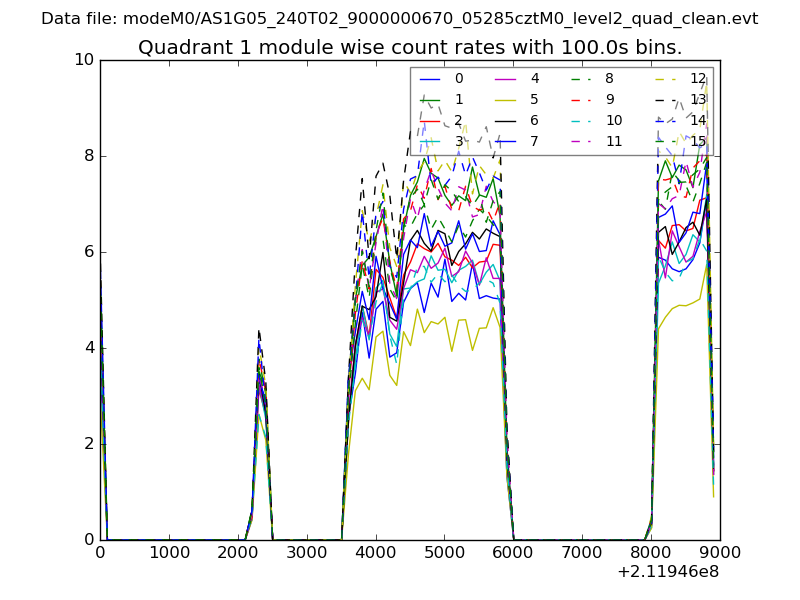 |
 |
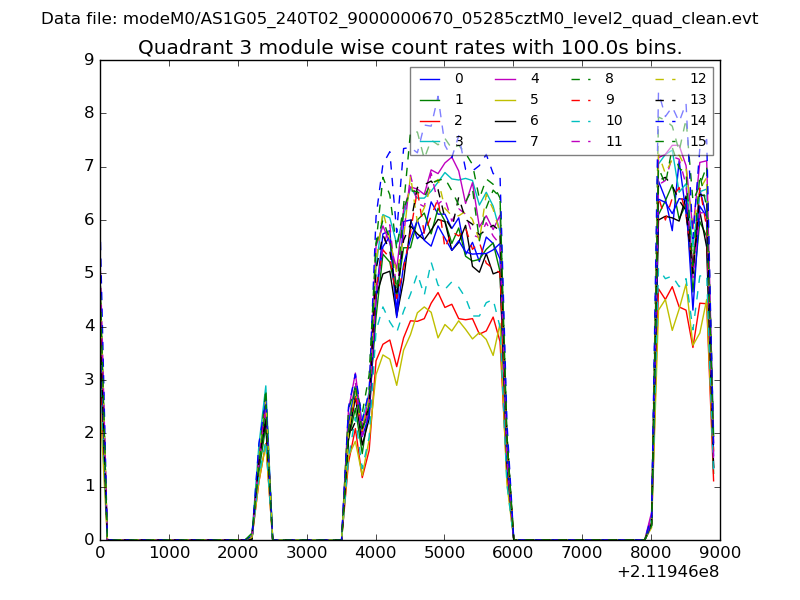
| Module-wise count rates for Quadrant C Data is divided into 100 sec bins |
 |
 |
| Module-wise count rates for Quadrant D Data is divided into 100 sec bins |
 |
 |
| Parameter | Plot |
|---|---|
| CZT HV Monitor | 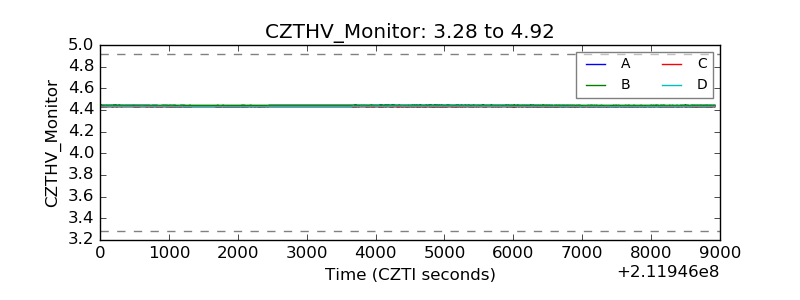 |
| D_VDD | 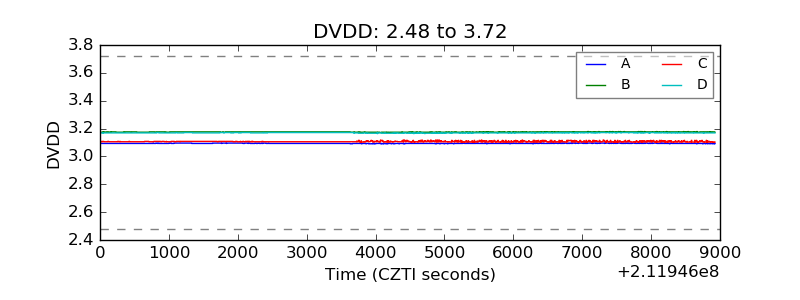 |
| Temperature 1 | 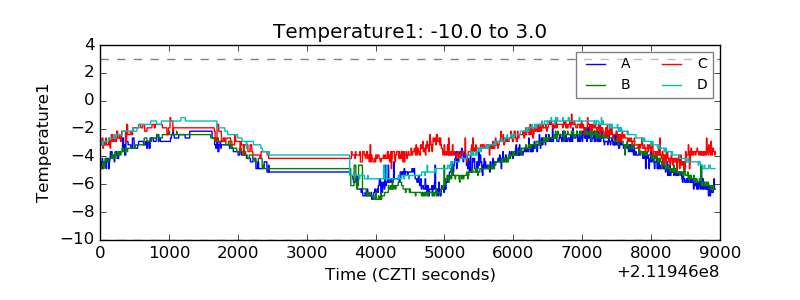 |
| Veto HV Monitor | 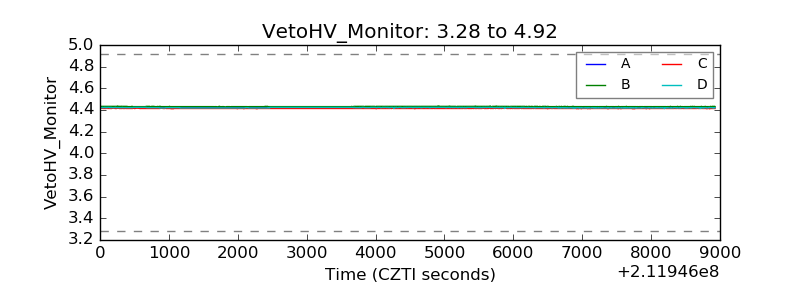 |
| Veto LLD | 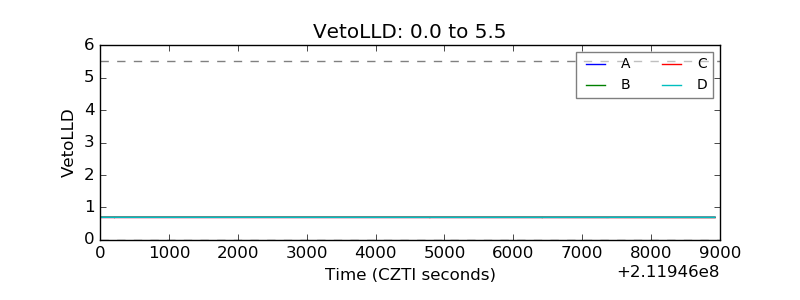 |
| Alpha Counter | 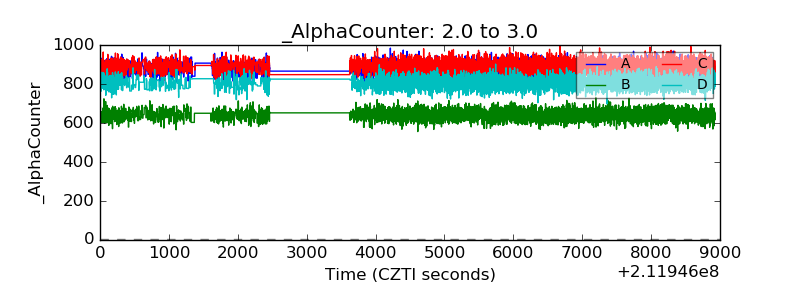 |
| _CPM_Rate | 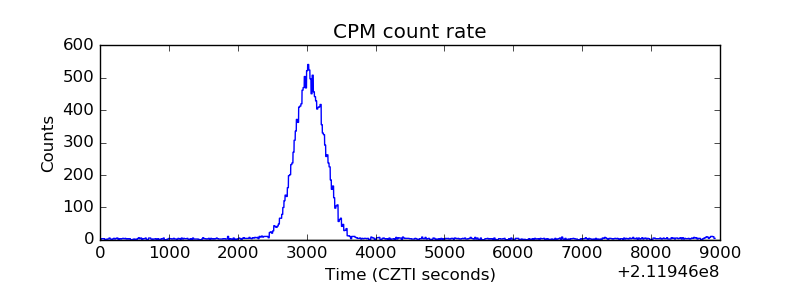 |
| CZT Counter | 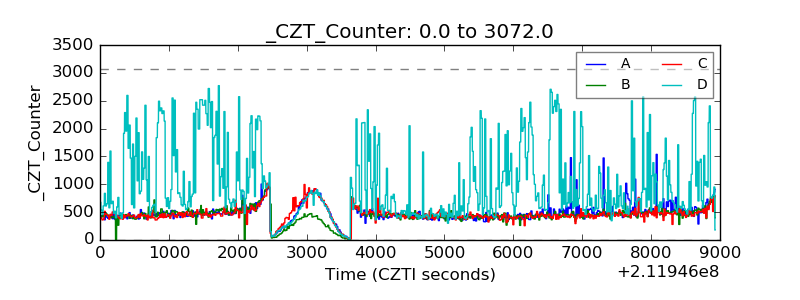 |
| +2.5 Volts monitor | 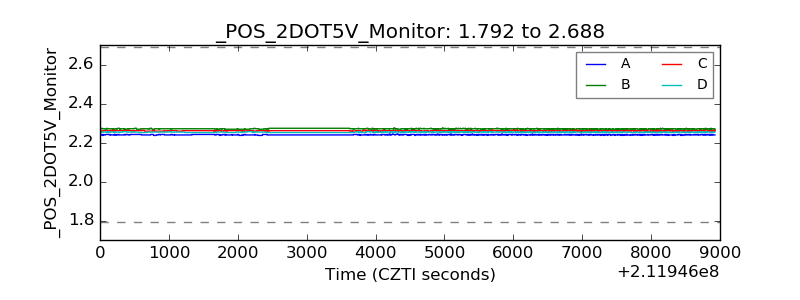 |
| +5 Volts monitor |  |
| _ROLL_ROT | 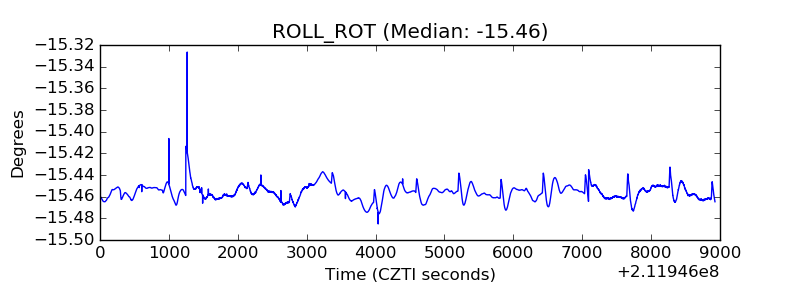 |
| _Roll_DEC | 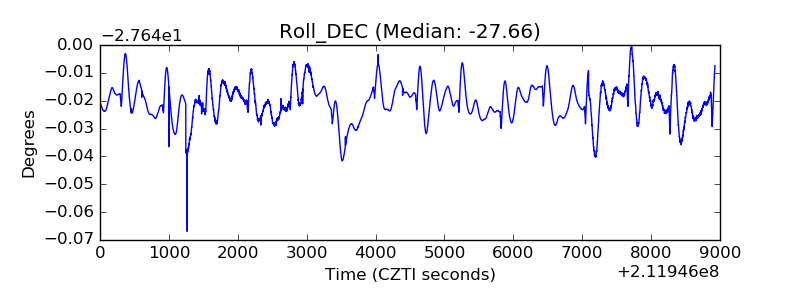 |
| _Roll_RA | 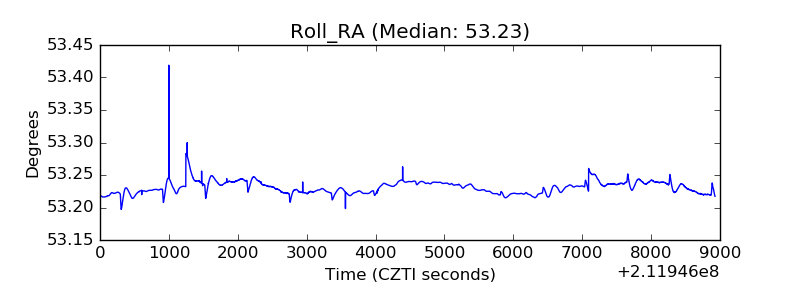 |
| Veto Counter | 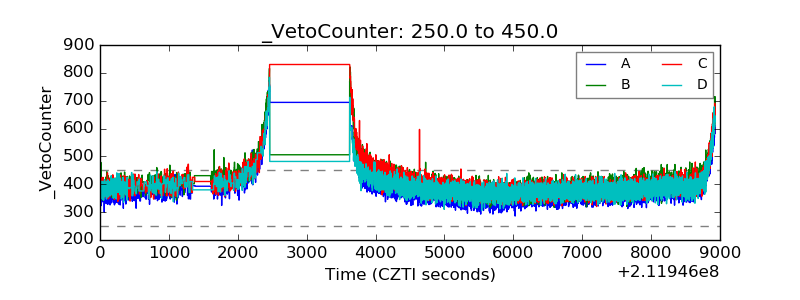 |