| Param | Original file | Final file |
|---|---|---|
| Filename | modeM0/AS1G05_240T02_9000000670_05286cztM0_level2.evt | modeM0/AS1G05_240T02_9000000670_05286cztM0_level2_quad_clean.evt |
| Size (bytes) | 699,482,880 | 100,344,960 |
| Size | 667.1 MB | 95.7 MB |
| Events in quadrant A | 5,132,501 | 624,250 |
| Events in quadrant B | 4,035,141 | 636,155 |
| Events in quadrant C | 3,881,712 | 620,929 |
| Events in quadrant D | 7,554,379 | 562,149 |
| Mode SS | |||
|---|---|---|---|
| Quadrant | BADHDUFLAG | Total packets | Discarded packets |
| A | 0 | 176 | 0 |
| B | 0 | 176 | 0 |
| C | 0 | 176 | 0 |
| D | 0 | 176 | 0 |
| Mode M9 | |||
|---|---|---|---|
| Quadrant | BADHDUFLAG | Total packets | Discarded packets |
| A | 0 | 14 | 0 |
| B | 0 | 14 | 0 |
| C | 0 | 14 | 0 |
| D | 0 | 14 | 0 |
| Mode M0 | |||
|---|---|---|---|
| Quadrant | BADHDUFLAG | Total packets | Discarded packets |
| A | 0 | 20985 | 3 |
| B | 0 | 17717 | 2 |
| C | 0 | 17542 | 2 |
| D | 0 | 28401 | 2 |
| Quadrant | Total seconds | Saturated seconds | Saturation percentage |
|---|---|---|---|
| A | 8566 | 304 | 3.548914% |
| B | 8566 | 87 | 1.015643% |
| C | 8566 | 74 | 0.863880% |
| D | 8566 | 1144 | 13.355125% |
Noise dominated data is calculated using 1-second bins in cleaned event files. If a bin has >2000 counts, and if more than 50% of those come from <1% of pixels, then it is considered to be noise-dominated and hence unusable.
| Quadrant | # 1 sec bins | Bins with >0 counts | Bins with >2000 counts | High rate bins dominated by noise | Noise dominated (total time) | Noise dominated (detector-on time) | Marked lightcurve |
|---|---|---|---|---|---|---|---|
| A | 9976 | 8568 | 125 | 125 | 1.25% | 1.46% | 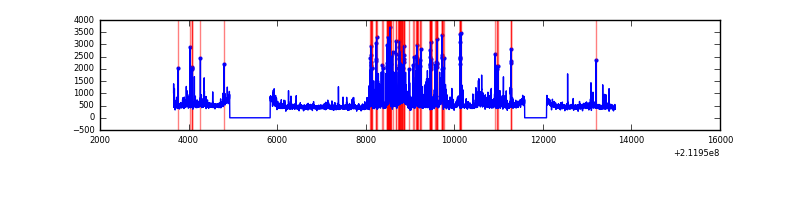 |
| B | 9976 | 8568 | 1 | 1 | 0.01% | 0.01% | 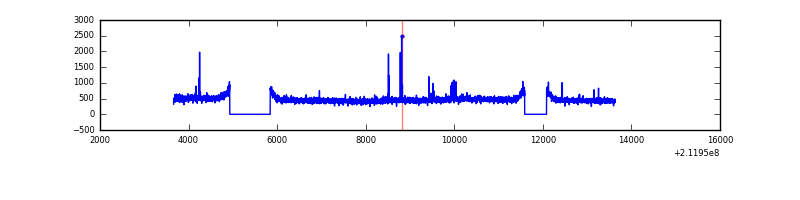 |
| C | 9976 | 8568 | 0 | 0 | 0.00% | 0.00% | 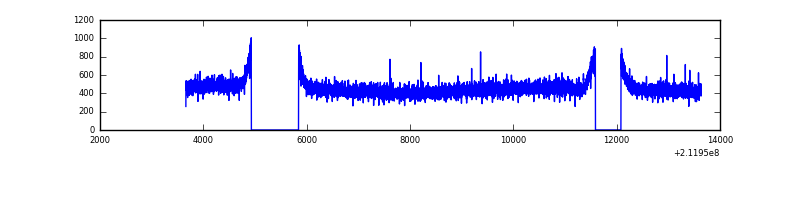 |
| D | 9976 | 8568 | 842 | 842 | 8.44% | 9.83% | 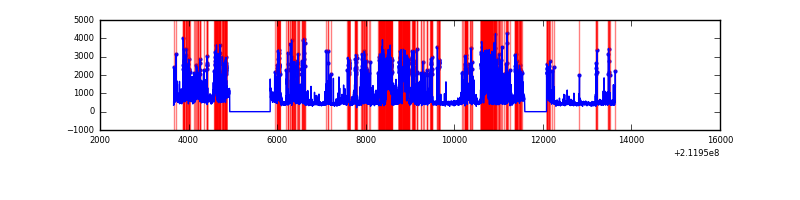 |
Top three noisy pixels from each quadrant. If the there are fewer than three noisy pixels in the level2.evt file, extra rows are filled as -1
| Pixel properties | Quadrant properties | ||||||
|---|---|---|---|---|---|---|---|
| Quadrant | DetID | PixID | Counts | Sigma | Mean | Median | Sigma |
| A | 13 | 251 | 1169108 | 5678.43 | 998 | 973 | 205.7 |
| A | 14 | 111 | 48813 | 232.56 | 998 | 973 | 205.7 |
| A | 11 | 116 | 36341 | 171.93 | 998 | 973 | 205.7 |
| B | 15 | 204 | 38633 | 190.17 | 1018 | 992 | 197.9 |
| B | 4 | 80 | 19338 | 92.69 | 1018 | 992 | 197.9 |
| B | 12 | 111 | 18359 | 87.74 | 1018 | 992 | 197.9 |
| C | 8 | 128 | 11814 | 46.85 | 988 | 992 | 231.0 |
| C | 13 | 61 | 8037 | 30.5 | 988 | 992 | 231.0 |
| C | 8 | 112 | 5463 | 19.36 | 988 | 992 | 231.0 |
| D | 11 | 145 | 3453730 | 15059.06 | 932 | 900 | 229.3 |
| D | 1 | 239 | 147794 | 640.66 | 932 | 900 | 229.3 |
| D | 2 | 136 | 127033 | 550.11 | 932 | 900 | 229.3 |
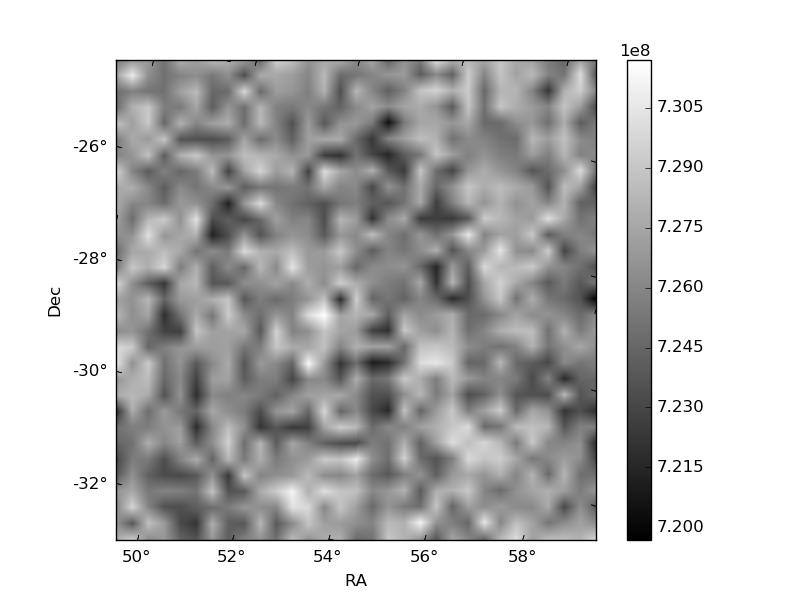
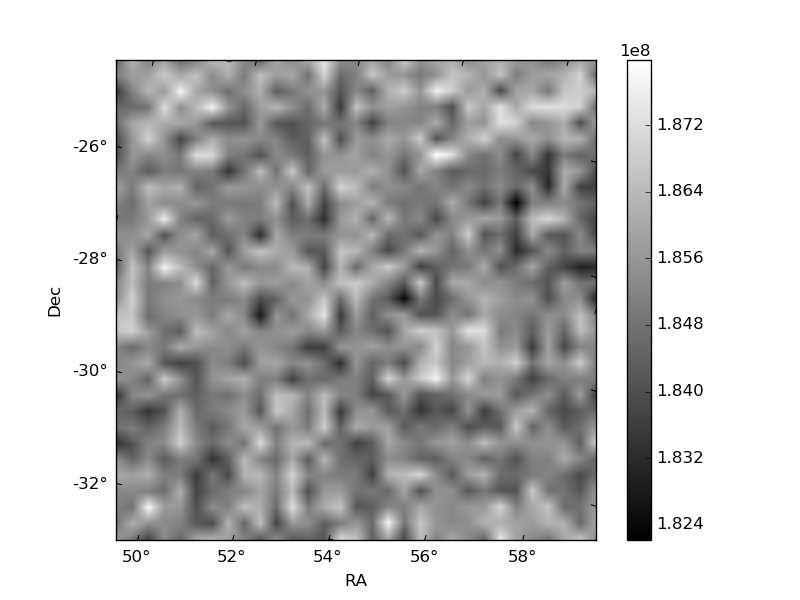
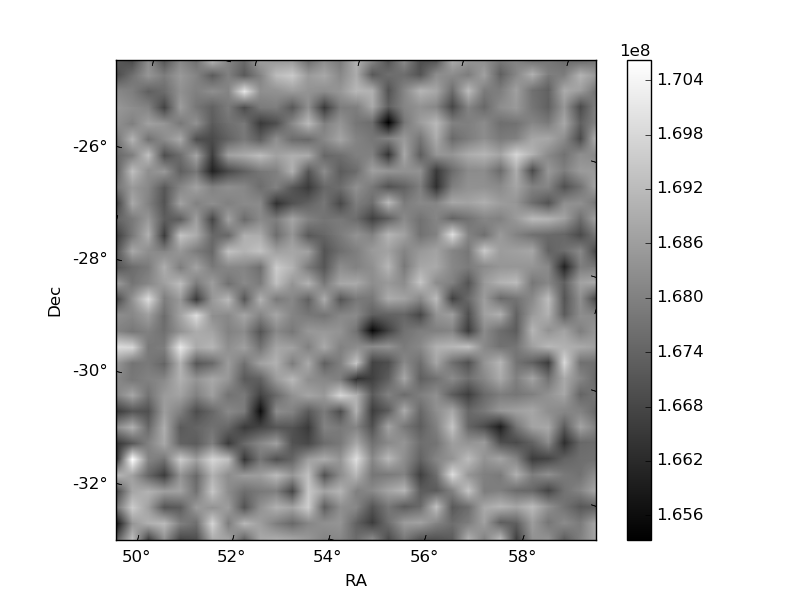
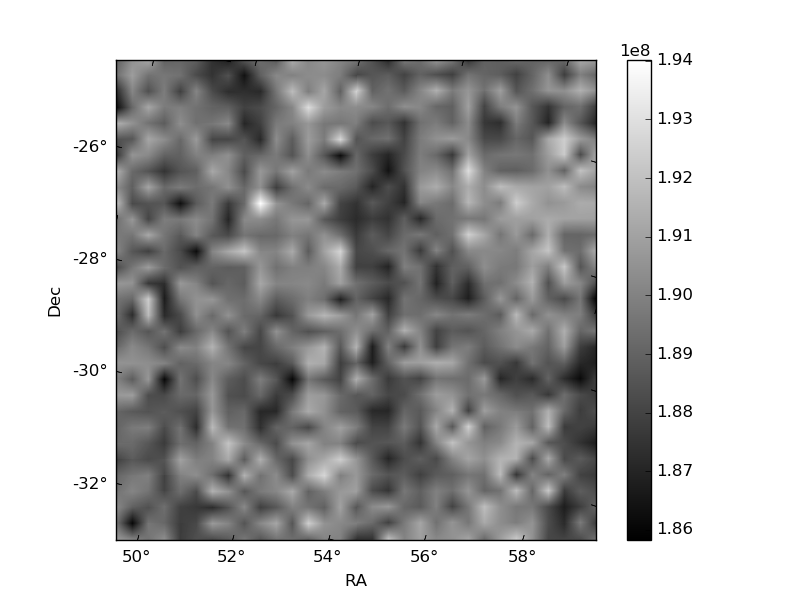
Histogram calculated using DETX and DETY for each event in the final _common_clean file
| Quadrant A | 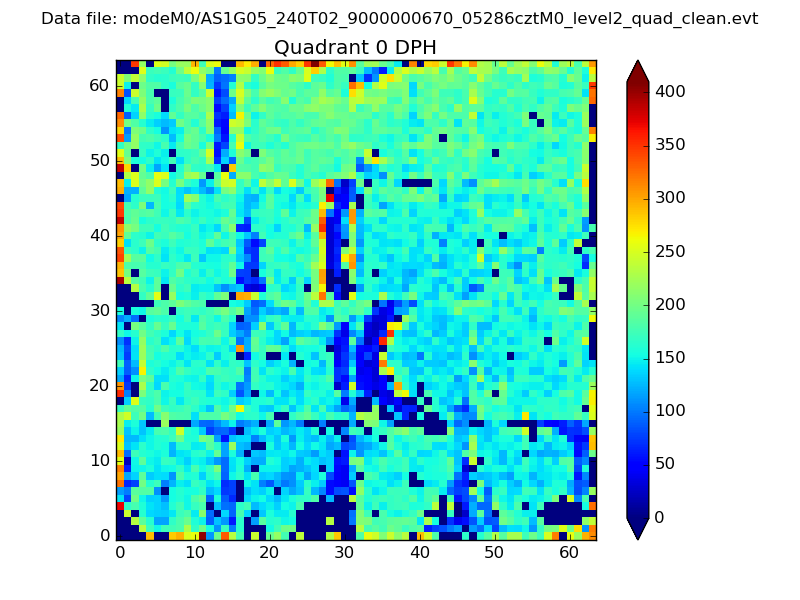 |
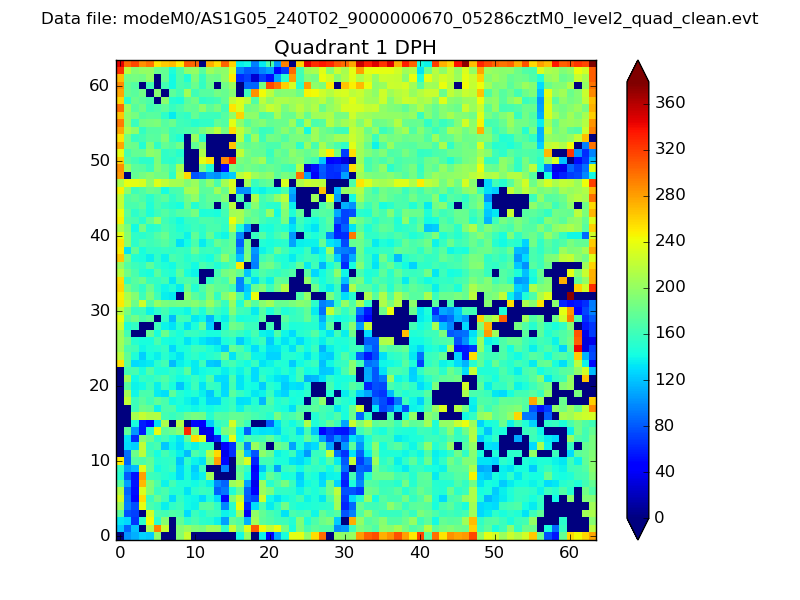 |
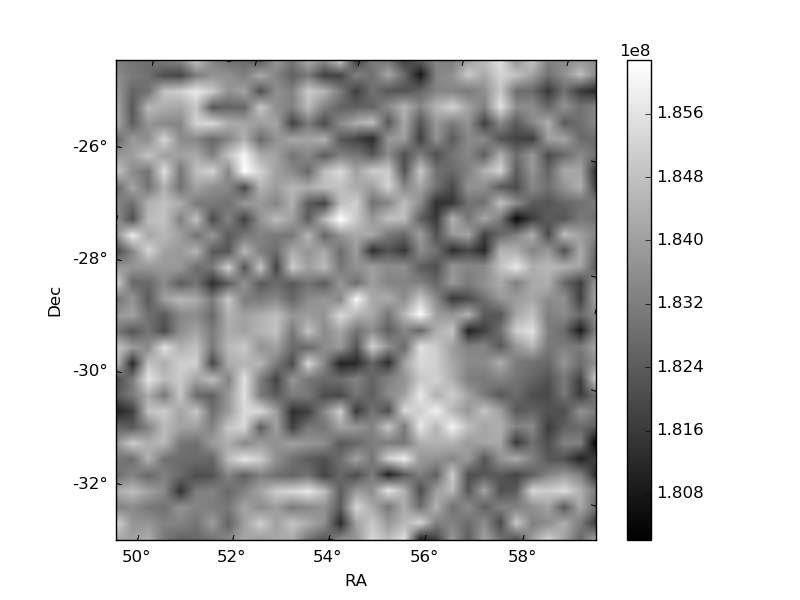
Quadrant B |
|---|---|---|---|
| Quadrant D | 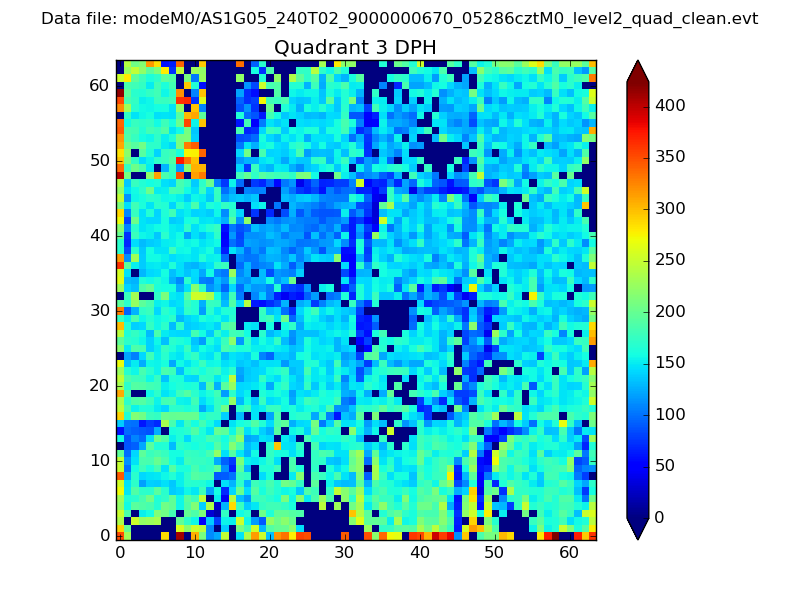 |
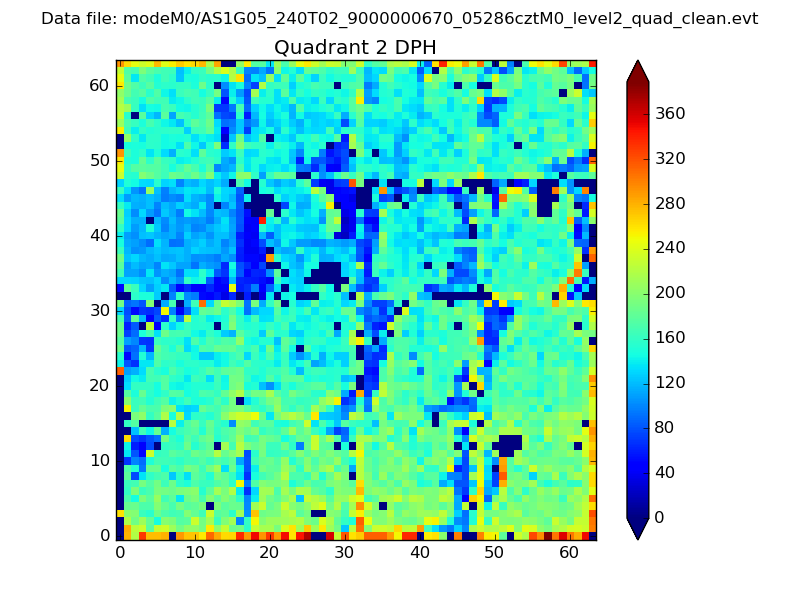 |
Quadrant C |
| Plot type | Count rate plots | Images |
|---|---|---|
| Comparison with Poisson distribution Blue bars denote a histogram of data divided into 1 sec bins. Red curve is a Poisson curve with rate = median count rate of data. |
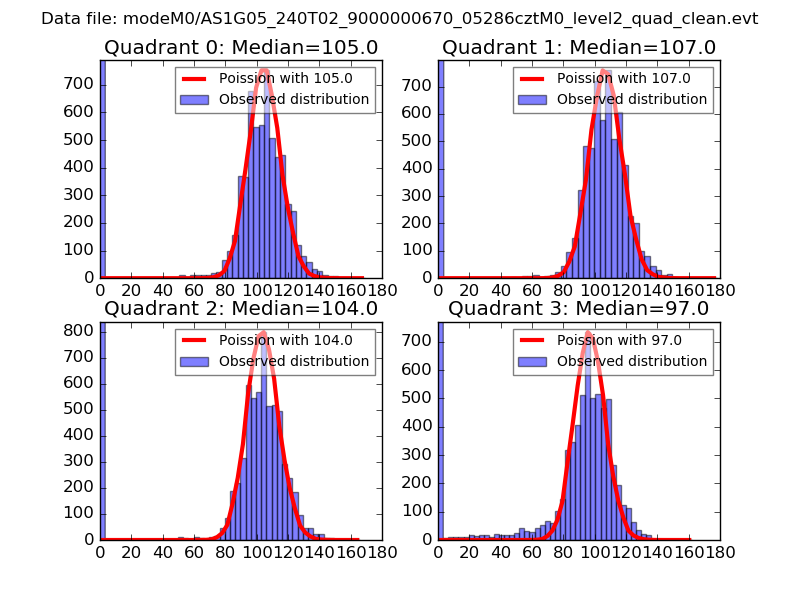 |
 |
| Quadrant-wise count rates Data is divided into 100 sec bins |
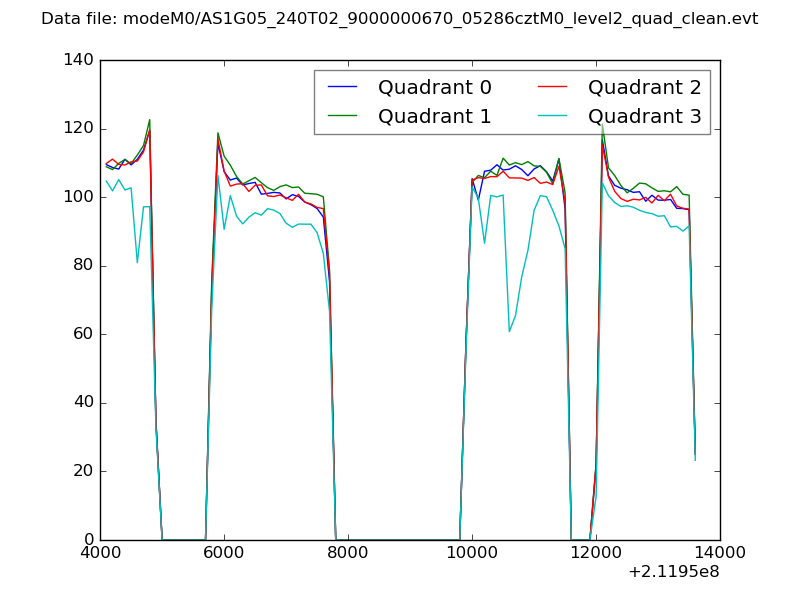 |
|
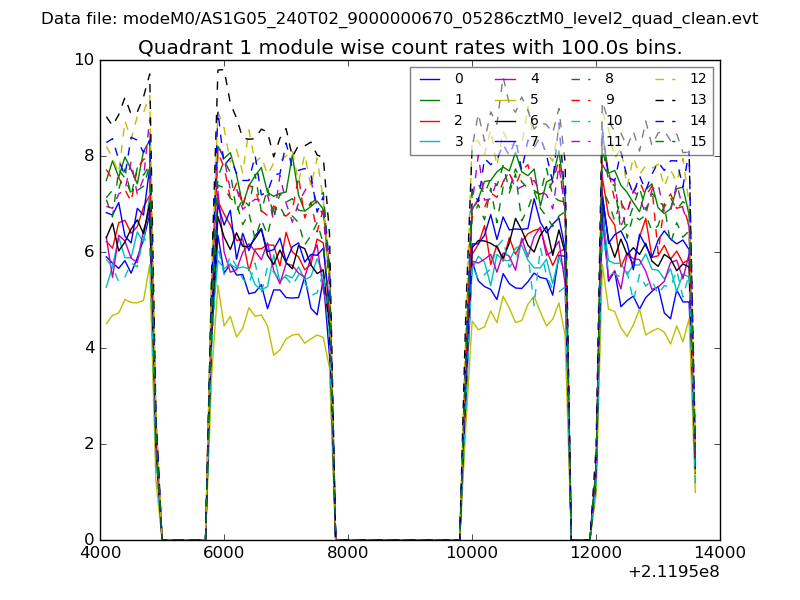
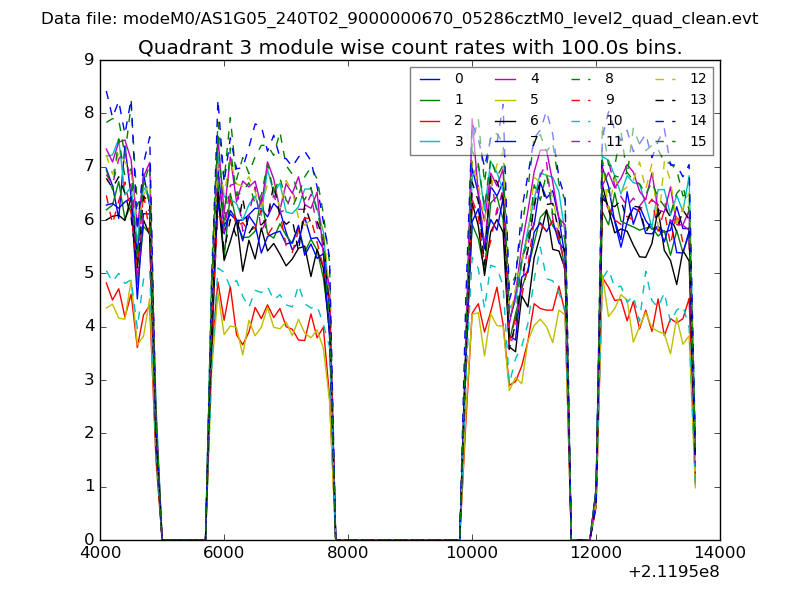
| Module-wise count rates for Quadrant A Data is divided into 100 sec bins |
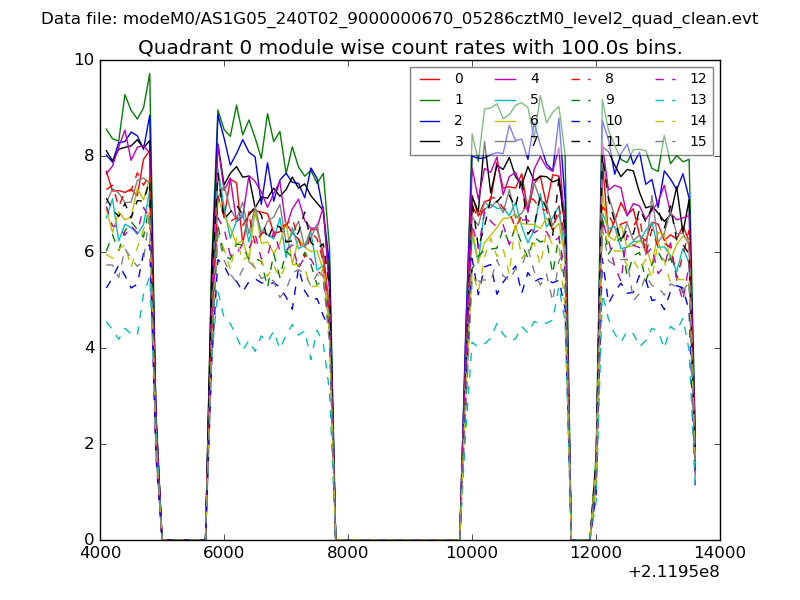 |
 |
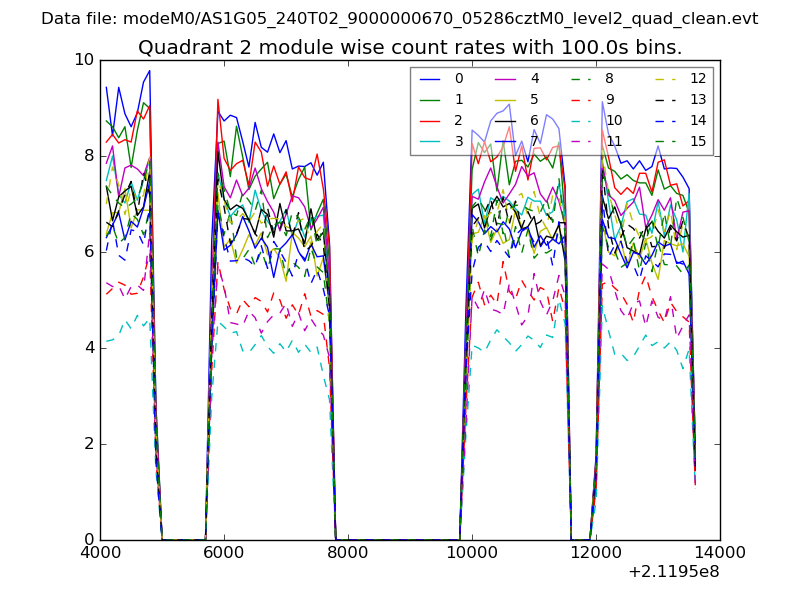
| Module-wise count rates for Quadrant B Data is divided into 100 sec bins |
 |
 |
| Module-wise count rates for Quadrant C Data is divided into 100 sec bins |
 |
 |
| Module-wise count rates for Quadrant D Data is divided into 100 sec bins |
 |
 |
| Parameter | Plot |
|---|---|
| CZT HV Monitor | 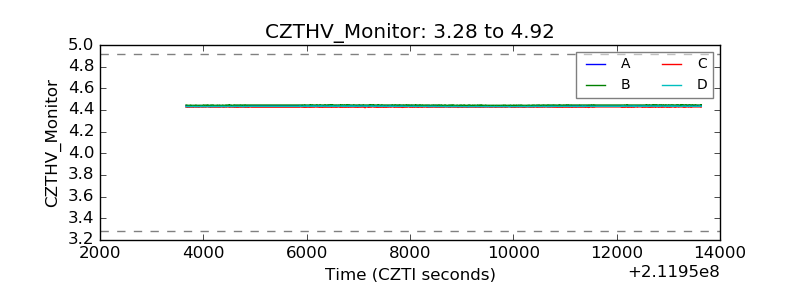 |
| D_VDD | 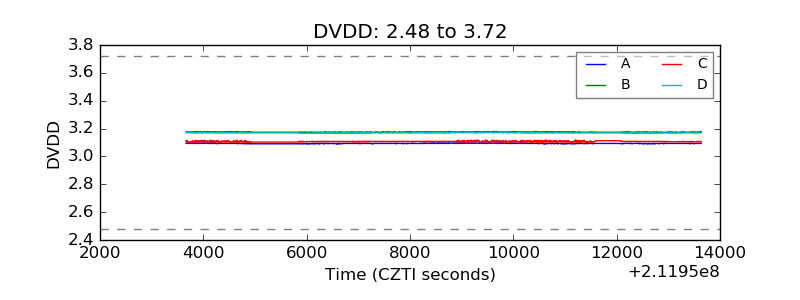 |
| Temperature 1 | 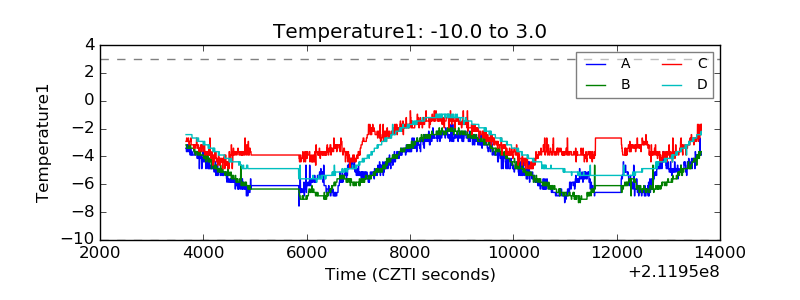 |
| Veto HV Monitor | 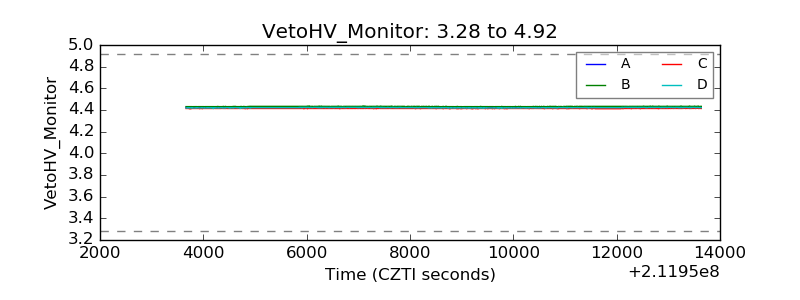 |
| Veto LLD | 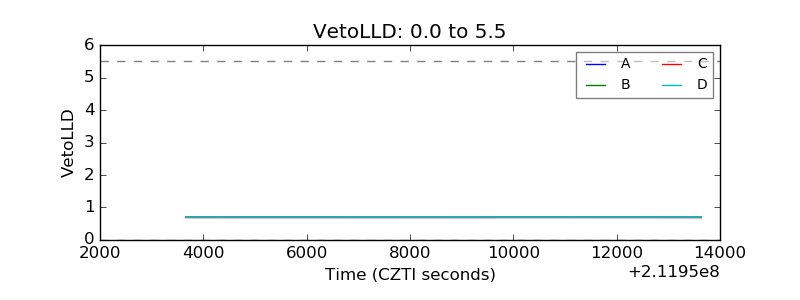 |
| Alpha Counter | 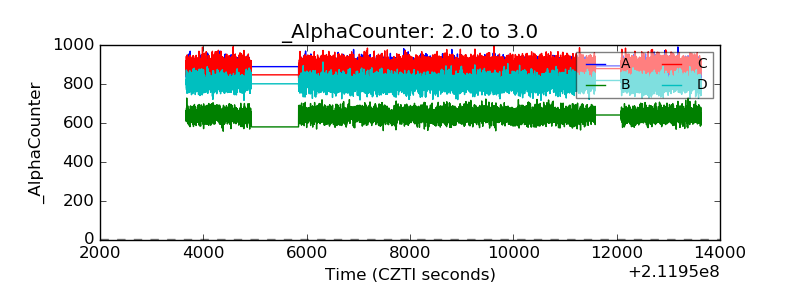 |
| _CPM_Rate | 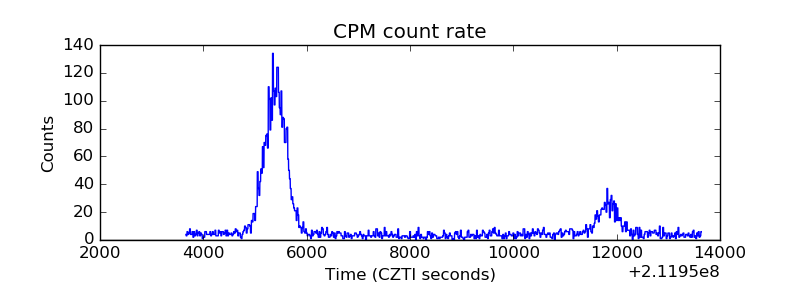 |
| CZT Counter | 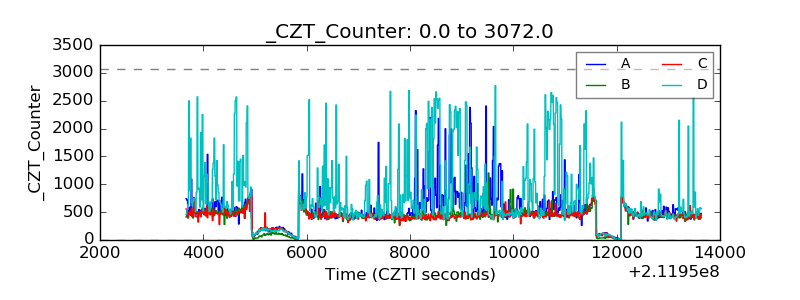 |
| +2.5 Volts monitor | 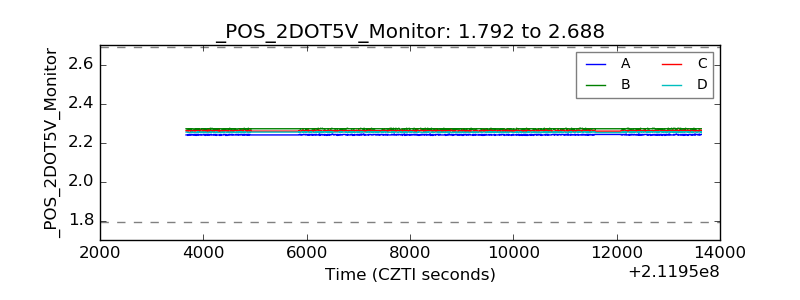 |
| +5 Volts monitor | 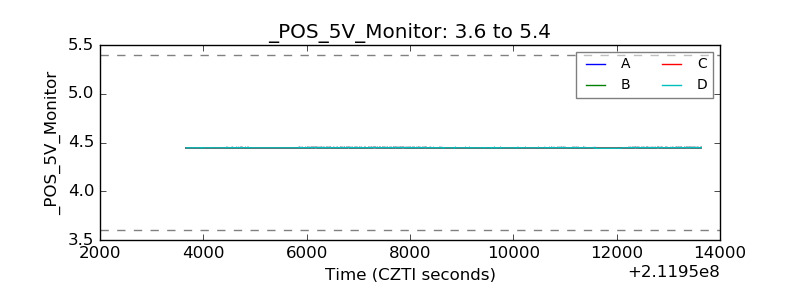 |
| _ROLL_ROT | 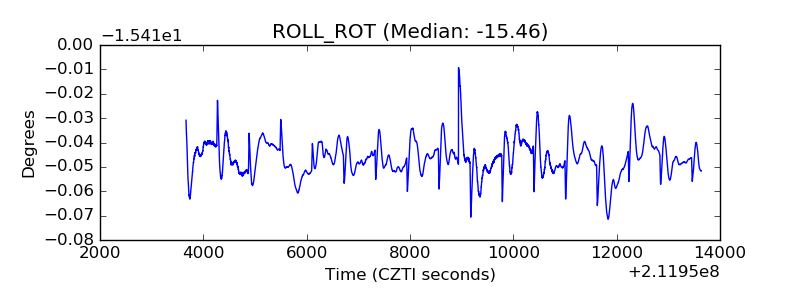 |
| _Roll_DEC | 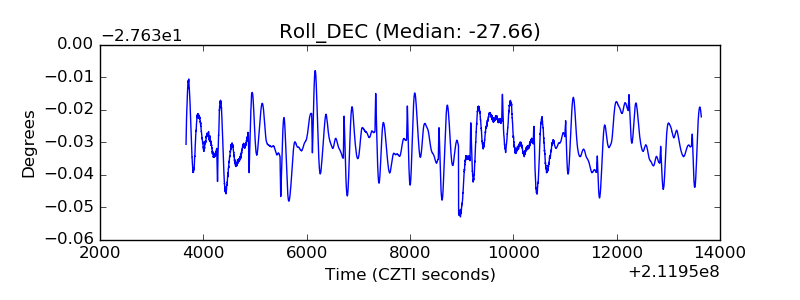 |
| _Roll_RA | 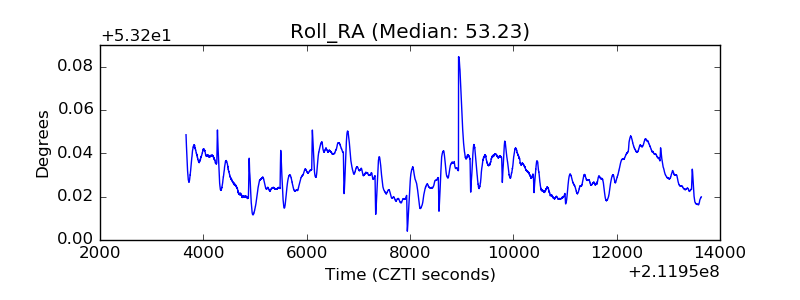 |
| Veto Counter | 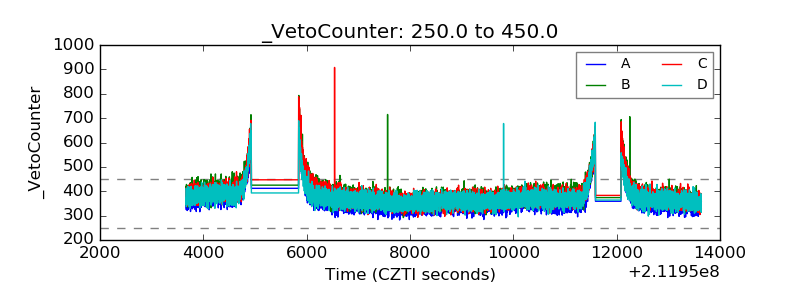 |