| Param | Original file | Final file |
|---|---|---|
| Filename | modeM0/AS1G05_240T02_9000000670_05287cztM0_level2.evt | modeM0/AS1G05_240T02_9000000670_05287cztM0_level2_quad_clean.evt |
| Size (bytes) | 627,099,840 | 87,958,080 |
| Size | 598.0 MB | 83.9 MB |
| Events in quadrant A | 4,811,830 | 534,785 |
| Events in quadrant B | 3,650,432 | 554,551 |
| Events in quadrant C | 3,508,377 | 541,181 |
| Events in quadrant D | 6,498,672 | 496,456 |
| Mode SS | |||
|---|---|---|---|
| Quadrant | BADHDUFLAG | Total packets | Discarded packets |
| A | 0 | 154 | 0 |
| B | 0 | 154 | 0 |
| C | 0 | 154 | 0 |
| D | 0 | 154 | 0 |
| Mode M0 | |||
|---|---|---|---|
| Quadrant | BADHDUFLAG | Total packets | Discarded packets |
| A | 0 | 19453 | 2 |
| B | 0 | 16132 | 1 |
| C | 0 | 15999 | 3 |
| D | 0 | 24644 | 1 |
| Quadrant | Total seconds | Saturated seconds | Saturation percentage |
|---|---|---|---|
| A | 7705 | 420 | 5.451006% |
| B | 7705 | 235 | 3.049968% |
| C | 7704 | 145 | 1.882139% |
| D | 7706 | 992 | 12.873086% |
Noise dominated data is calculated using 1-second bins in cleaned event files. If a bin has >2000 counts, and if more than 50% of those come from <1% of pixels, then it is considered to be noise-dominated and hence unusable.
| Quadrant | # 1 sec bins | Bins with >0 counts | Bins with >2000 counts | High rate bins dominated by noise | Noise dominated (total time) | Noise dominated (detector-on time) | Marked lightcurve |
|---|---|---|---|---|---|---|---|
| A | 7705 | 7705 | 122 | 122 | 1.58% | 1.58% | 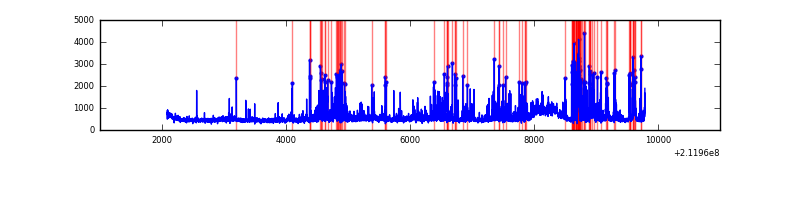 |
| B | 7705 | 7705 | 1 | 1 | 0.01% | 0.01% | 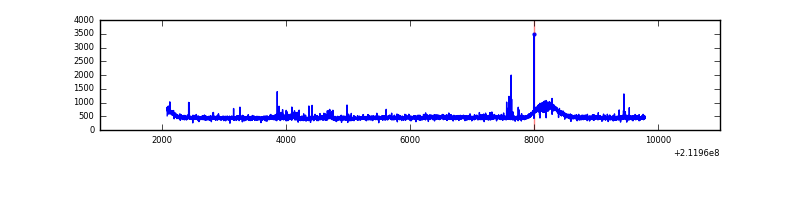 |
| C | 7705 | 7705 | 0 | 0 | 0.00% | 0.00% | 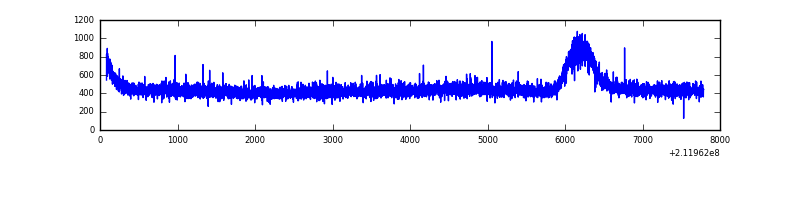 |
| D | 7706 | 7706 | 596 | 596 | 7.73% | 7.73% | 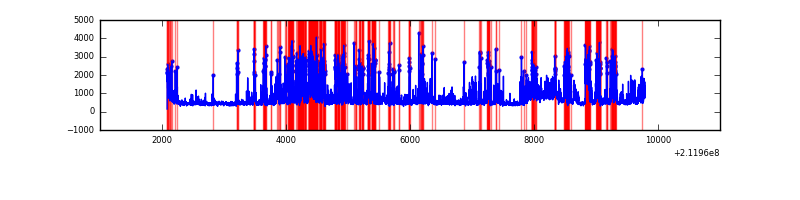 |
Top three noisy pixels from each quadrant. If the there are fewer than three noisy pixels in the level2.evt file, extra rows are filled as -1
| Pixel properties | Quadrant properties | ||||||
|---|---|---|---|---|---|---|---|
| Quadrant | DetID | PixID | Counts | Sigma | Mean | Median | Sigma |
| A | 13 | 251 | 1288806 | 6837.22 | 905 | 880 | 188.4 |
| A | 0 | 50 | 20330 | 103.25 | 905 | 880 | 188.4 |
| A | 14 | 111 | 9994 | 48.38 | 905 | 880 | 188.4 |
| B | 15 | 204 | 32075 | 173.08 | 923 | 900 | 180.1 |
| B | 4 | 239 | 17270 | 90.88 | 923 | 900 | 180.1 |
| B | 12 | 111 | 17086 | 89.86 | 923 | 900 | 180.1 |
| C | 13 | 61 | 7306 | 30.46 | 897 | 901 | 210.3 |
| C | 10 | 34 | 6729 | 27.72 | 897 | 901 | 210.3 |
| C | 12 | 4 | 2708 | 8.59 | 897 | 901 | 210.3 |
| D | 11 | 145 | 2947048 | 13983.68 | 856 | 826 | 210.7 |
| D | 2 | 136 | 179840 | 849.66 | 856 | 826 | 210.7 |
| D | 8 | 195 | 73841 | 346.55 | 856 | 826 | 210.7 |
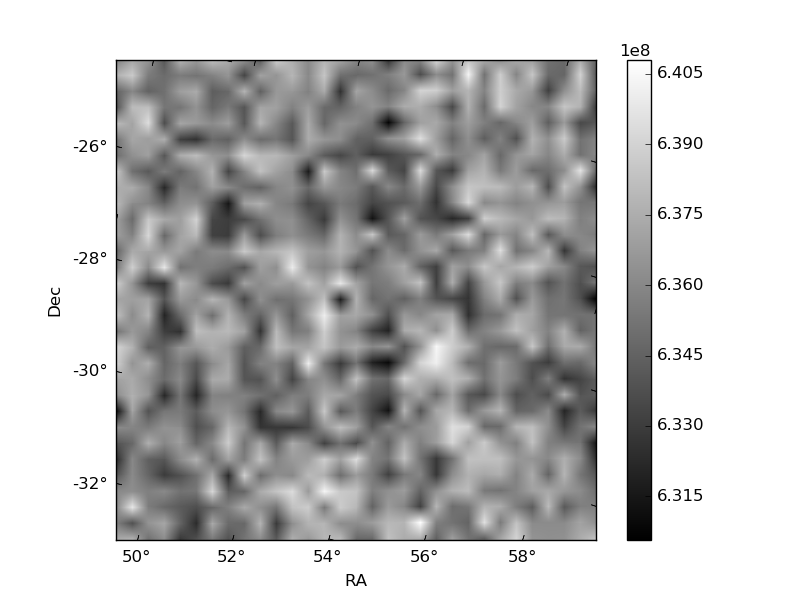
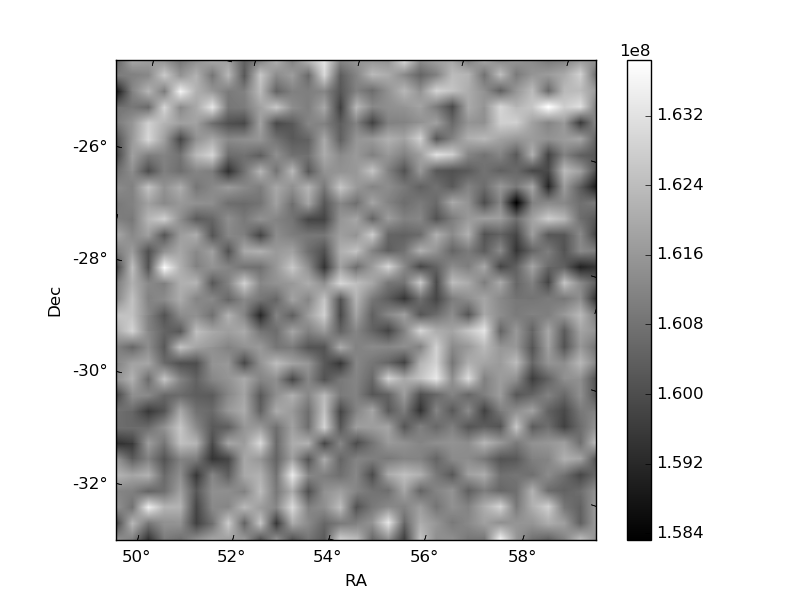
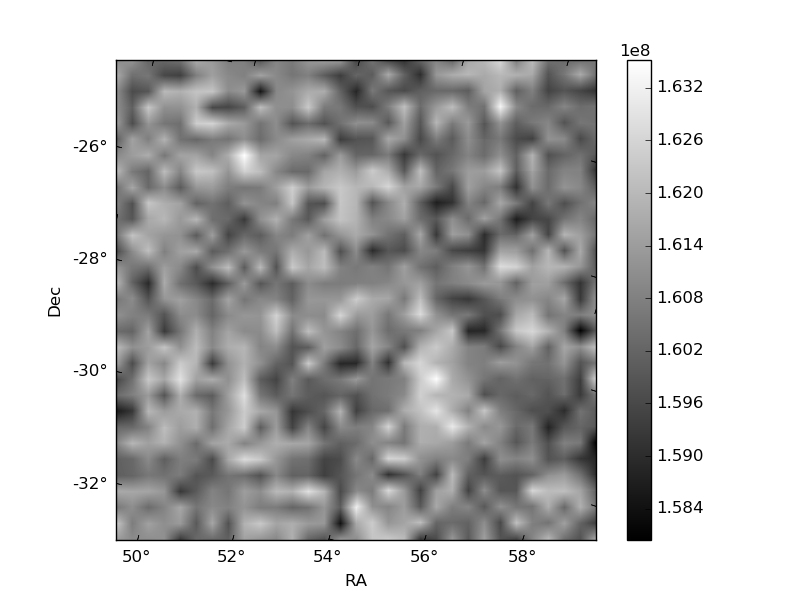
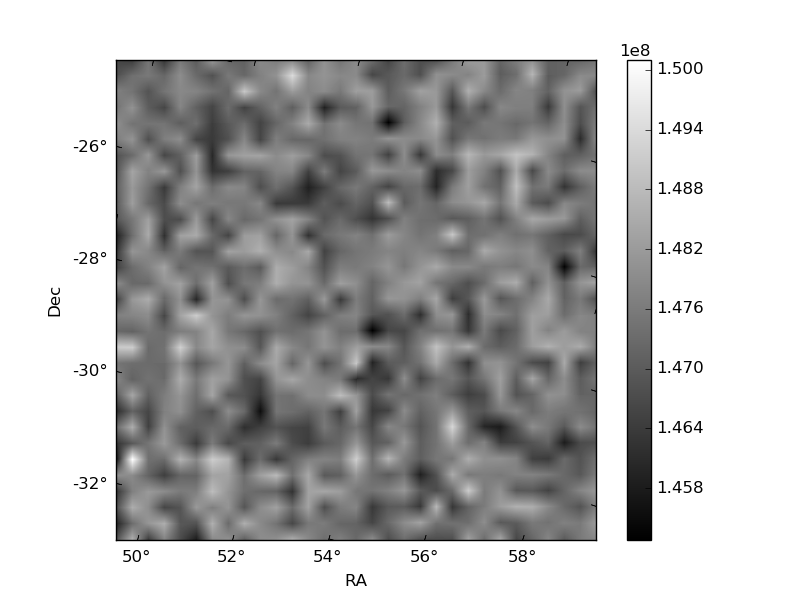
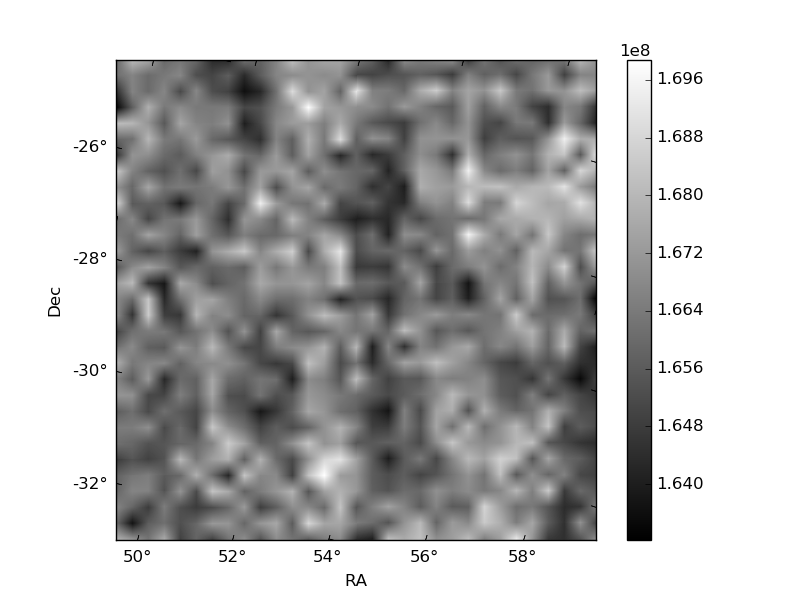
Histogram calculated using DETX and DETY for each event in the final _common_clean file
| Quadrant A | 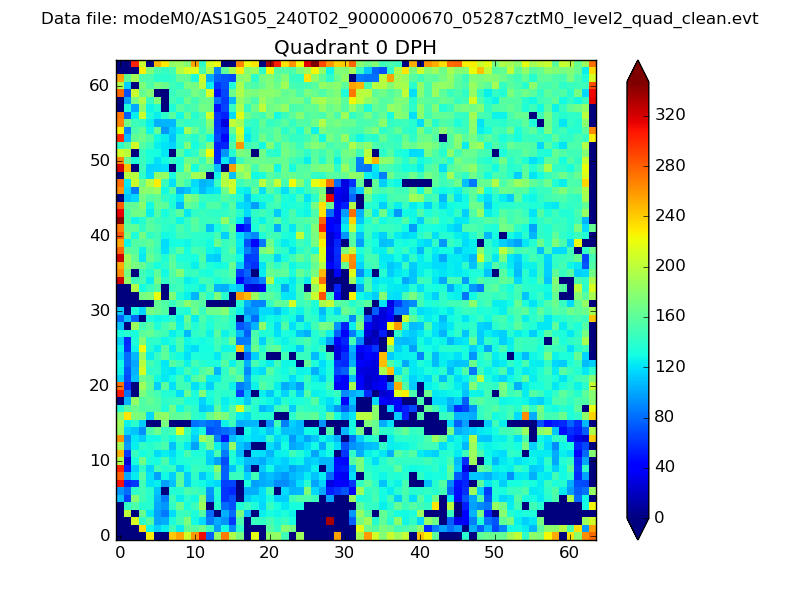 |
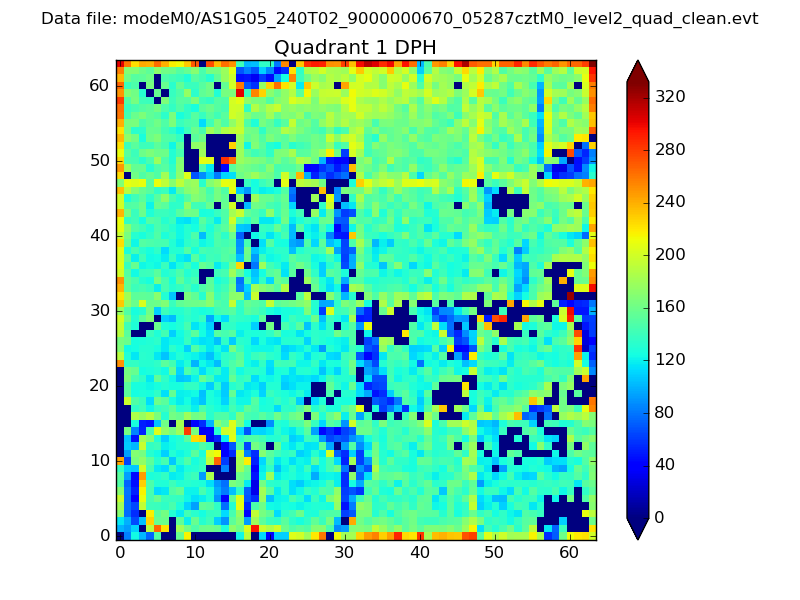 |
Quadrant B |
|---|---|---|---|
| Quadrant D | 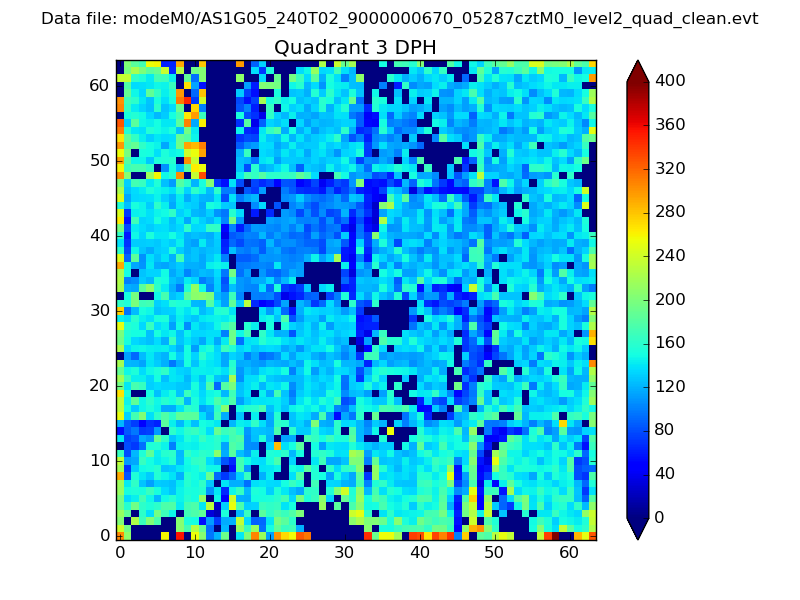 |
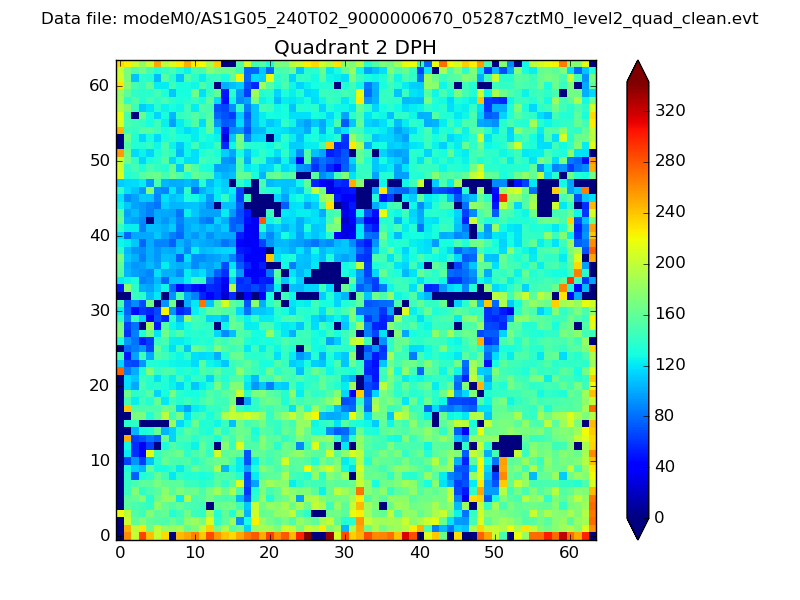 |
Quadrant C |
| Plot type | Count rate plots | Images |
|---|---|---|
| Comparison with Poisson distribution Blue bars denote a histogram of data divided into 1 sec bins. Red curve is a Poisson curve with rate = median count rate of data. |
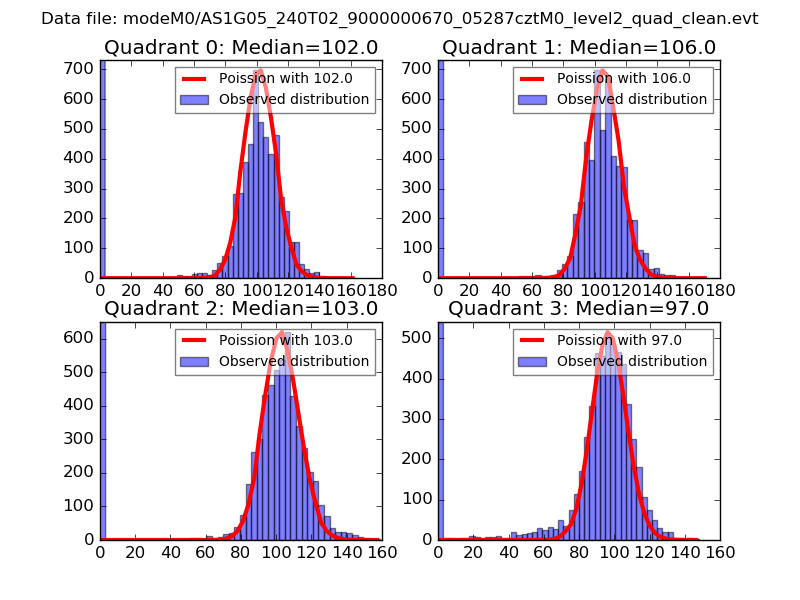 |
 |
| Quadrant-wise count rates Data is divided into 100 sec bins |
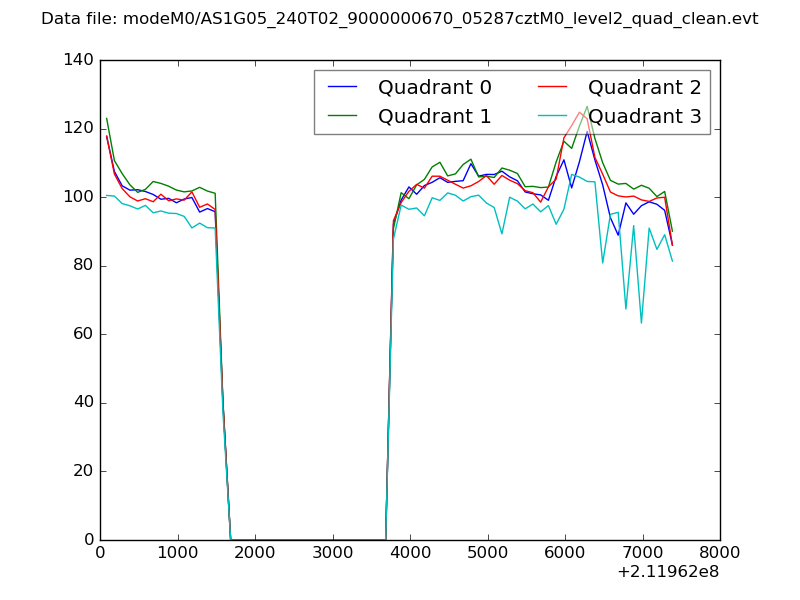 |
|
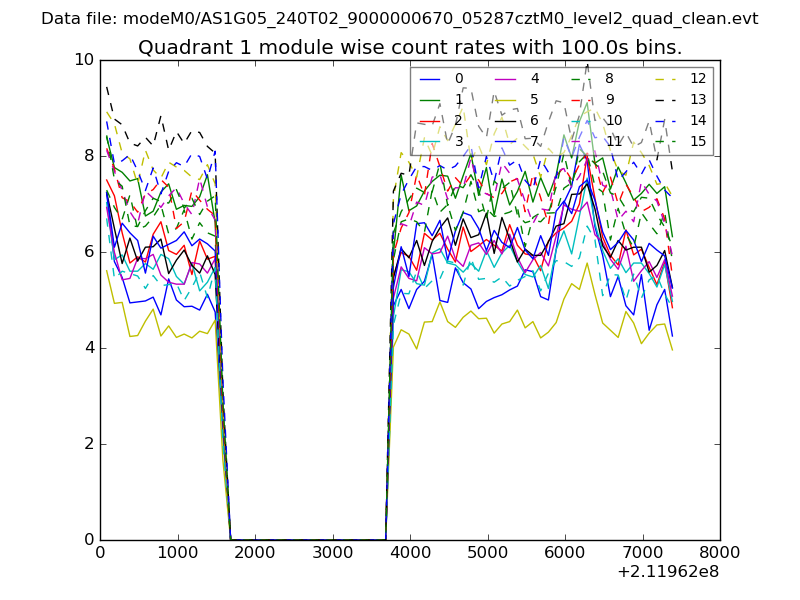
| Module-wise count rates for Quadrant A Data is divided into 100 sec bins |
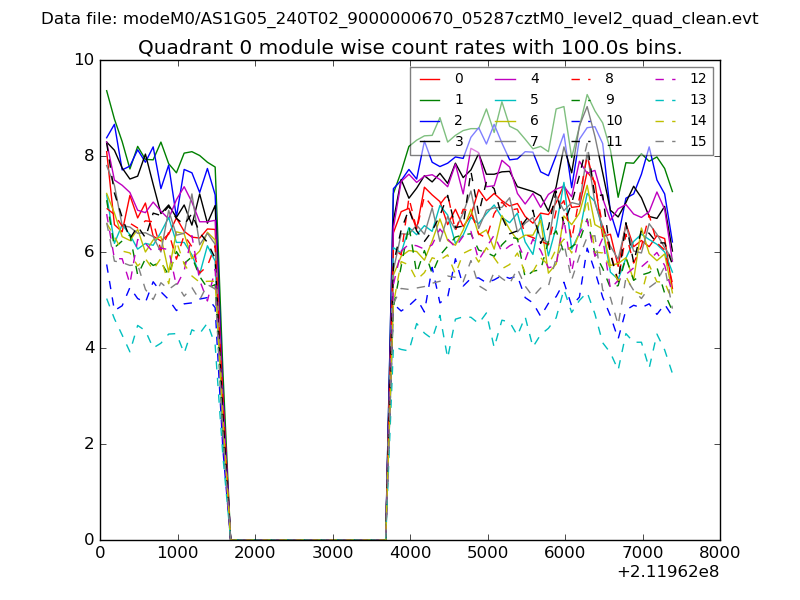 |
 |
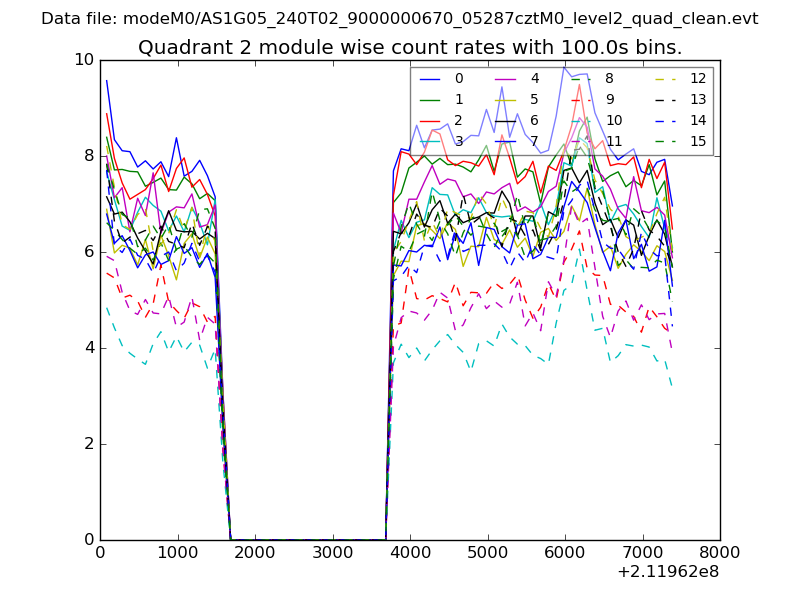
| Module-wise count rates for Quadrant B Data is divided into 100 sec bins |
 |
 |
| Module-wise count rates for Quadrant C Data is divided into 100 sec bins |
 |
 |
| Module-wise count rates for Quadrant D Data is divided into 100 sec bins |
 |
 |
| Parameter | Plot |
|---|---|
| CZT HV Monitor | 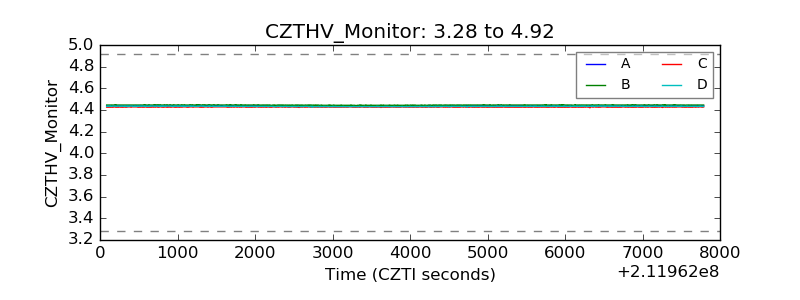 |
| D_VDD | 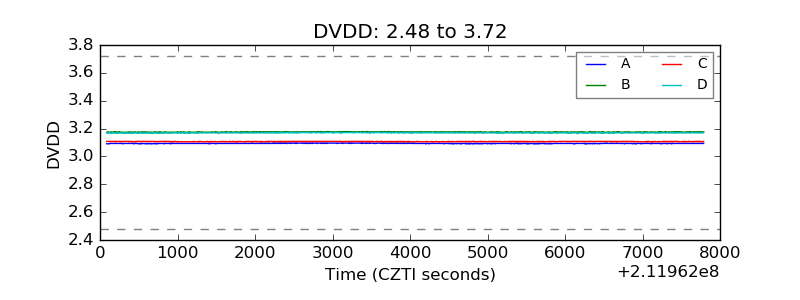 |
| Temperature 1 | 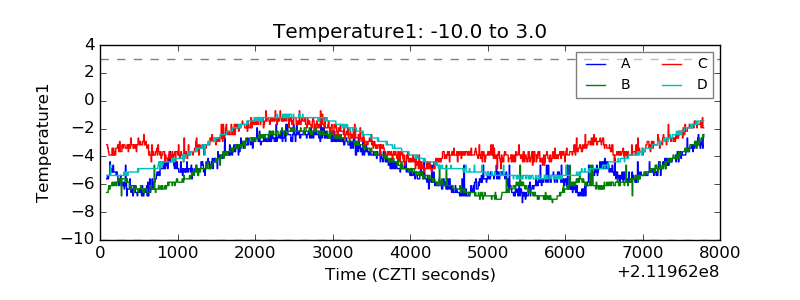 |
| Veto HV Monitor | 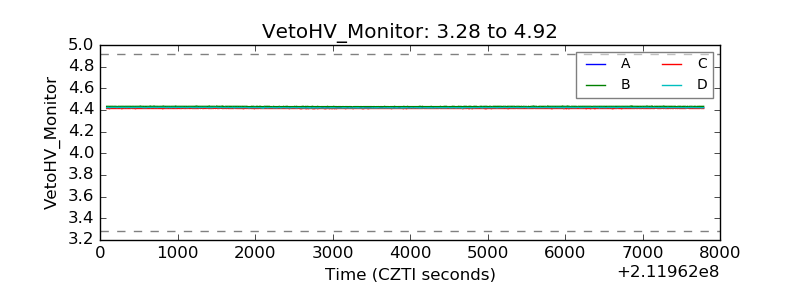 |
| Veto LLD | 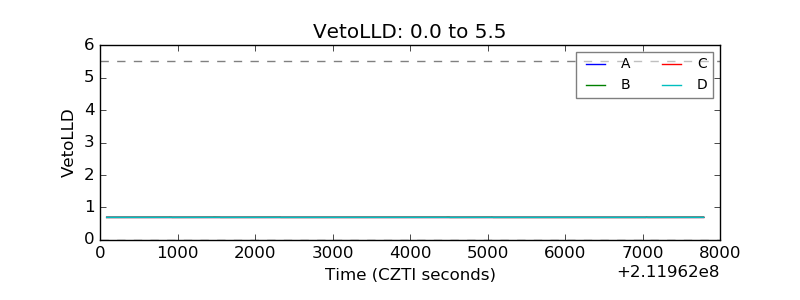 |
| Alpha Counter | 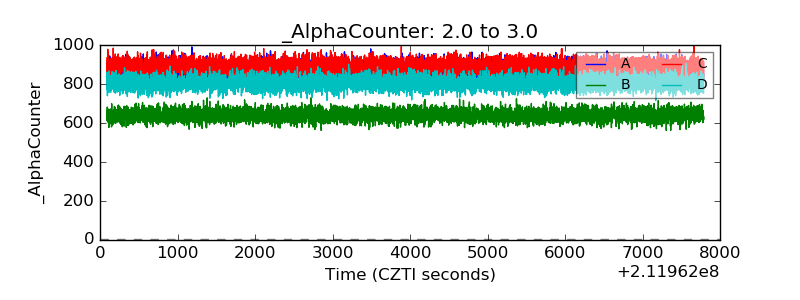 |
| _CPM_Rate | 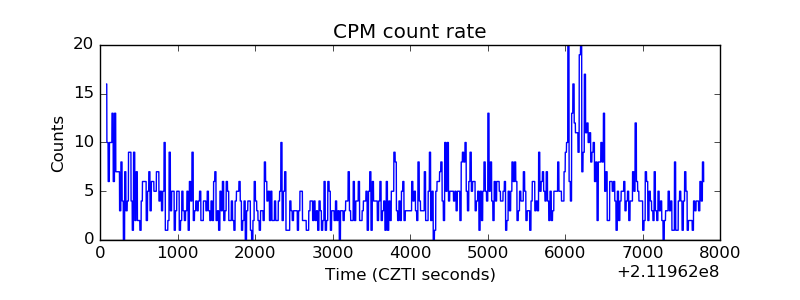 |
| CZT Counter | 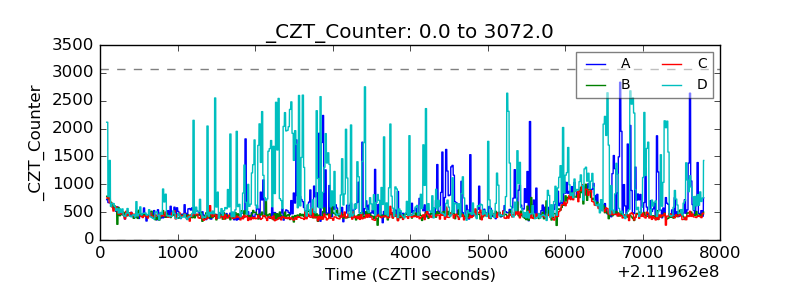 |
| +2.5 Volts monitor |  |
| +5 Volts monitor | 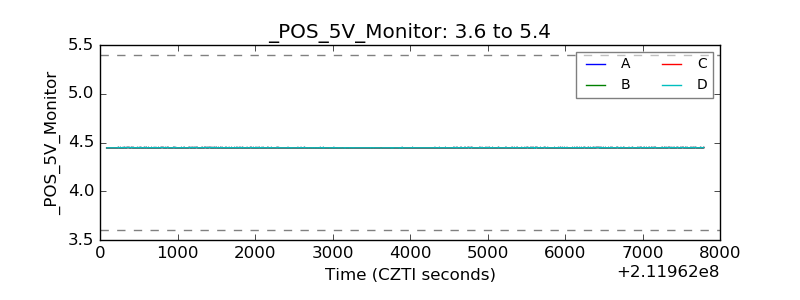 |
| _ROLL_ROT | 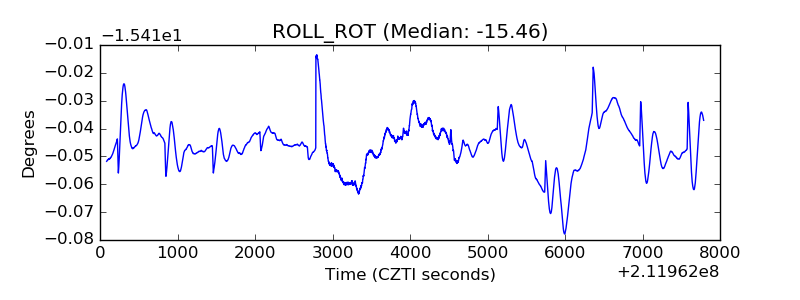 |
| _Roll_DEC | 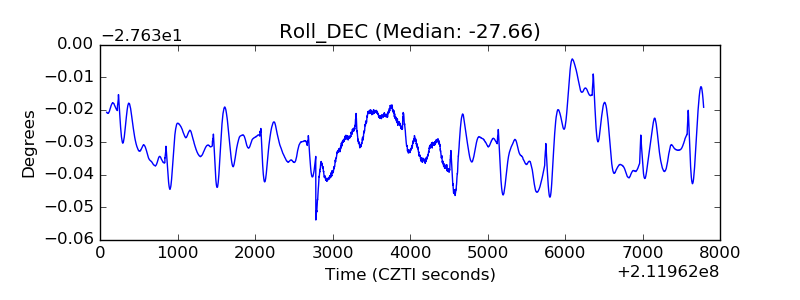 |
| _Roll_RA | 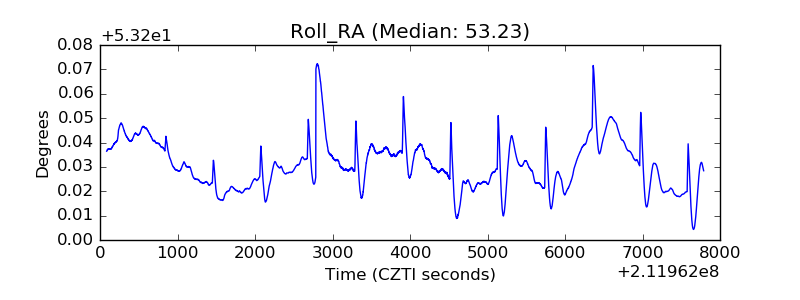 |
| Veto Counter | 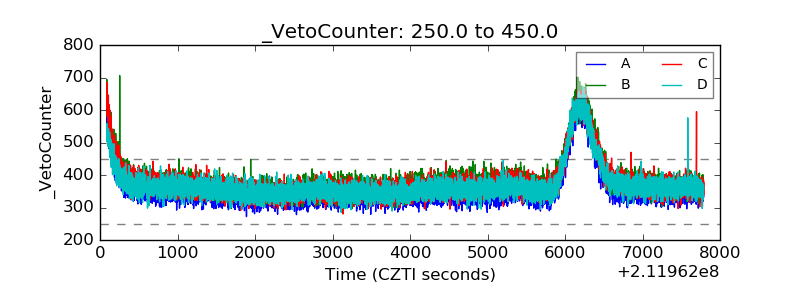 |