| Param | Original file | Final file |
|---|---|---|
| Filename | modeM0/AS1G05_240T02_9000000670_05291cztM0_level2.evt | modeM0/AS1G05_240T02_9000000670_05291cztM0_level2_quad_clean.evt |
| Size (bytes) | 188,242,560 | 19,658,880 |
| Size | 179.5 MB | 18.7 MB |
| Events in quadrant A | 1,542,146 | 110,975 |
| Events in quadrant B | 961,162 | 118,584 |
| Events in quadrant C | 928,860 | 114,556 |
| Events in quadrant D | 2,124,427 | 98,810 |
| Mode SS | |||
|---|---|---|---|
| Quadrant | BADHDUFLAG | Total packets | Discarded packets |
| A | 0 | 42 | 0 |
| B | 0 | 42 | 0 |
| C | 0 | 42 | 0 |
| D | 0 | 42 | 0 |
| Mode M0 | |||
|---|---|---|---|
| Quadrant | BADHDUFLAG | Total packets | Discarded packets |
| A | 0 | 5973 | 1 |
| B | 0 | 4301 | 0 |
| C | 0 | 4270 | 0 |
| D | 0 | 7738 | 0 |
| Quadrant | Total seconds | Saturated seconds | Saturation percentage |
|---|---|---|---|
| A | 2090 | 108 | 5.167464% |
| B | 2090 | 4 | 0.191388% |
| C | 2090 | 5 | 0.239234% |
| D | 2090 | 386 | 18.468900% |
Noise dominated data is calculated using 1-second bins in cleaned event files. If a bin has >2000 counts, and if more than 50% of those come from <1% of pixels, then it is considered to be noise-dominated and hence unusable.
| Quadrant | # 1 sec bins | Bins with >0 counts | Bins with >2000 counts | High rate bins dominated by noise | Noise dominated (total time) | Noise dominated (detector-on time) | Marked lightcurve |
|---|---|---|---|---|---|---|---|
| A | 2090 | 2090 | 91 | 91 | 4.35% | 4.35% | 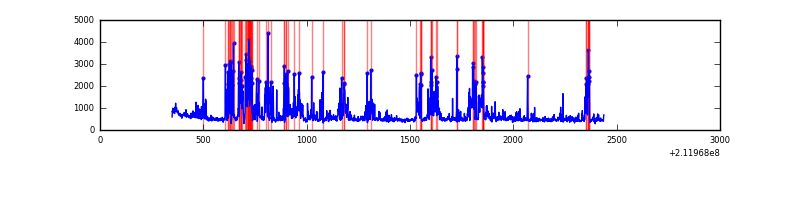 |
| B | 2090 | 2090 | 0 | 0 | 0.00% | 0.00% | 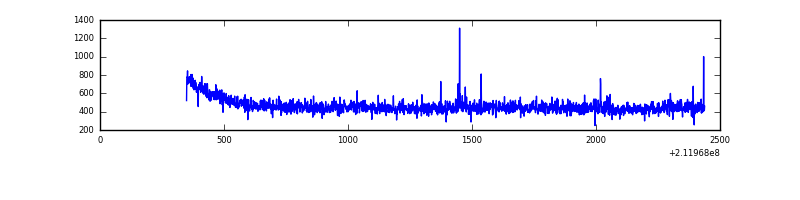 |
| C | 2090 | 2090 | 0 | 0 | 0.00% | 0.00% |  |
| D | 2090 | 2090 | 303 | 303 | 14.50% | 14.50% | 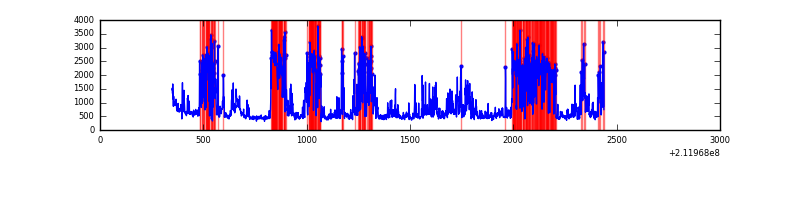 |
Top three noisy pixels from each quadrant. If the there are fewer than three noisy pixels in the level2.evt file, extra rows are filled as -1
| Pixel properties | Quadrant properties | ||||||
|---|---|---|---|---|---|---|---|
| Quadrant | DetID | PixID | Counts | Sigma | Mean | Median | Sigma |
| A | 13 | 251 | 625634 | 12458.34 | 237 | 231 | 50.2 |
| A | 12 | 194 | 2356 | 42.33 | 237 | 231 | 50.2 |
| A | 0 | 226 | 2314 | 41.49 | 237 | 231 | 50.2 |
| B | 15 | 204 | 6123 | 119.51 | 243 | 238 | 49.2 |
| B | 15 | 54 | 5213 | 101.03 | 243 | 238 | 49.2 |
| B | 12 | 111 | 4511 | 86.78 | 243 | 238 | 49.2 |
| C | 13 | 61 | 1882 | 28.44 | 238 | 238 | 57.8 |
| C | 14 | 67 | 632 | 6.81 | 238 | 238 | 57.8 |
| C | 3 | 202 | 593 | 6.13 | 238 | 238 | 57.8 |
| D | 11 | 145 | 1237944 | 22432.11 | 217 | 210 | 55.2 |
| D | 2 | 136 | 33774 | 608.3 | 217 | 210 | 55.2 |
| D | 8 | 195 | 16884 | 302.19 | 217 | 210 | 55.2 |
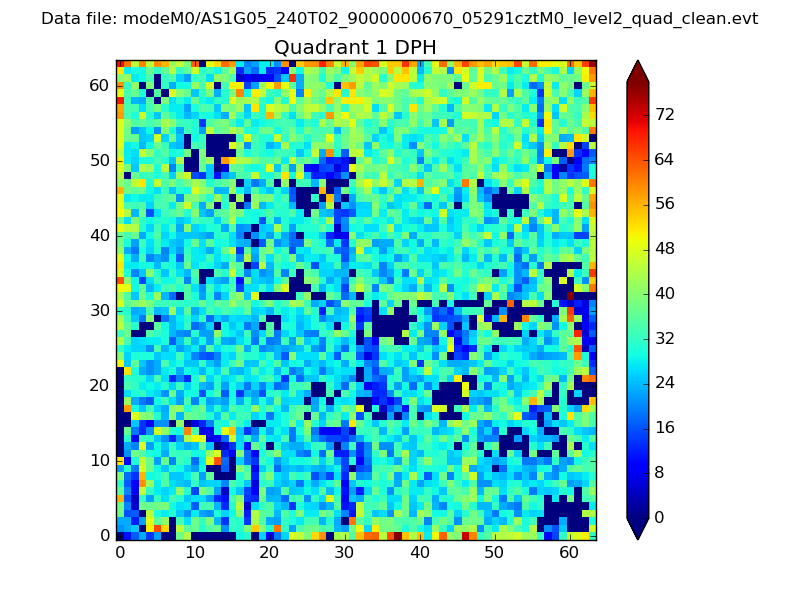
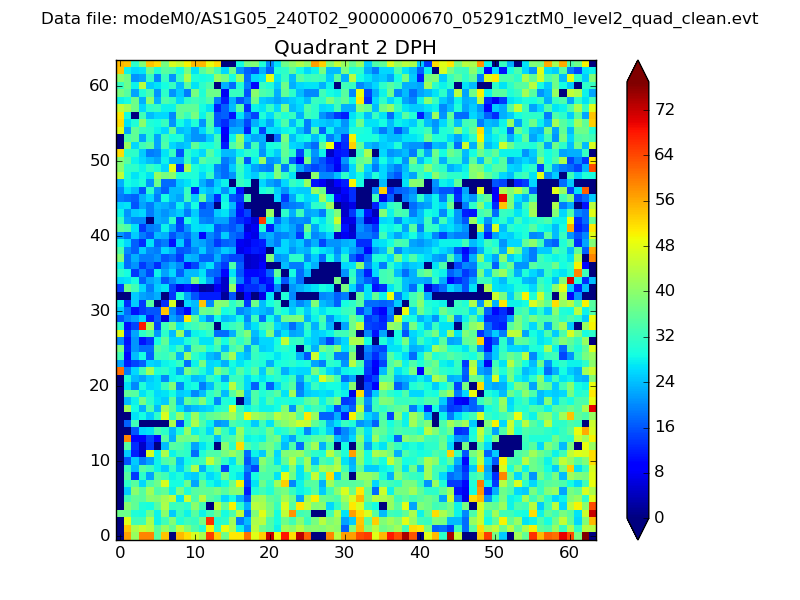
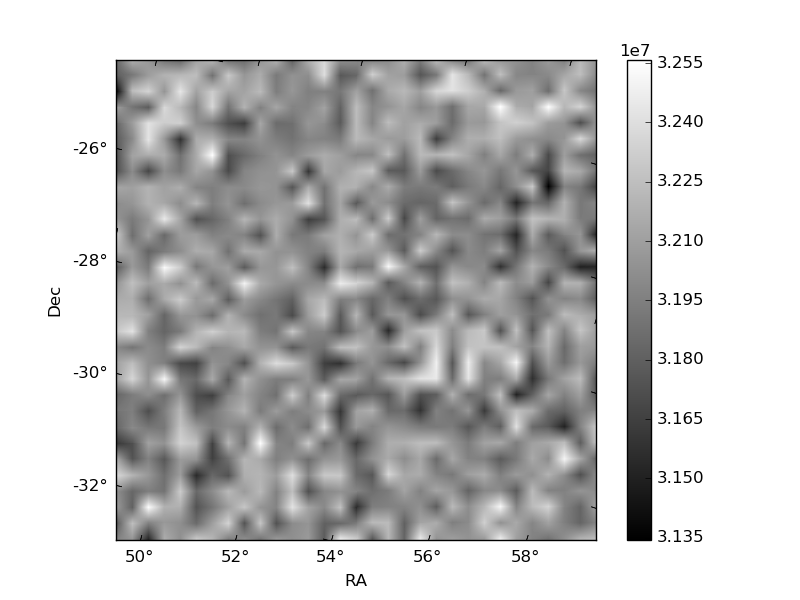
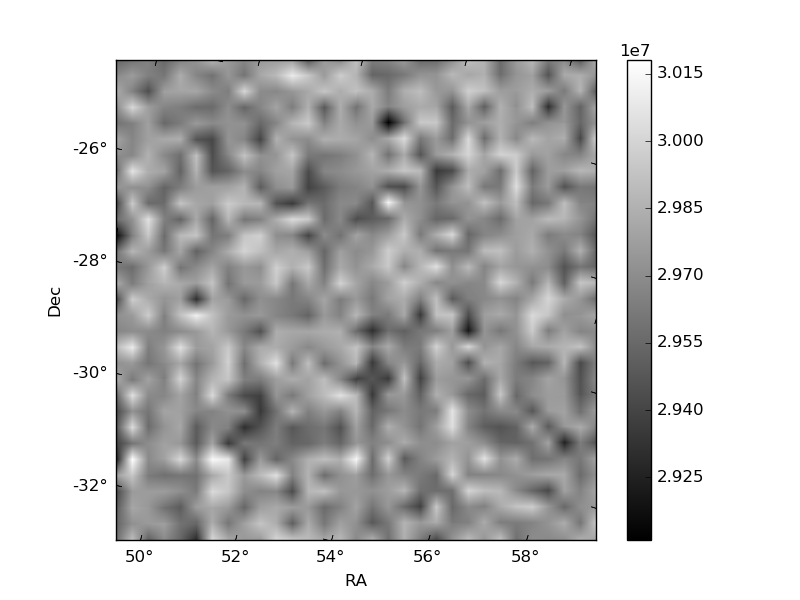
Histogram calculated using DETX and DETY for each event in the final _common_clean file
| Quadrant A |  |
 |
Quadrant B |
|---|---|---|---|
| Quadrant D | 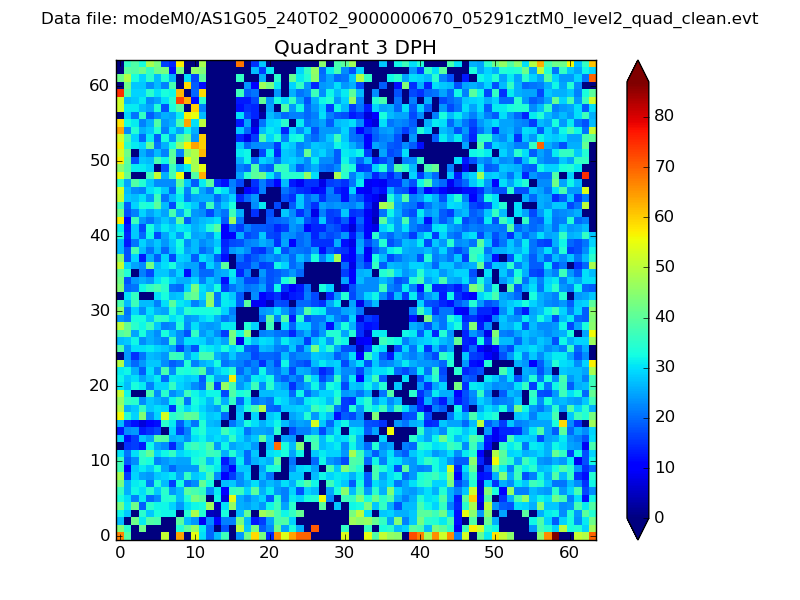 |
 |
Quadrant C |
| Plot type | Count rate plots | Images |
|---|---|---|
| Comparison with Poisson distribution Blue bars denote a histogram of data divided into 1 sec bins. Red curve is a Poisson curve with rate = median count rate of data. |
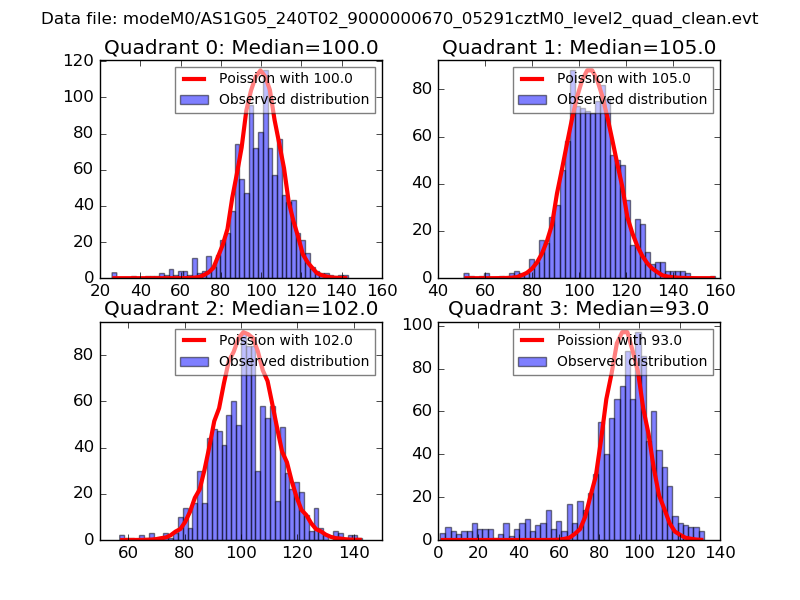 |
 |
| Quadrant-wise count rates Data is divided into 100 sec bins |
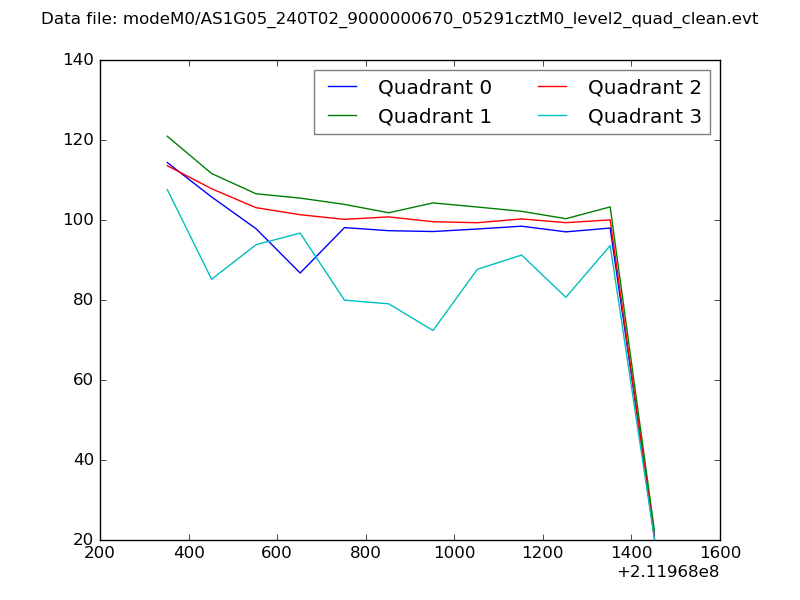 |
|
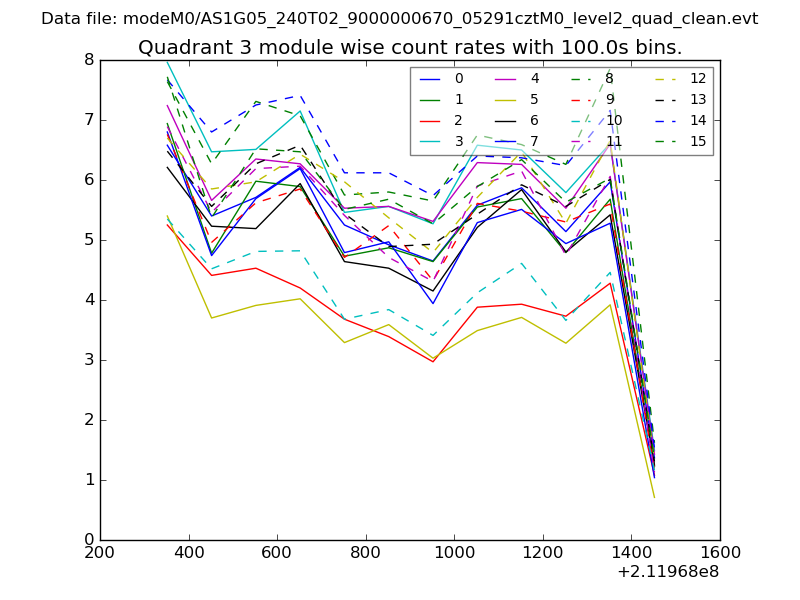
| Module-wise count rates for Quadrant A Data is divided into 100 sec bins |
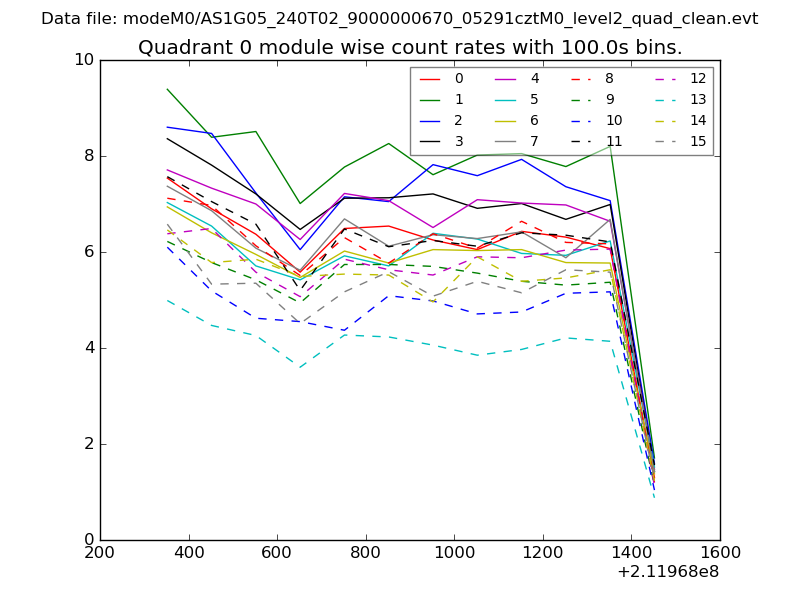 |
 |
| Module-wise count rates for Quadrant B Data is divided into 100 sec bins |
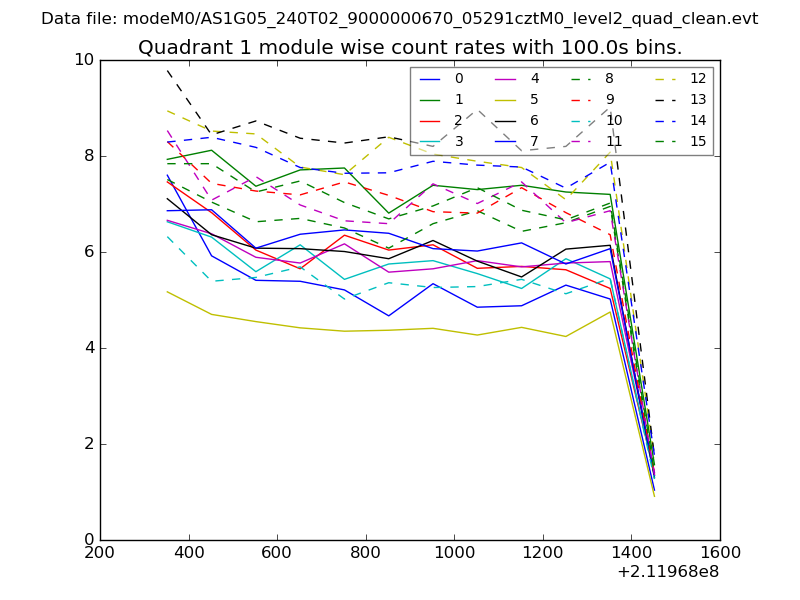 |
 |
| Module-wise count rates for Quadrant C Data is divided into 100 sec bins |
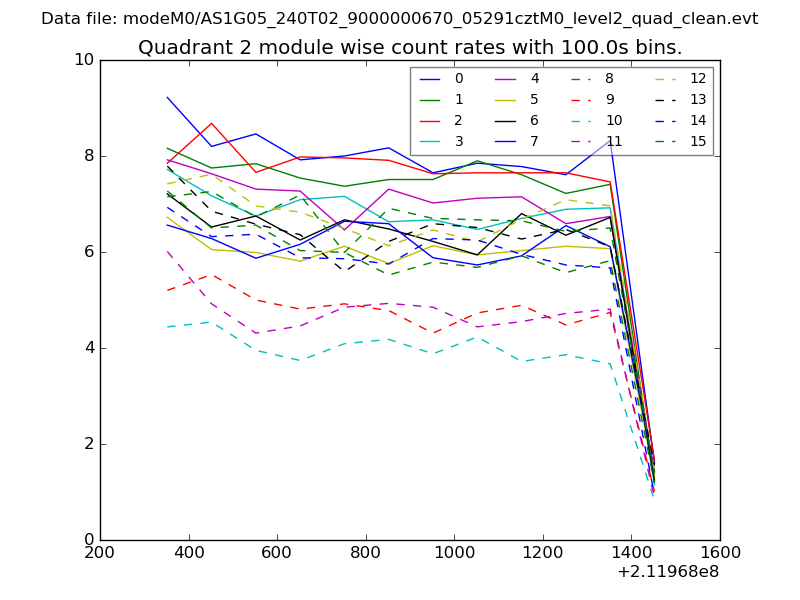 |
 |
| Module-wise count rates for Quadrant D Data is divided into 100 sec bins |
 |
 |
| Parameter | Plot |
|---|---|
| CZT HV Monitor | 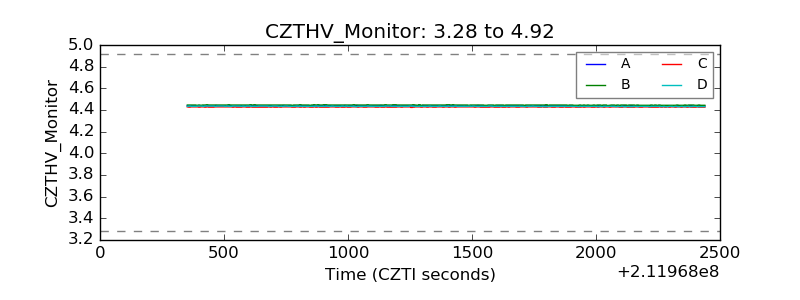 |
| D_VDD | 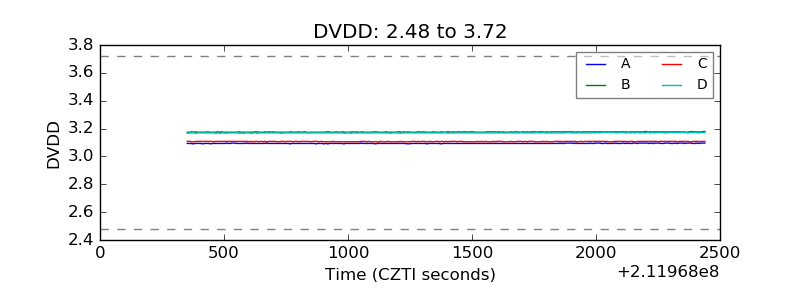 |
| Temperature 1 | 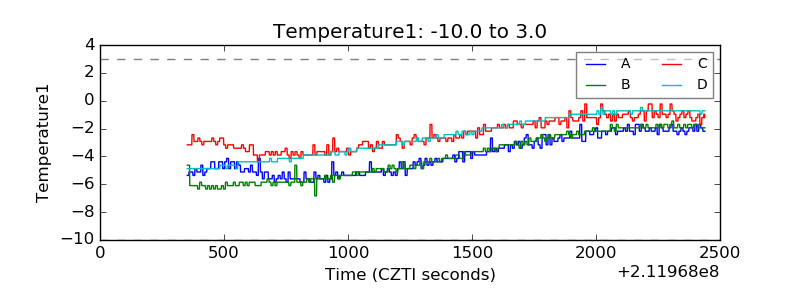 |
| Veto HV Monitor | 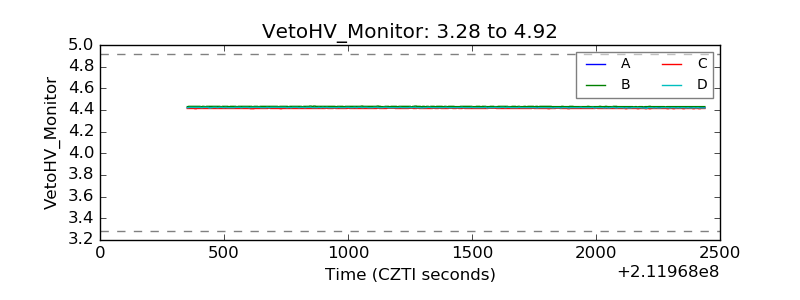 |
| Veto LLD | 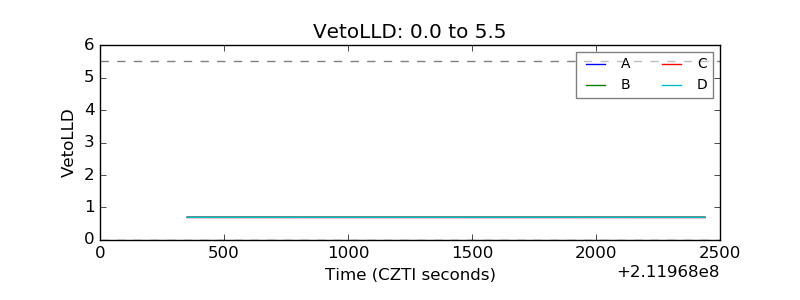 |
| Alpha Counter | 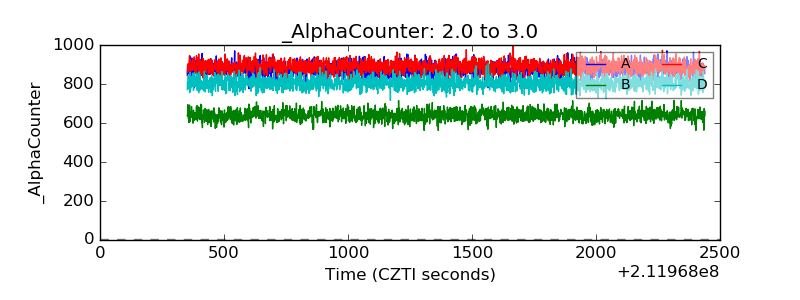 |
| _CPM_Rate | 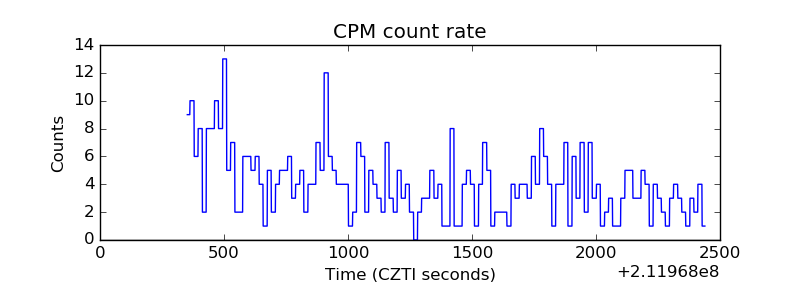 |
| CZT Counter | 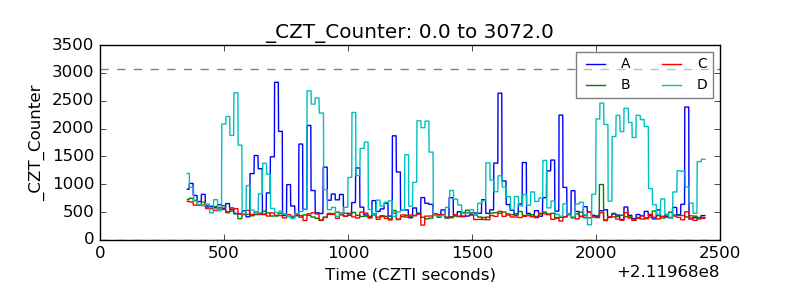 |
| +2.5 Volts monitor |  |
| +5 Volts monitor |  |
| _ROLL_ROT | 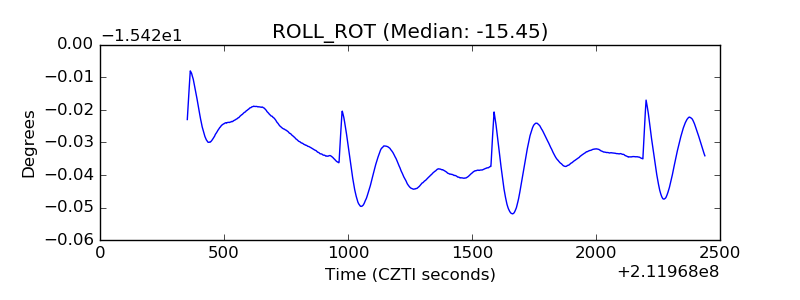 |
| _Roll_DEC | 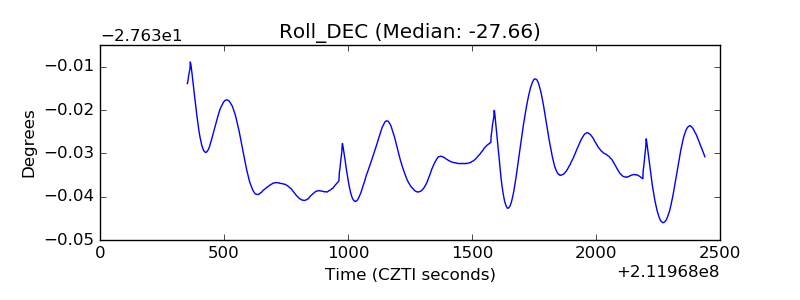 |
| _Roll_RA |  |
| Veto Counter | 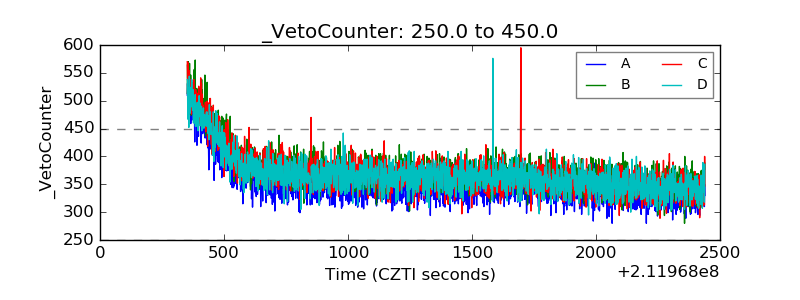 |