| Param | Original file | Final file |
|---|---|---|
| Filename | modeM0/AS1G05_240T02_9000000670_05292cztM0_level2.evt | modeM0/AS1G05_240T02_9000000670_05292cztM0_level2_quad_clean.evt |
| Size (bytes) | 2,392,750,080 | 300,090,240 |
| Size | 2.2 GB | 286.2 MB |
| Events in quadrant A | 16,714,092 | 1,832,247 |
| Events in quadrant B | 13,430,953 | 1,856,976 |
| Events in quadrant C | 12,572,408 | 1,820,279 |
| Events in quadrant D | 27,837,892 | 1,630,955 |
| Mode SS | |||
|---|---|---|---|
| Quadrant | BADHDUFLAG | Total packets | Discarded packets |
| A | 0 | 576 | 0 |
| B | 0 | 576 | 0 |
| C | 0 | 576 | 0 |
| D | 0 | 576 | 0 |
| Mode M9 | |||
|---|---|---|---|
| Quadrant | BADHDUFLAG | Total packets | Discarded packets |
| A | 0 | 27 | 0 |
| B | 0 | 27 | 0 |
| C | 0 | 27 | 0 |
| D | 0 | 27 | 0 |
| Mode M0 | |||
|---|---|---|---|
| Quadrant | BADHDUFLAG | Total packets | Discarded packets |
| A | 0 | 68541 | 5 |
| B | 0 | 59240 | 4 |
| C | 0 | 58094 | 4 |
| D | 0 | 102426 | 4 |
| Quadrant | Total seconds | Saturated seconds | Saturation percentage |
|---|---|---|---|
| A | 28307 | 952 | 3.363126% |
| B | 28307 | 544 | 1.921786% |
| C | 28307 | 384 | 1.356555% |
| D | 28307 | 5207 | 18.394743% |
Noise dominated data is calculated using 1-second bins in cleaned event files. If a bin has >2000 counts, and if more than 50% of those come from <1% of pixels, then it is considered to be noise-dominated and hence unusable.
| Quadrant | # 1 sec bins | Bins with >0 counts | Bins with >2000 counts | High rate bins dominated by noise | Noise dominated (total time) | Noise dominated (detector-on time) | Marked lightcurve |
|---|---|---|---|---|---|---|---|
| A | 31102 | 28307 | 270 | 270 | 0.87% | 0.95% | 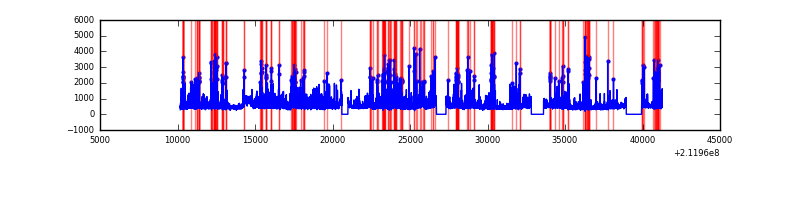 |
| B | 31102 | 28307 | 30 | 30 | 0.10% | 0.11% | 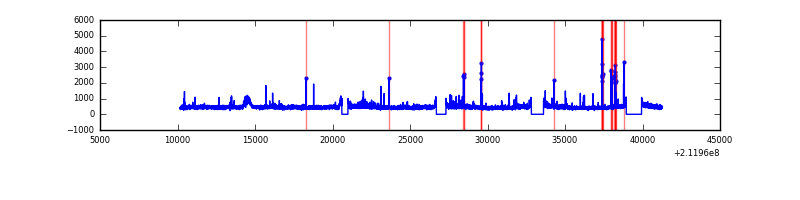 |
| C | 31102 | 28310 | 1 | 1 | 0.00% | 0.00% | 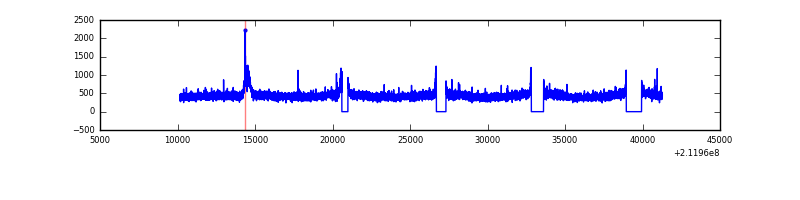 |
| D | 31101 | 28308 | 4054 | 4054 | 13.03% | 14.32% | 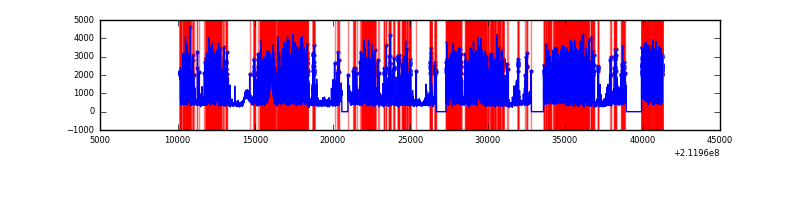 |
Top three noisy pixels from each quadrant. If the there are fewer than three noisy pixels in the level2.evt file, extra rows are filled as -1
| Pixel properties | Quadrant properties | ||||||
|---|---|---|---|---|---|---|---|
| Quadrant | DetID | PixID | Counts | Sigma | Mean | Median | Sigma |
| A | 13 | 251 | 3967649 | 5907.67 | 3274 | 3198 | 671.1 |
| A | 0 | 50 | 139815 | 203.58 | 3274 | 3198 | 671.1 |
| A | 12 | 194 | 32570 | 43.77 | 3274 | 3198 | 671.1 |
| B | 10 | 16 | 166280 | 255.3 | 3325 | 3240 | 638.6 |
| B | 4 | 80 | 108190 | 164.34 | 3325 | 3240 | 638.6 |
| B | 15 | 204 | 107415 | 163.12 | 3325 | 3240 | 638.6 |
| C | 13 | 61 | 25948 | 30.44 | 3213 | 3227 | 746.4 |
| C | 12 | 4 | 12393 | 12.28 | 3213 | 3227 | 746.4 |
| C | 14 | 67 | 11349 | 10.88 | 3213 | 3227 | 746.4 |
| D | 11 | 145 | 14930434 | 20507.54 | 2962 | 2874 | 727.9 |
| D | 2 | 33 | 638351 | 873.02 | 2962 | 2874 | 727.9 |
| D | 2 | 136 | 380193 | 518.36 | 2962 | 2874 | 727.9 |
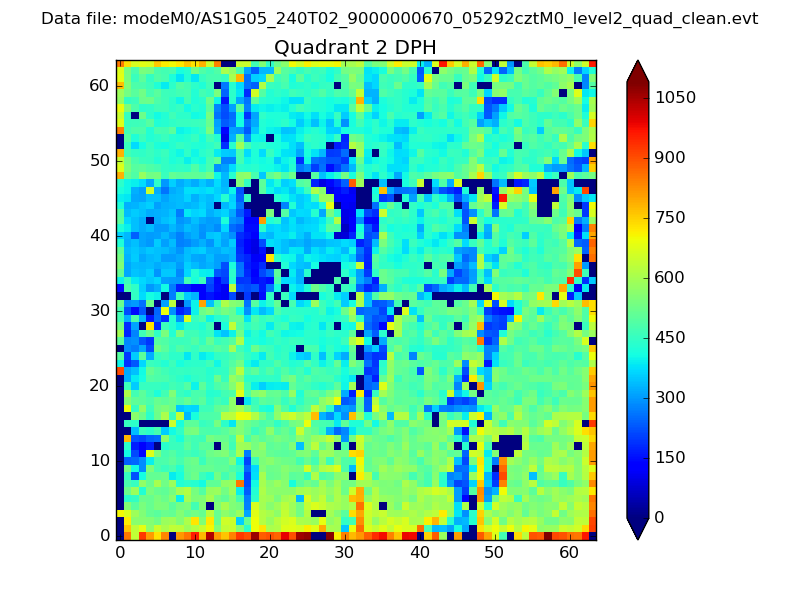
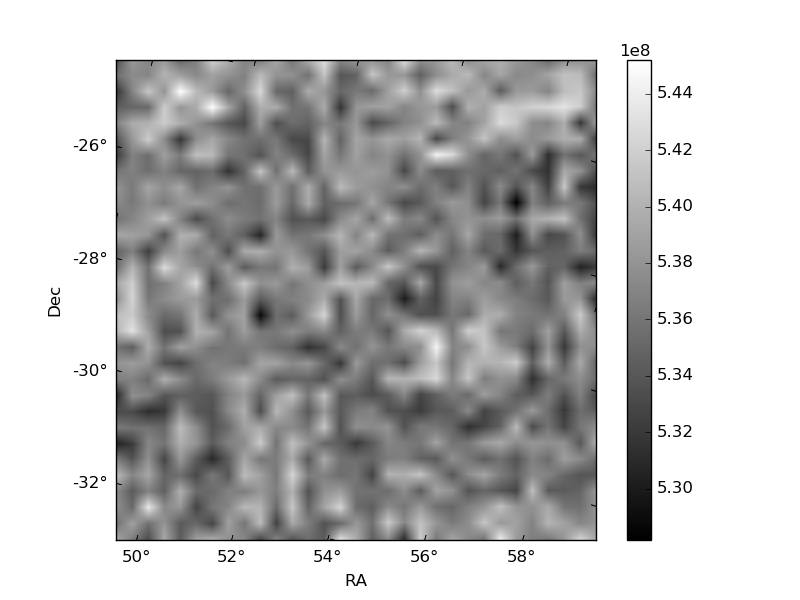
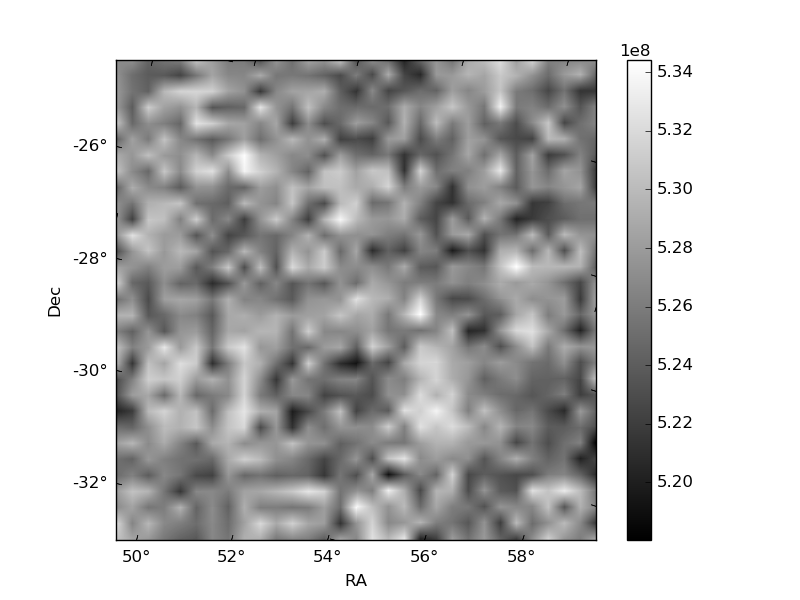
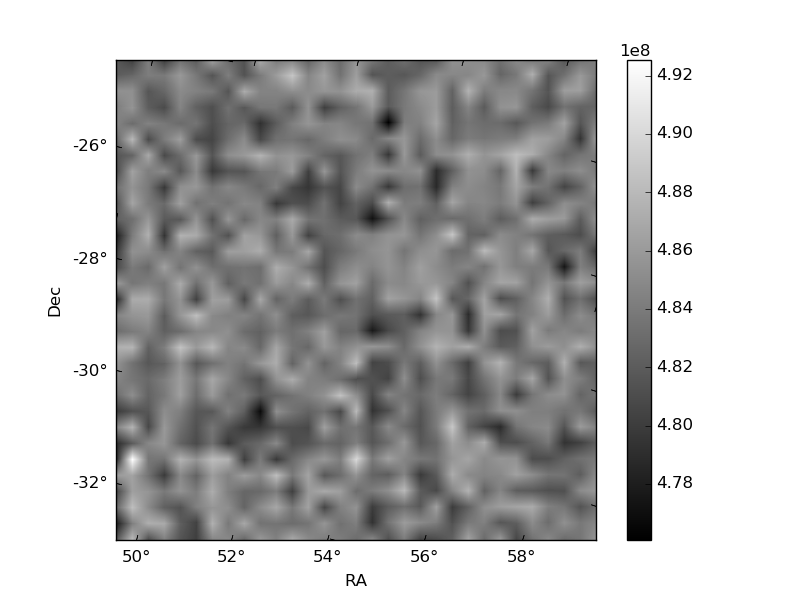
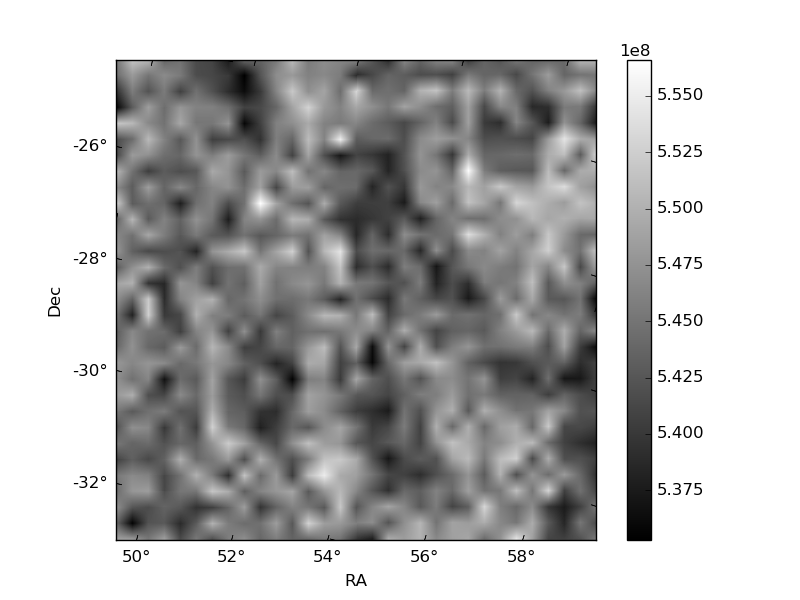
Histogram calculated using DETX and DETY for each event in the final _common_clean file
| Quadrant A | 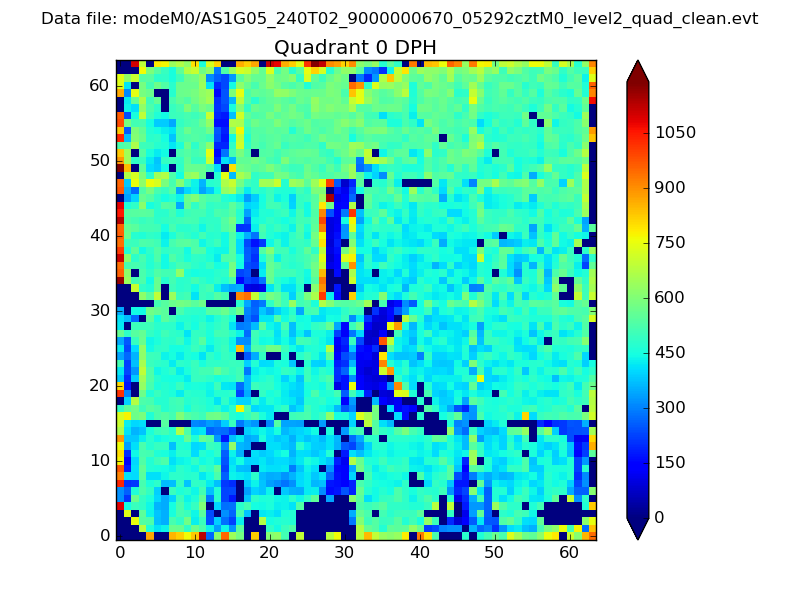 |
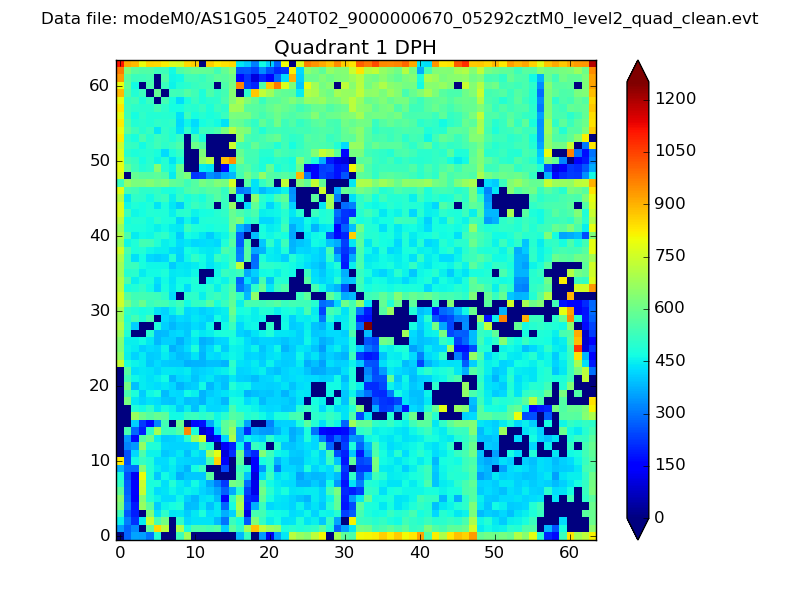 |
Quadrant B |
|---|---|---|---|
| Quadrant D | 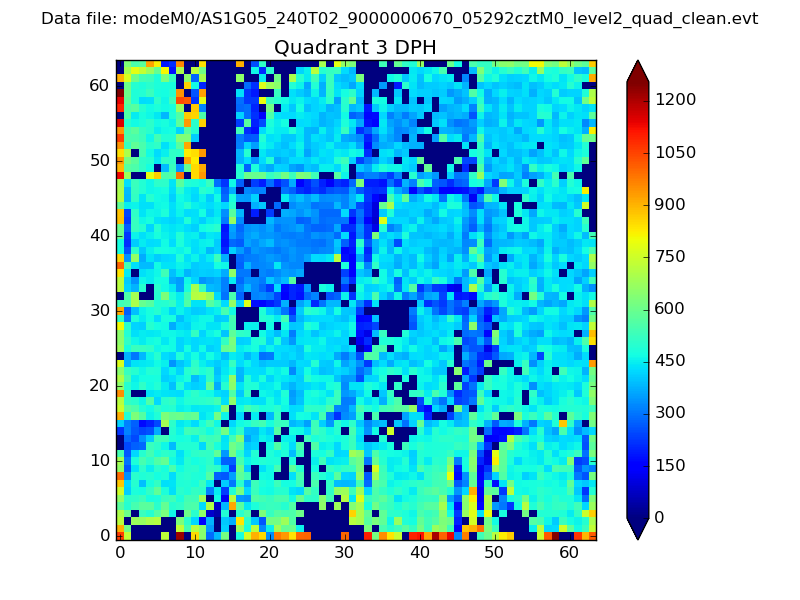 |
 |
Quadrant C |
| Plot type | Count rate plots | Images |
|---|---|---|
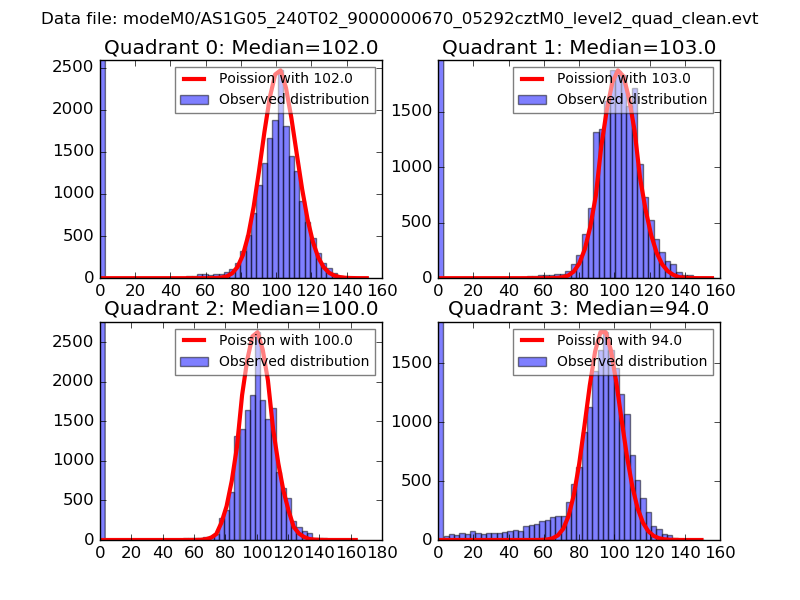
| Comparison with Poisson distribution Blue bars denote a histogram of data divided into 1 sec bins. Red curve is a Poisson curve with rate = median count rate of data. |
 |
 |
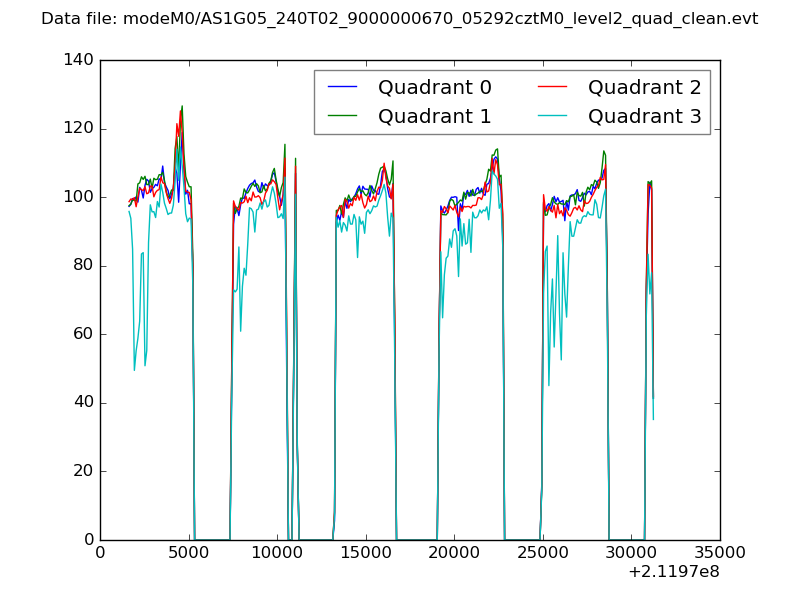
| Quadrant-wise count rates Data is divided into 100 sec bins |
 |
|
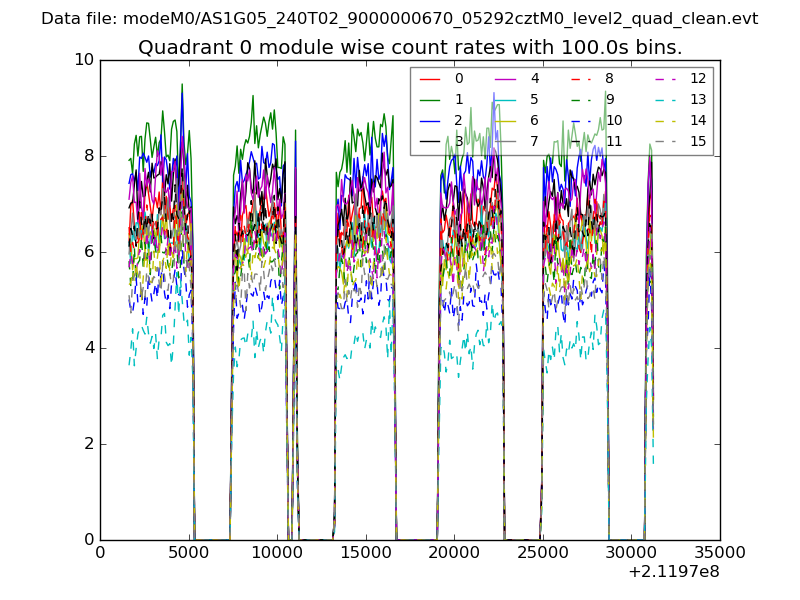
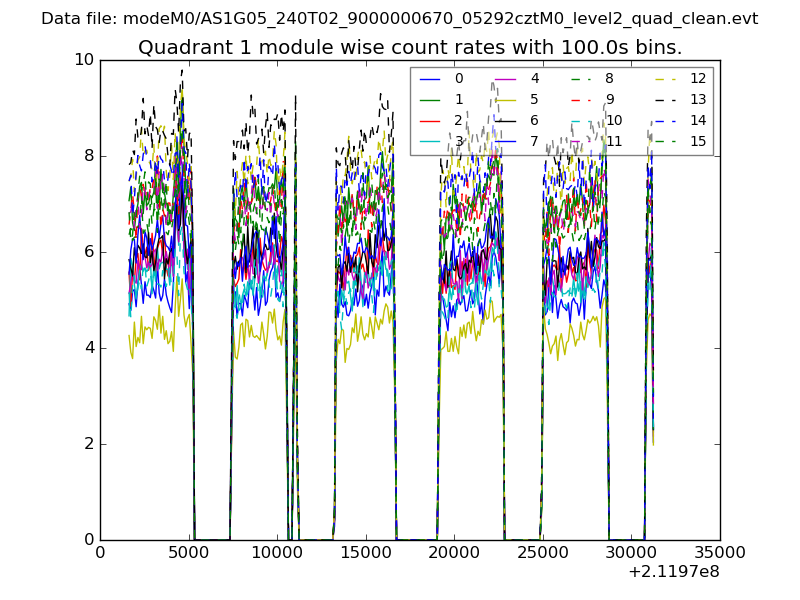
| Module-wise count rates for Quadrant A Data is divided into 100 sec bins |
 |
 |
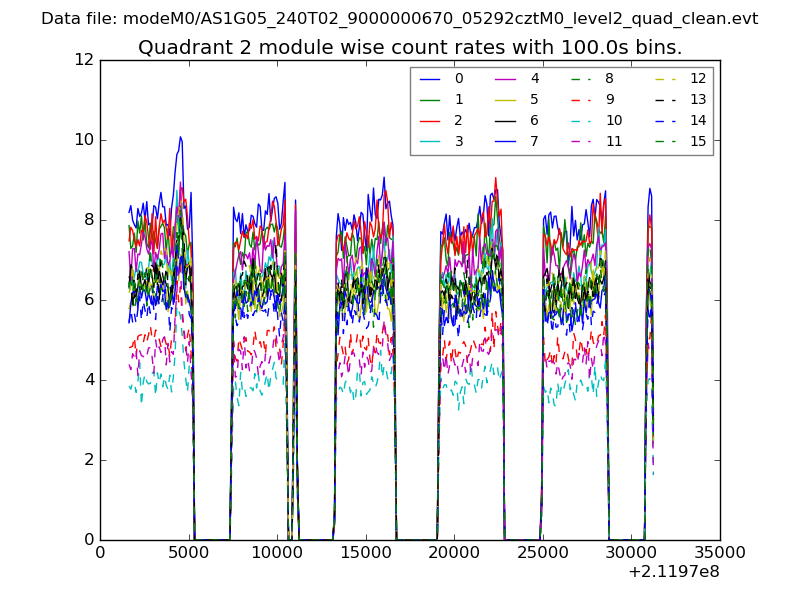
| Module-wise count rates for Quadrant B Data is divided into 100 sec bins |
 |
 |
| Module-wise count rates for Quadrant C Data is divided into 100 sec bins |
 |
 |
| Module-wise count rates for Quadrant D Data is divided into 100 sec bins |
 |
 |
| Parameter | Plot |
|---|---|
| CZT HV Monitor | 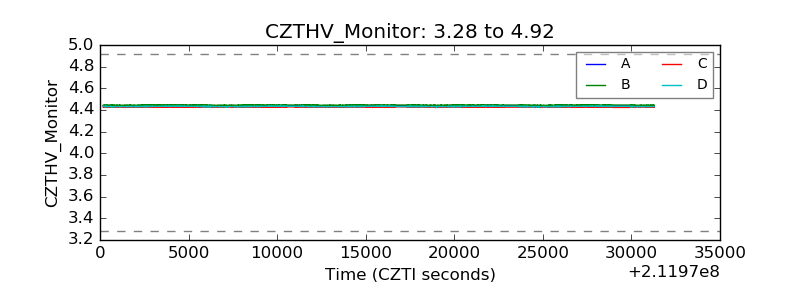 |
| D_VDD | 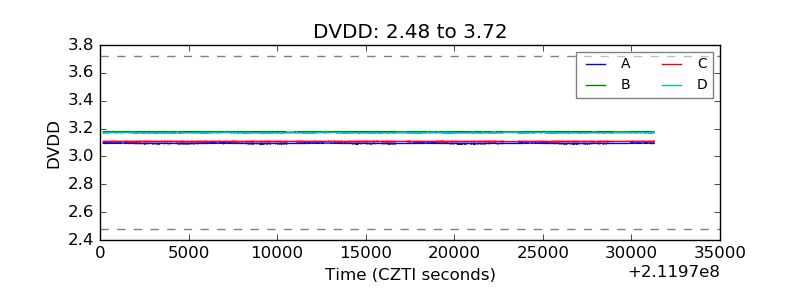 |
| Temperature 1 | 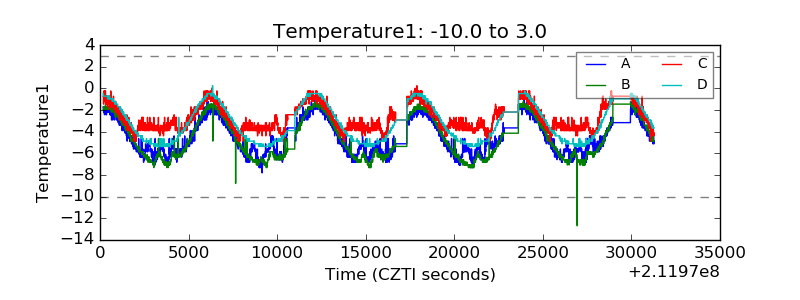 |
| Veto HV Monitor | 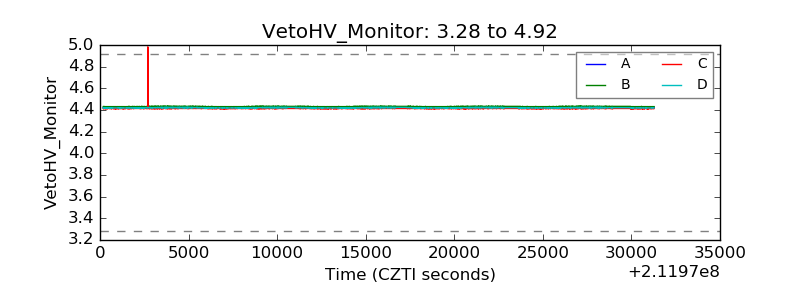 |
| Veto LLD | 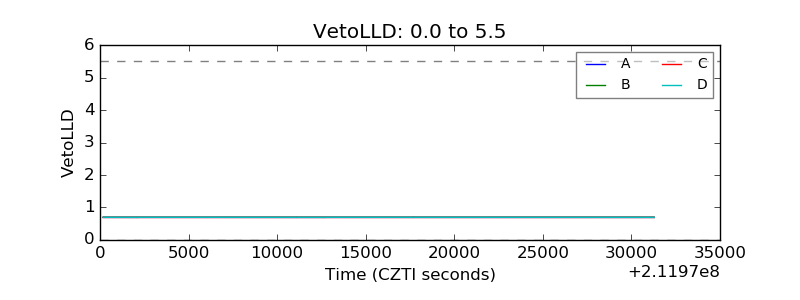 |
| Alpha Counter |  |
| _CPM_Rate | 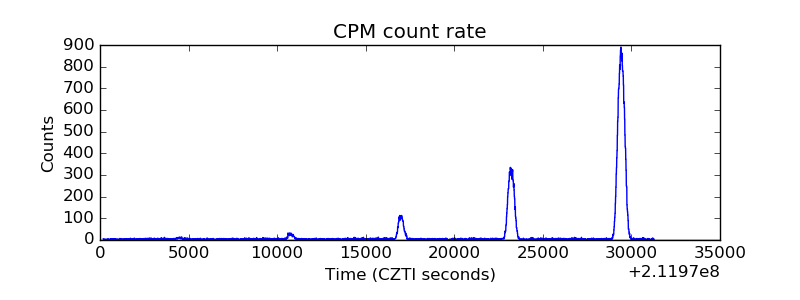 |
| CZT Counter | 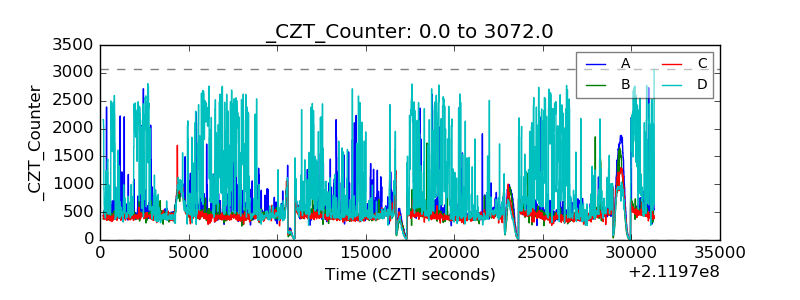 |
| +2.5 Volts monitor |  |
| +5 Volts monitor |  |
| _ROLL_ROT | 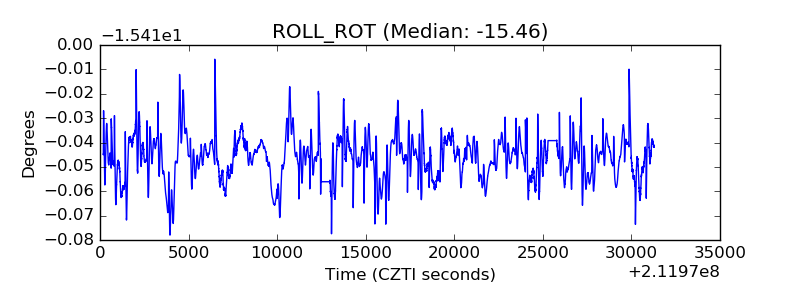 |
| _Roll_DEC | 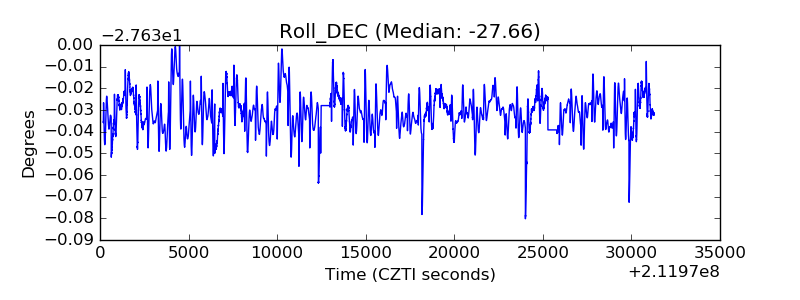 |
| _Roll_RA | 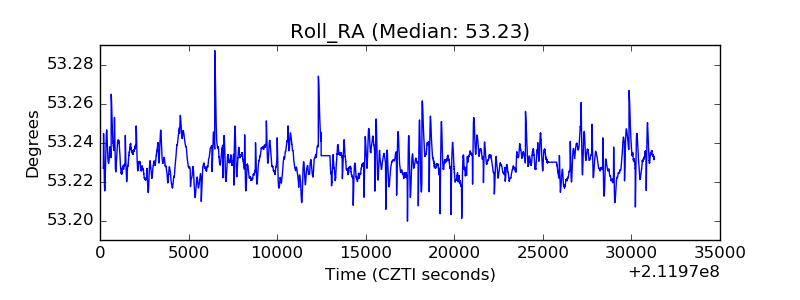 |
| Veto Counter | 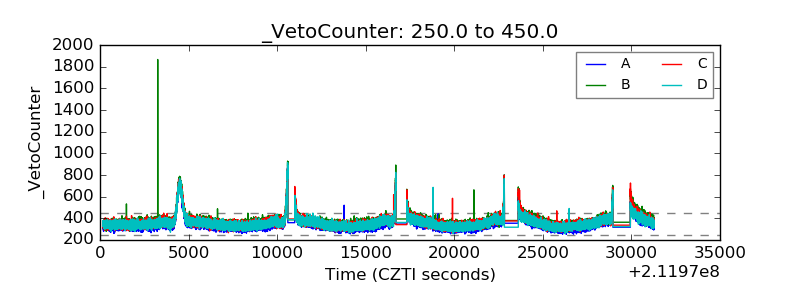 |