| Param | Original file | Final file |
|---|---|---|
| Filename | modeM0/AS1G05_240T02_9000000670_05295cztM0_level2.evt | modeM0/AS1G05_240T02_9000000670_05295cztM0_level2_quad_clean.evt |
| Size (bytes) | 259,807,680 | 32,495,040 |
| Size | 247.8 MB | 31.0 MB |
| Events in quadrant A | 1,303,263 | 217,337 |
| Events in quadrant B | 1,338,896 | 219,521 |
| Events in quadrant C | 1,132,837 | 214,067 |
| Events in quadrant D | 3,918,580 | 149,664 |
| Mode SS | |||
|---|---|---|---|
| Quadrant | BADHDUFLAG | Total packets | Discarded packets |
| A | 0 | 50 | 0 |
| B | 0 | 50 | 0 |
| C | 0 | 50 | 0 |
| D | 0 | 50 | 0 |
| Mode M9 | |||
|---|---|---|---|
| Quadrant | BADHDUFLAG | Total packets | Discarded packets |
| A | 1 | 251318637792 | 0 |
| B | 1 | -1 | -1 |
| C | 1 | -1 | -1 |
| D | 1 | -1 | -1 |
| Mode M0 | |||
|---|---|---|---|
| Quadrant | BADHDUFLAG | Total packets | Discarded packets |
| A | 0 | 5685 | 1 |
| B | 0 | 5625 | 1 |
| C | 0 | 5190 | 1 |
| D | 0 | 13431 | 1 |
| Quadrant | Total seconds | Saturated seconds | Saturation percentage |
|---|---|---|---|
| A | 2547 | 25 | 0.981547% |
| B | 2547 | 24 | 0.942285% |
| C | 2547 | 4 | 0.157048% |
| D | 2547 | 1066 | 41.853161% |
Noise dominated data is calculated using 1-second bins in cleaned event files. If a bin has >2000 counts, and if more than 50% of those come from <1% of pixels, then it is considered to be noise-dominated and hence unusable.
| Quadrant | # 1 sec bins | Bins with >0 counts | Bins with >2000 counts | High rate bins dominated by noise | Noise dominated (total time) | Noise dominated (detector-on time) | Marked lightcurve |
|---|---|---|---|---|---|---|---|
| A | 2547 | 2547 | 20 | 20 | 0.79% | 0.79% | 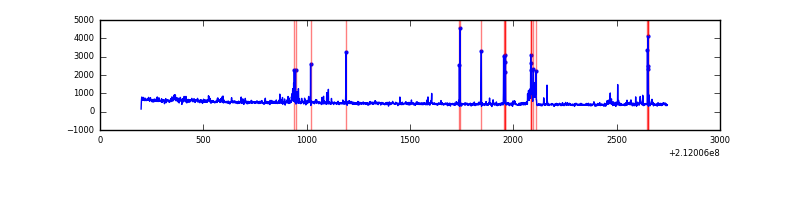 |
| B | 2547 | 2547 | 12 | 12 | 0.47% | 0.47% | 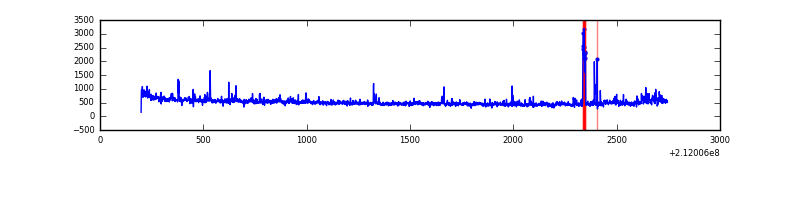 |
| C | 2547 | 2547 | 0 | 0 | 0.00% | 0.00% | 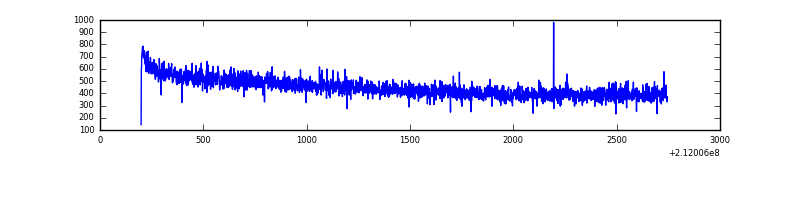 |
| D | 2547 | 2547 | 933 | 933 | 36.63% | 36.63% |  |
Top three noisy pixels from each quadrant. If the there are fewer than three noisy pixels in the level2.evt file, extra rows are filled as -1
| Pixel properties | Quadrant properties | ||||||
|---|---|---|---|---|---|---|---|
| Quadrant | DetID | PixID | Counts | Sigma | Mean | Median | Sigma |
| A | 13 | 251 | 98299 | 1572.88 | 295 | 289 | 62.3 |
| A | 0 | 50 | 69230 | 1106.38 | 295 | 289 | 62.3 |
| A | 12 | 194 | 2946 | 42.64 | 295 | 289 | 62.3 |
| B | 4 | 48 | 62062 | 1036.55 | 304 | 298 | 59.6 |
| B | 10 | 16 | 45584 | 760.01 | 304 | 298 | 59.6 |
| B | 15 | 204 | 24576 | 407.44 | 304 | 298 | 59.6 |
| C | 14 | 67 | 3269 | 43.93 | 288 | 290 | 67.8 |
| C | 13 | 61 | 2359 | 30.51 | 288 | 290 | 67.8 |
| C | 1 | 16 | 1873 | 23.34 | 288 | 290 | 67.8 |
| D | 11 | 145 | 2734007 | 50768.27 | 215 | 209 | 53.8 |
| D | 2 | 33 | 229041 | 4249.55 | 215 | 209 | 53.8 |
| D | 8 | 195 | 66717 | 1235.09 | 215 | 209 | 53.8 |
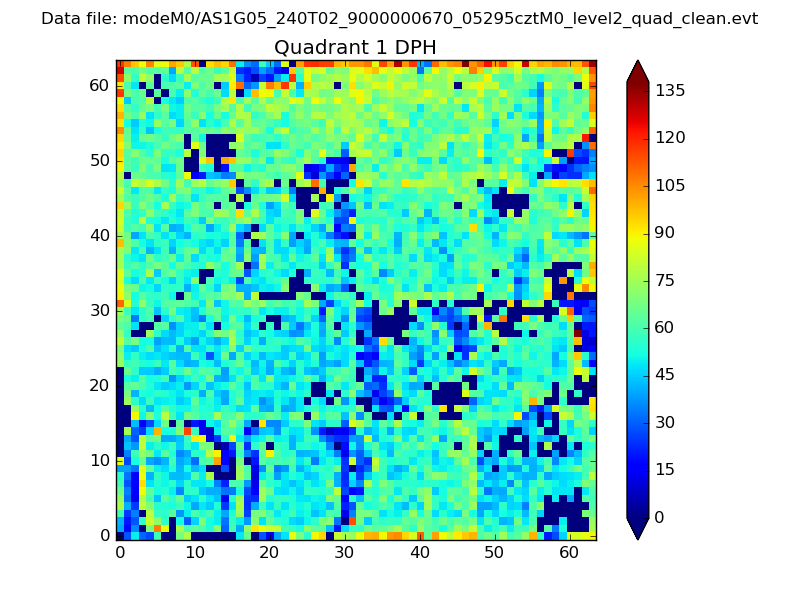
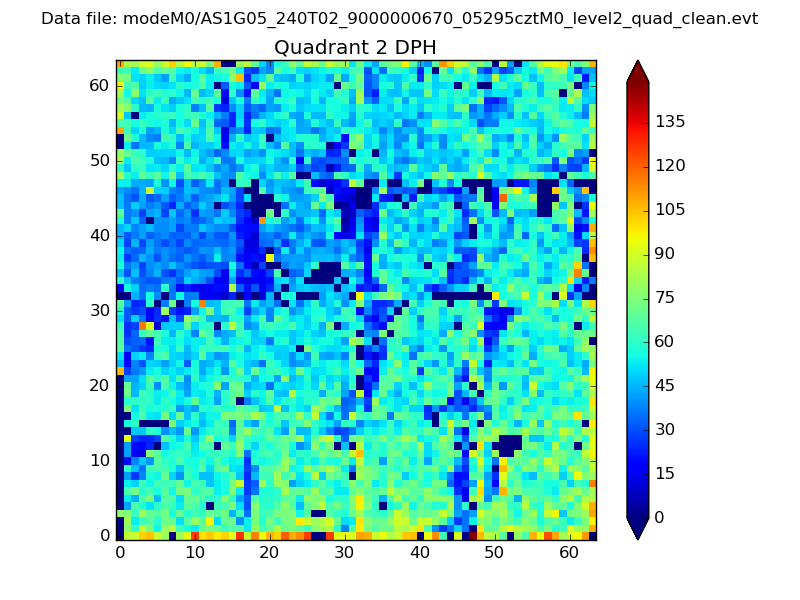
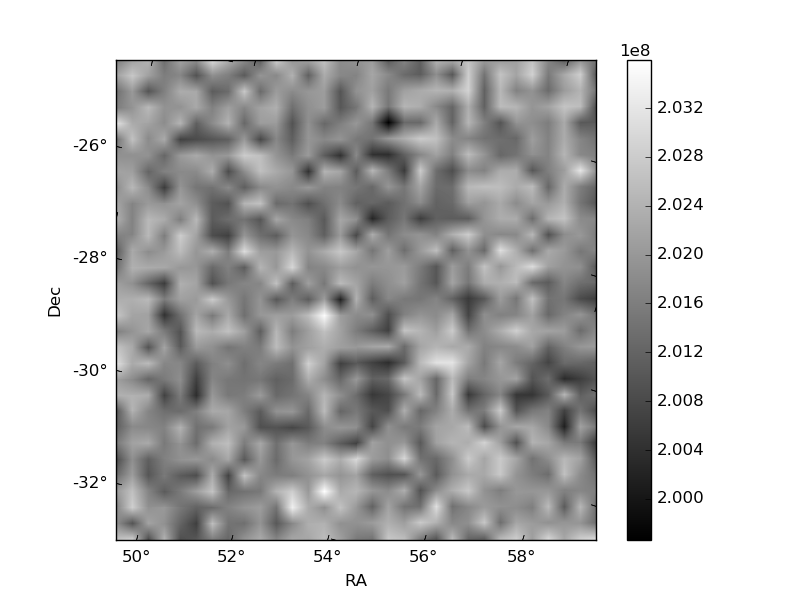
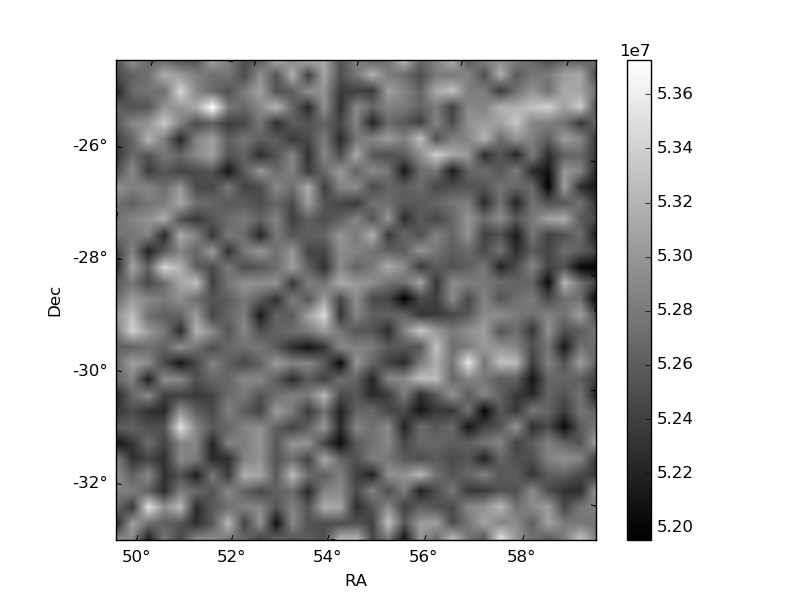
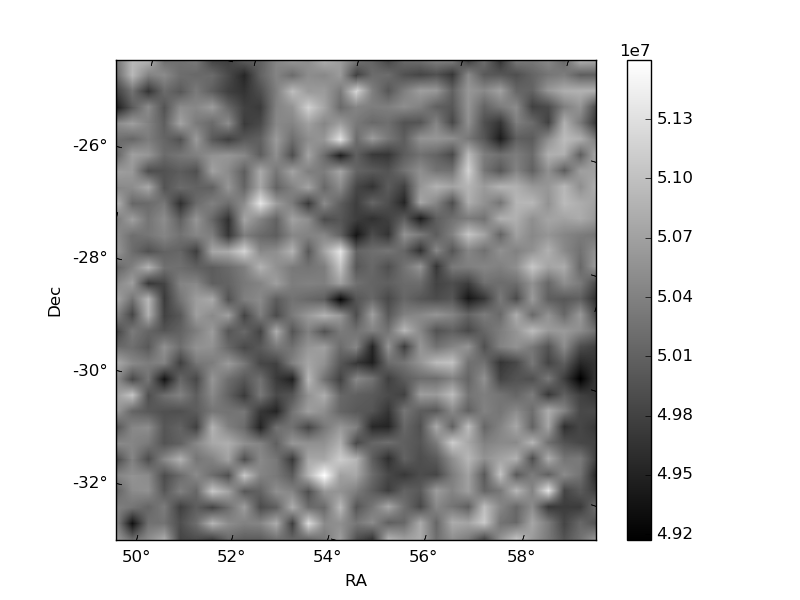
Histogram calculated using DETX and DETY for each event in the final _common_clean file
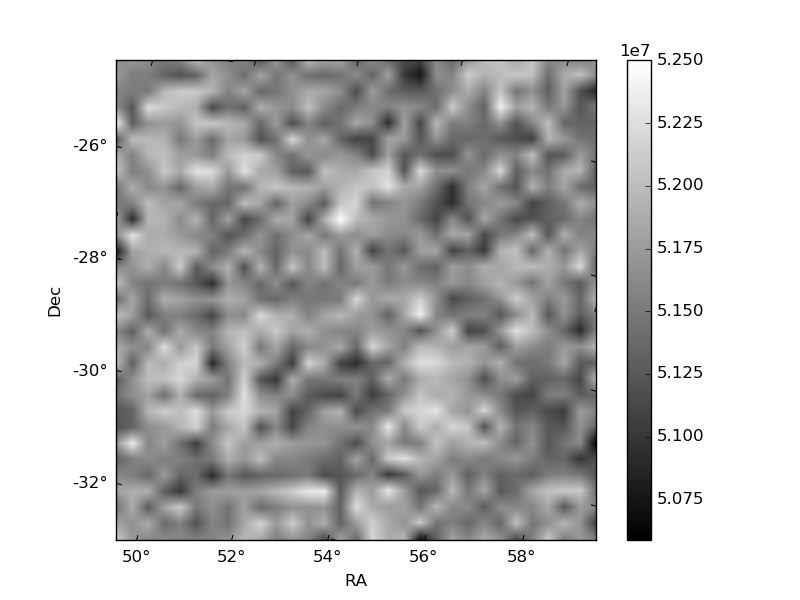
| Quadrant A | 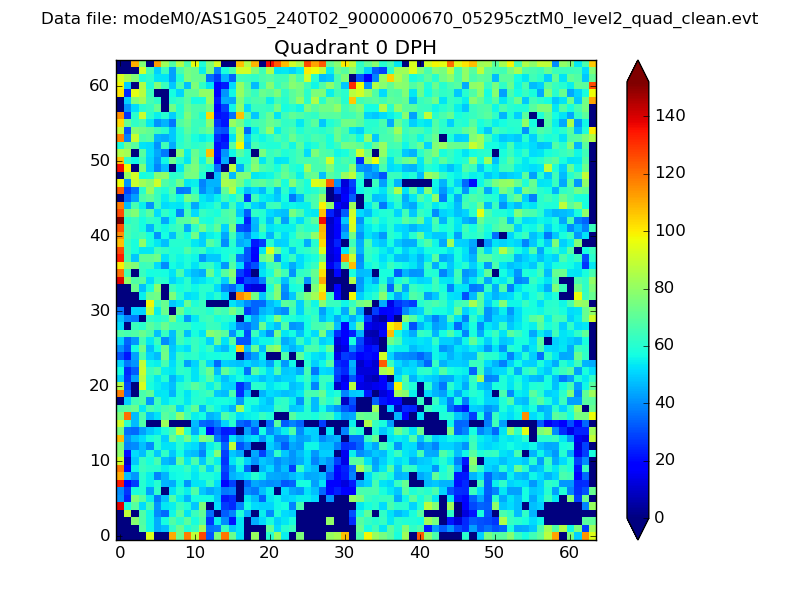 |
 |
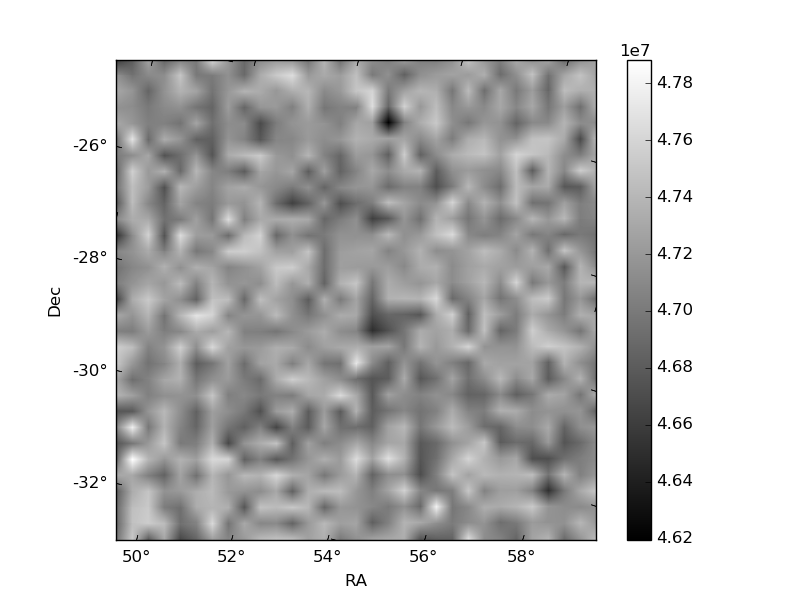
Quadrant B |
|---|---|---|---|
| Quadrant D | 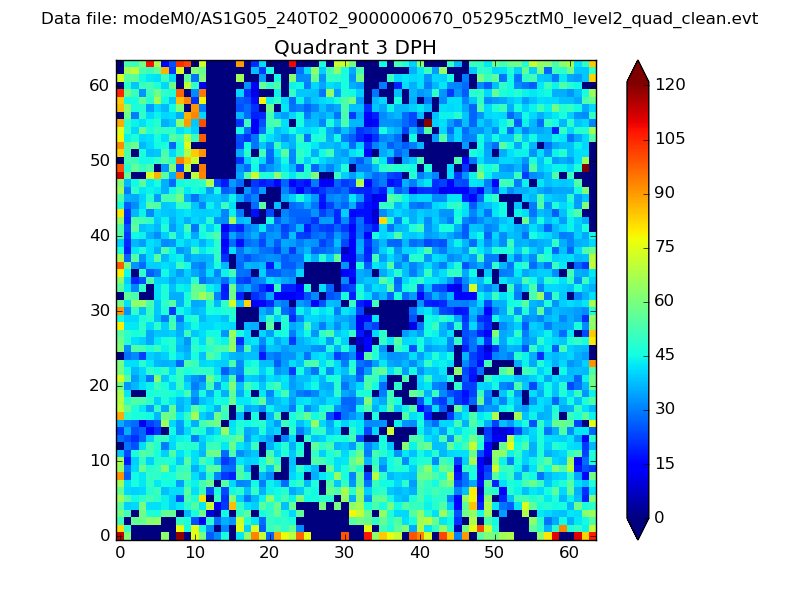 |
 |
Quadrant C |
| Plot type | Count rate plots | Images |
|---|---|---|
| Comparison with Poisson distribution Blue bars denote a histogram of data divided into 1 sec bins. Red curve is a Poisson curve with rate = median count rate of data. |
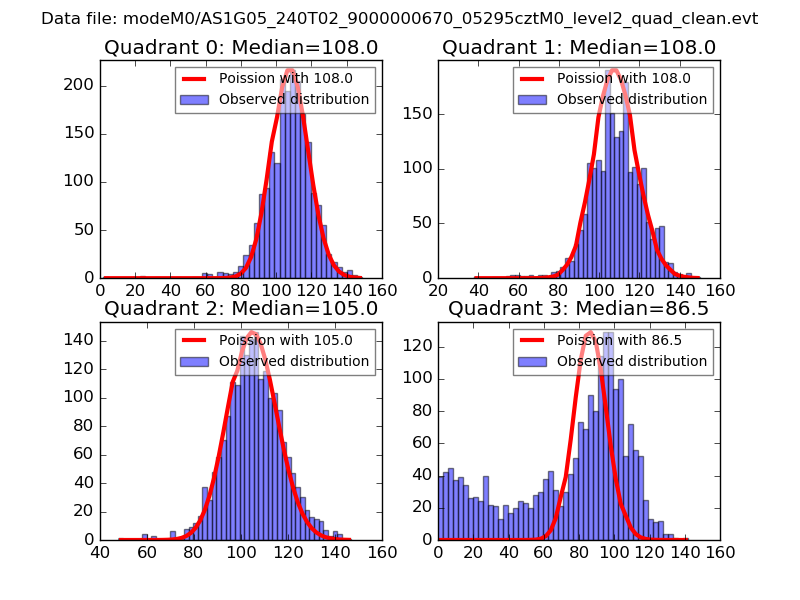 |
 |
| Quadrant-wise count rates Data is divided into 100 sec bins |
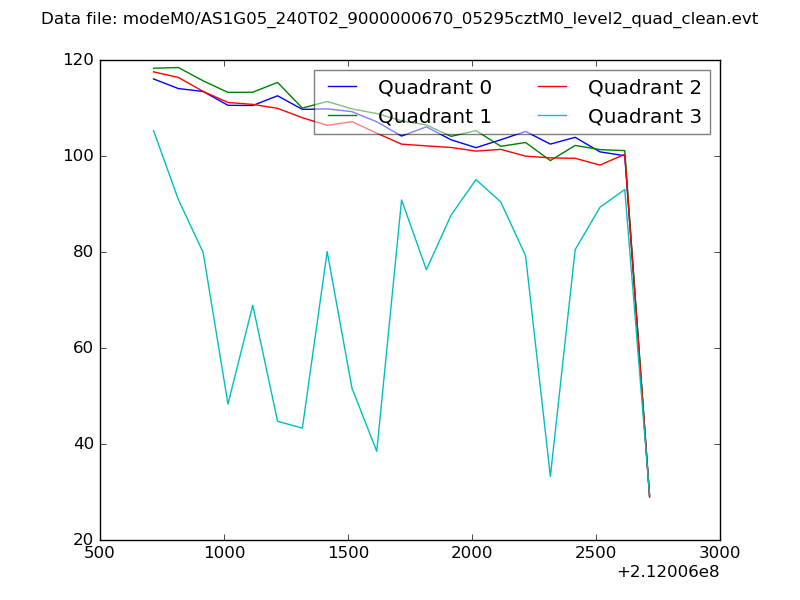 |
|
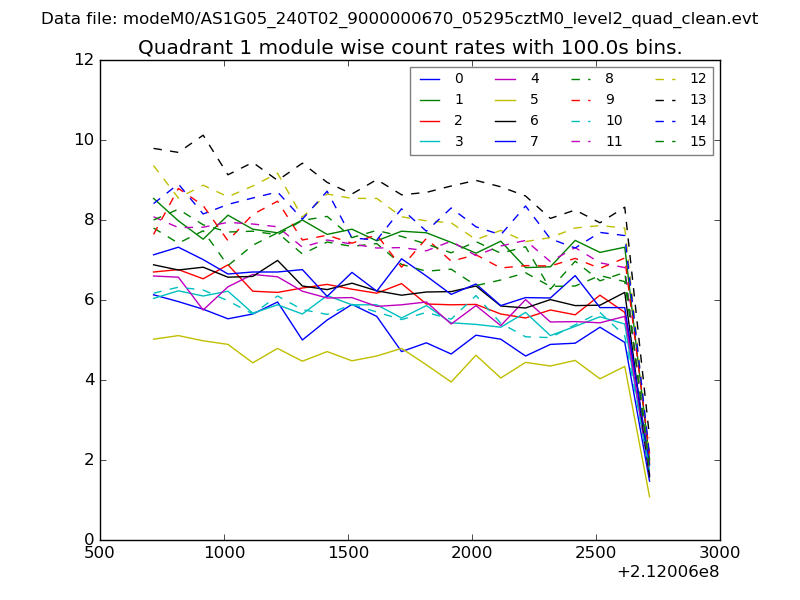
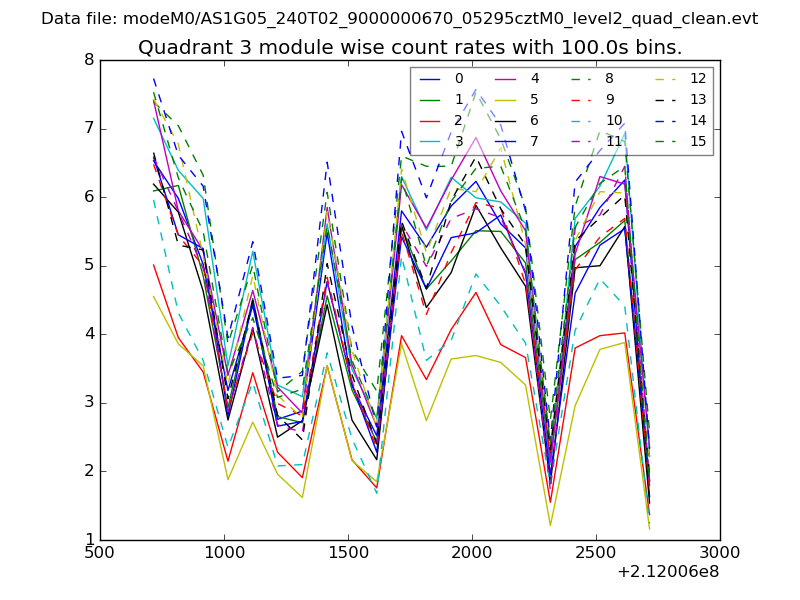
| Module-wise count rates for Quadrant A Data is divided into 100 sec bins |
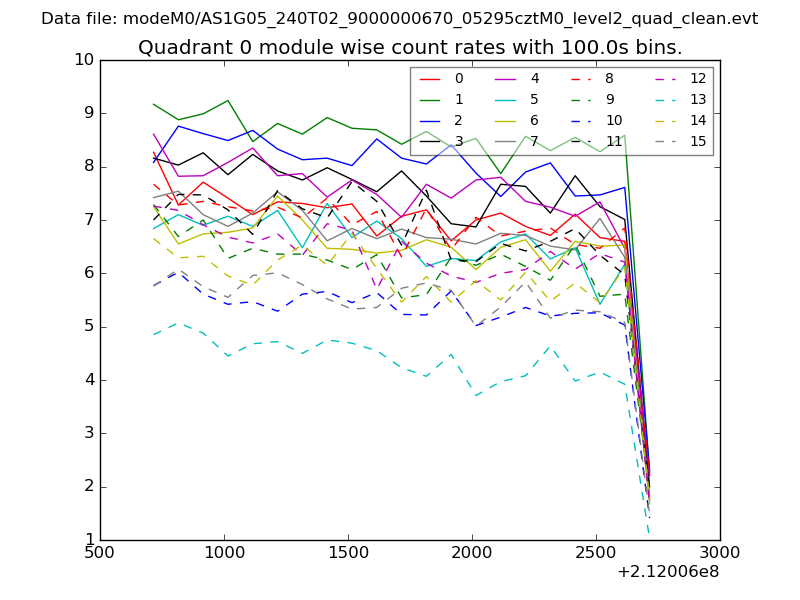 |
 |
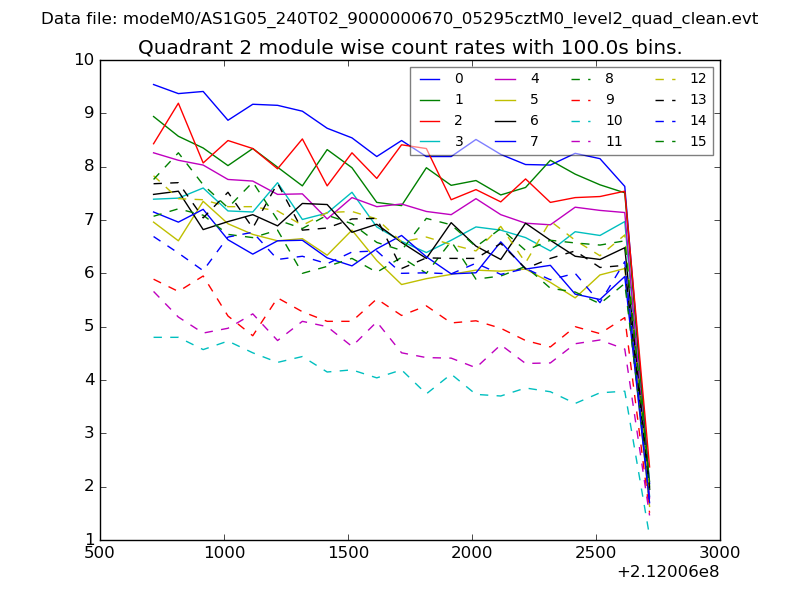
| Module-wise count rates for Quadrant B Data is divided into 100 sec bins |
 |
 |
| Module-wise count rates for Quadrant C Data is divided into 100 sec bins |
 |
 |
| Module-wise count rates for Quadrant D Data is divided into 100 sec bins |
 |
 |
| Parameter | Plot |
|---|---|
| CZT HV Monitor | 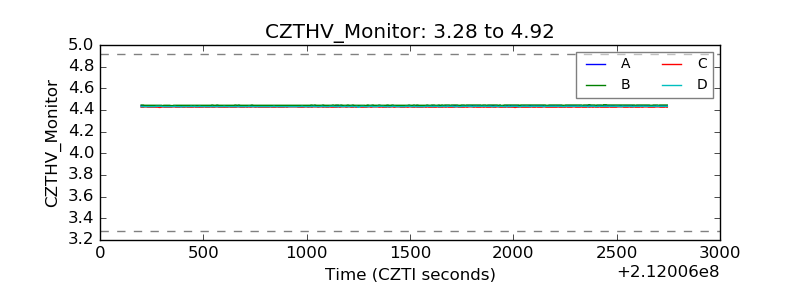 |
| D_VDD | 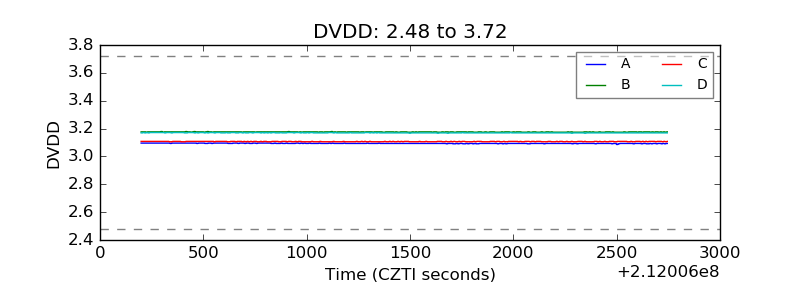 |
| Temperature 1 | 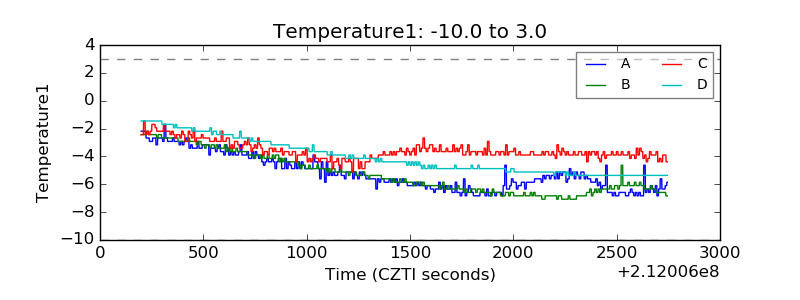 |
| Veto HV Monitor | 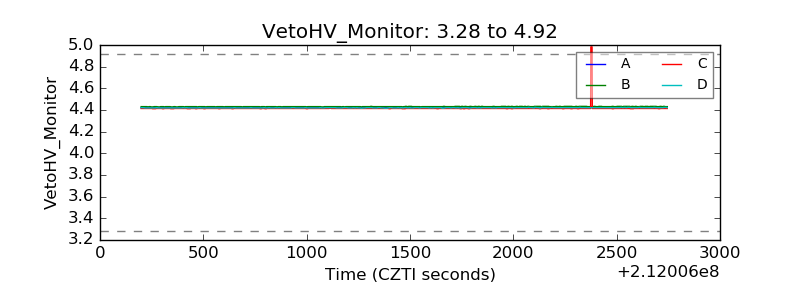 |
| Veto LLD | 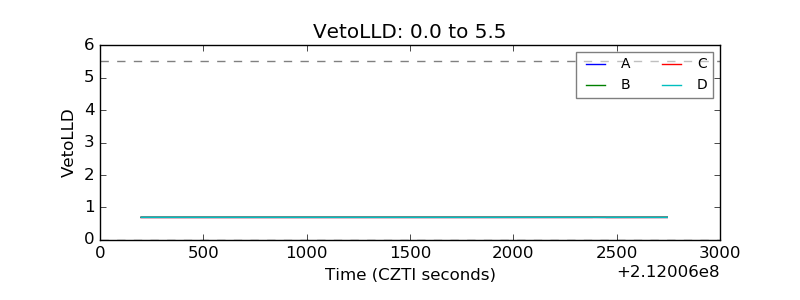 |
| Alpha Counter | 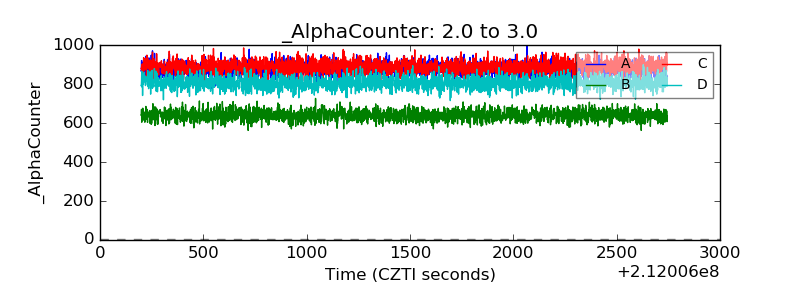 |
| _CPM_Rate | 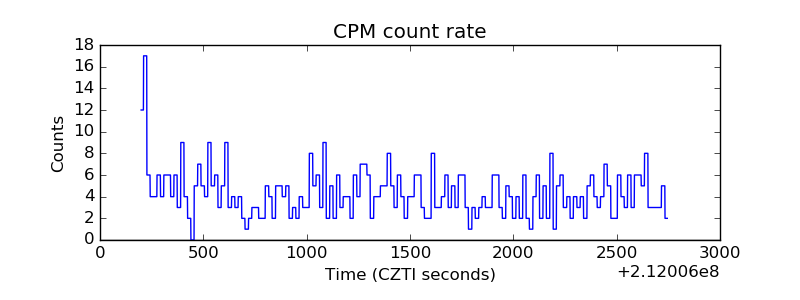 |
| CZT Counter | 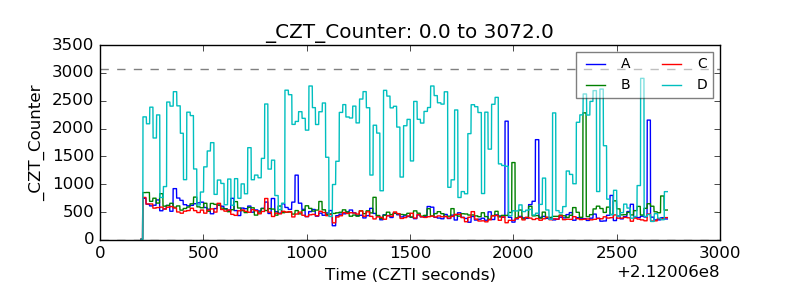 |
| +2.5 Volts monitor |  |
| +5 Volts monitor |  |
| _ROLL_ROT | 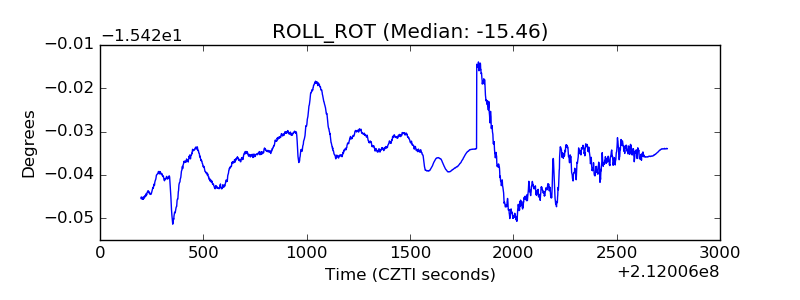 |
| _Roll_DEC | 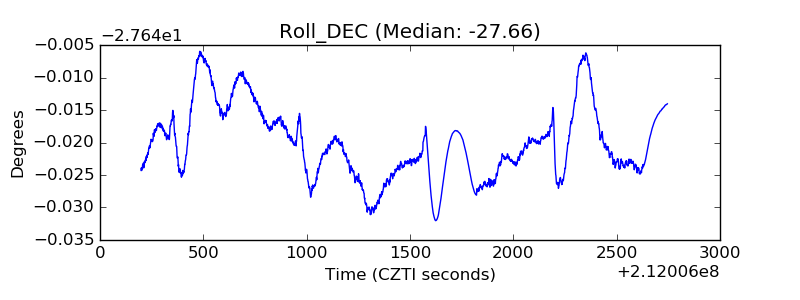 |
| _Roll_RA | 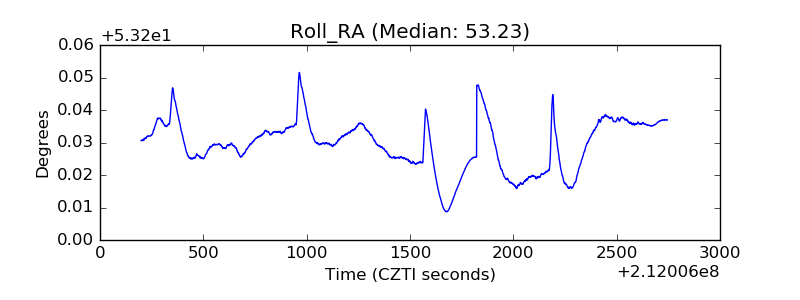 |
| Veto Counter | 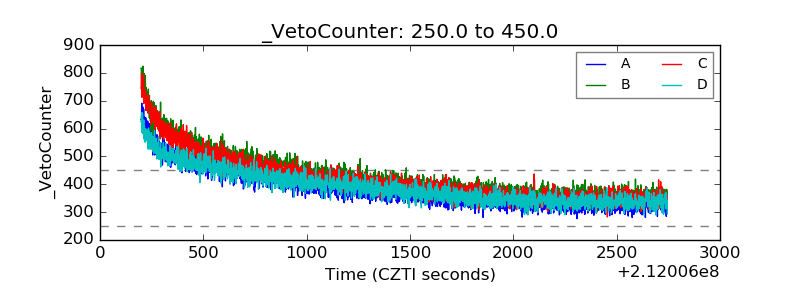 |