| Param | Original file | Final file |
|---|---|---|
| Filename | modeM0/AS1G05_212T01_9000000672_05296cztM0_level2.evt | modeM0/AS1G05_212T01_9000000672_05296cztM0_level2_quad_clean.evt |
| Size (bytes) | 621,766,080 | 103,726,080 |
| Size | 593.0 MB | 98.9 MB |
| Events in quadrant A | 4,703,451 | 688,593 |
| Events in quadrant B | 3,339,195 | 728,580 |
| Events in quadrant C | 2,870,227 | 723,458 |
| Events in quadrant D | 7,487,762 | 557,421 |
| Mode M9 | |||
|---|---|---|---|
| Quadrant | BADHDUFLAG | Total packets | Discarded packets |
| A | 0 | 14 | 0 |
| B | 0 | 14 | 0 |
| C | 0 | 14 | 0 |
| D | 0 | 15 | 0 |
| Mode M0 | |||
|---|---|---|---|
| Quadrant | BADHDUFLAG | Total packets | Discarded packets |
| A | 0 | 18186 | 3 |
| B | 0 | 14187 | 2 |
| C | 0 | 12940 | 2 |
| D | 0 | 26647 | 2 |
| Mode SS | |||
|---|---|---|---|
| Quadrant | BADHDUFLAG | Total packets | Discarded packets |
| A | 0 | 130 | 0 |
| B | 0 | 130 | 0 |
| C | 0 | 130 | 0 |
| D | 0 | 130 | 0 |
| Quadrant | Total seconds | Saturated seconds | Saturation percentage |
|---|---|---|---|
| A | 6334 | 535 | 8.446479% |
| B | 6334 | 87 | 1.373540% |
| C | 6334 | 5 | 0.078939% |
| D | 6334 | 1636 | 25.828860% |
Noise dominated data is calculated using 1-second bins in cleaned event files. If a bin has >2000 counts, and if more than 50% of those come from <1% of pixels, then it is considered to be noise-dominated and hence unusable.
| Quadrant | # 1 sec bins | Bins with >0 counts | Bins with >2000 counts | High rate bins dominated by noise | Noise dominated (total time) | Noise dominated (detector-on time) | Marked lightcurve |
|---|---|---|---|---|---|---|---|
| A | 7644 | 6335 | 523 | 523 | 6.84% | 8.26% | 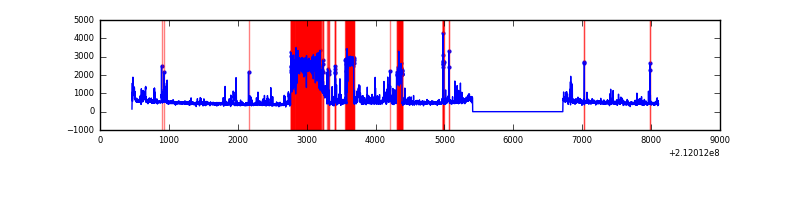 |
| B | 7644 | 6335 | 33 | 33 | 0.43% | 0.52% | 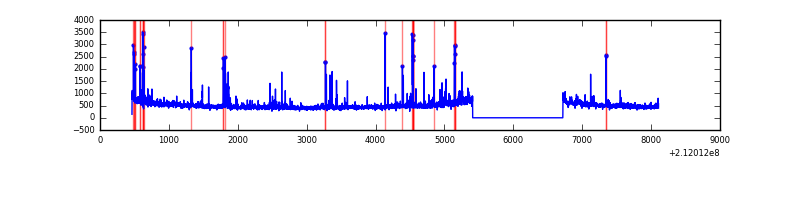 |
| C | 7644 | 6335 | 0 | 0 | 0.00% | 0.00% | 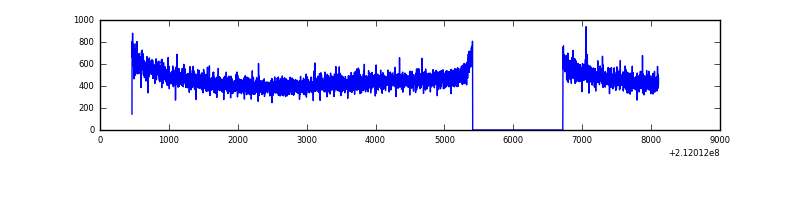 |
| D | 7644 | 6335 | 1366 | 1366 | 17.87% | 21.56% | 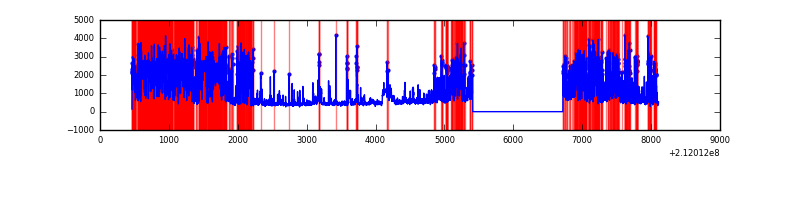 |
Top three noisy pixels from each quadrant. If the there are fewer than three noisy pixels in the level2.evt file, extra rows are filled as -1
| Pixel properties | Quadrant properties | ||||||
|---|---|---|---|---|---|---|---|
| Quadrant | DetID | PixID | Counts | Sigma | Mean | Median | Sigma |
| A | 0 | 50 | 1617653 | 11063.14 | 720 | 704 | 146.2 |
| A | 13 | 251 | 317095 | 2164.74 | 720 | 704 | 146.2 |
| A | 12 | 194 | 7200 | 44.45 | 720 | 704 | 146.2 |
| B | 10 | 16 | 199712 | 1405.67 | 756 | 738 | 141.6 |
| B | 4 | 48 | 141779 | 996.4 | 756 | 738 | 141.6 |
| B | 15 | 54 | 25391 | 174.16 | 756 | 738 | 141.6 |
| C | 1 | 16 | 14264 | 82.1 | 728 | 732 | 164.8 |
| C | 14 | 67 | 7494 | 41.02 | 728 | 732 | 164.8 |
| C | 13 | 61 | 5997 | 31.94 | 728 | 732 | 164.8 |
| D | 11 | 145 | 3970660 | 27019.48 | 605 | 587 | 146.9 |
| D | 2 | 33 | 814464 | 5539.08 | 605 | 587 | 146.9 |
| D | 8 | 195 | 154354 | 1046.51 | 605 | 587 | 146.9 |
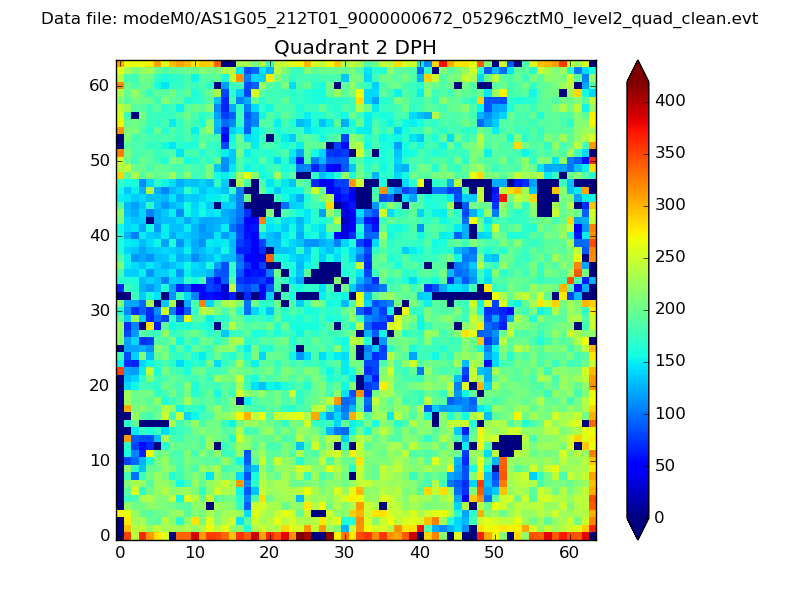
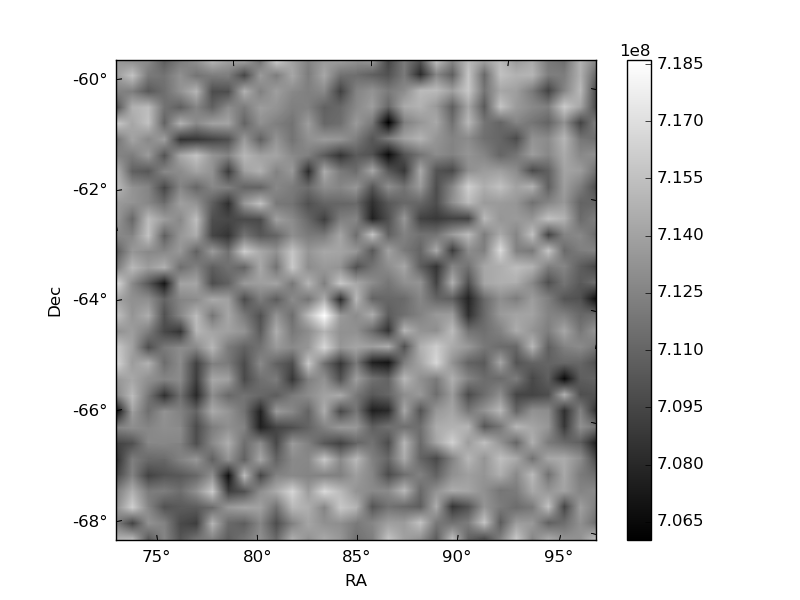
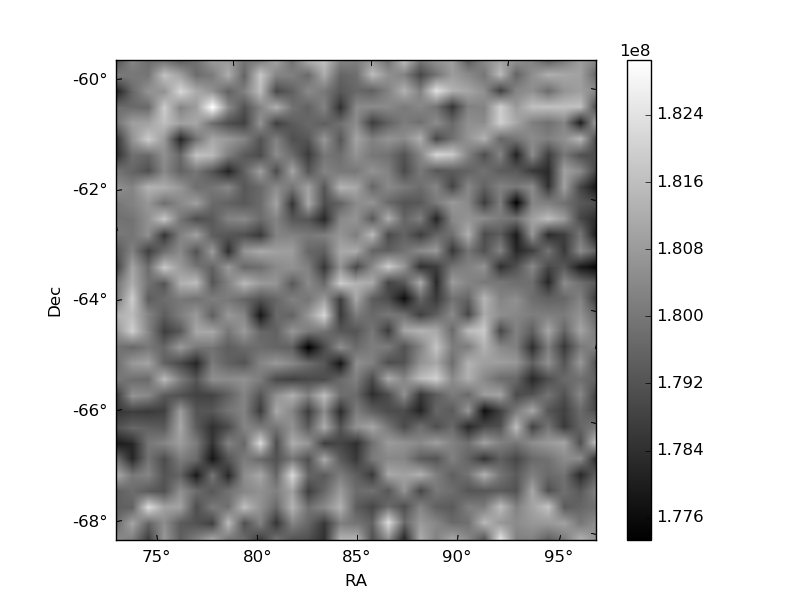
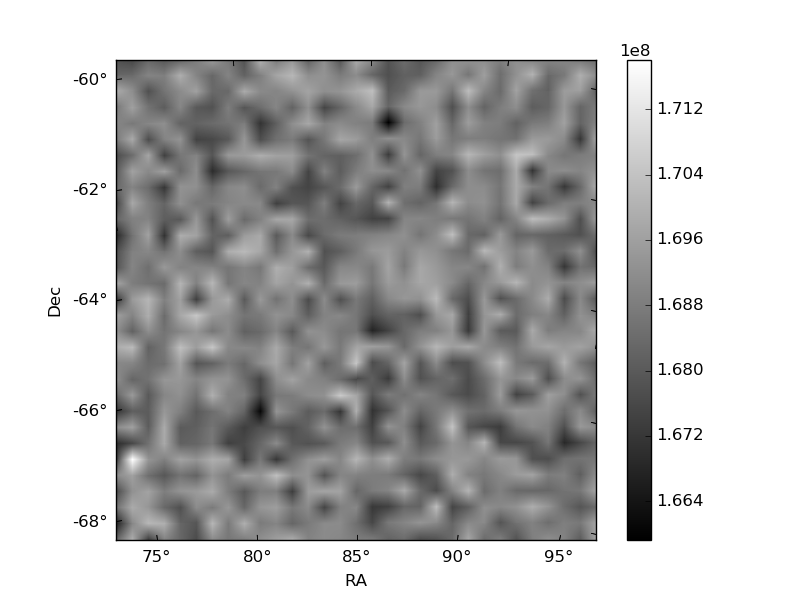
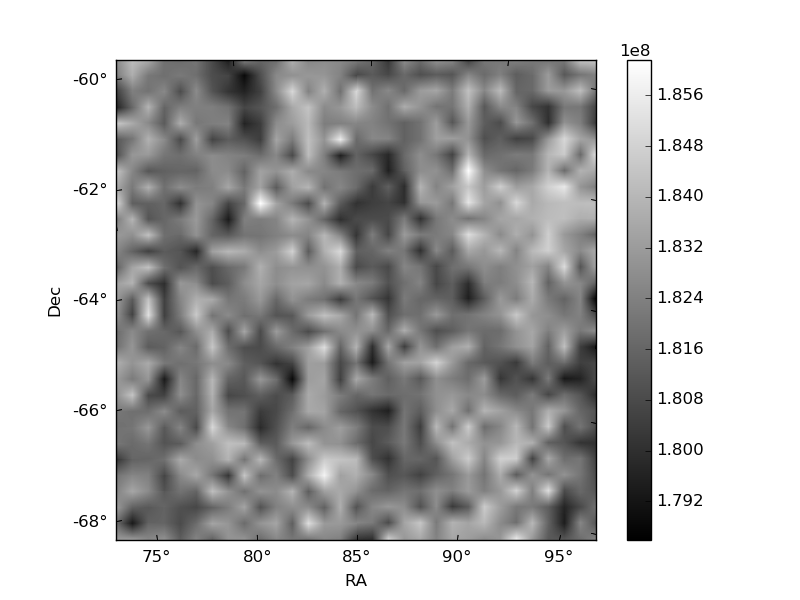
Histogram calculated using DETX and DETY for each event in the final _common_clean file
| Quadrant A | 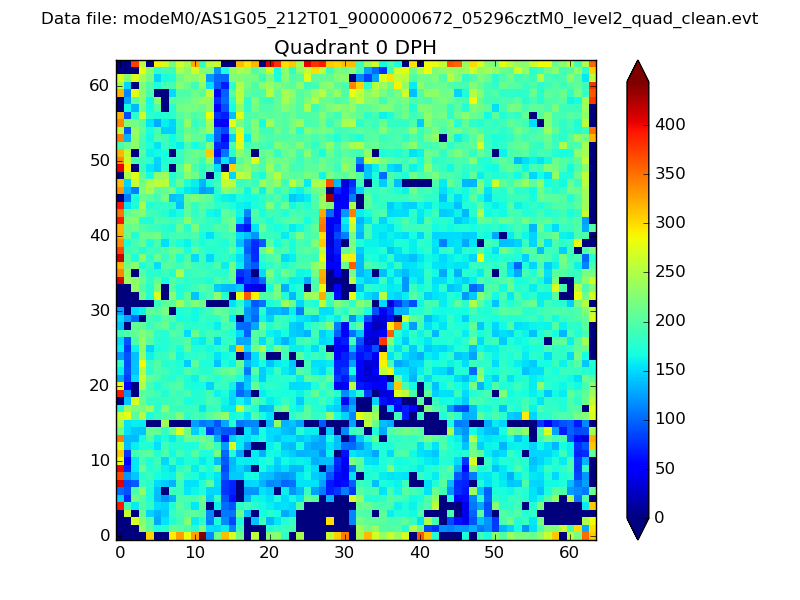 |
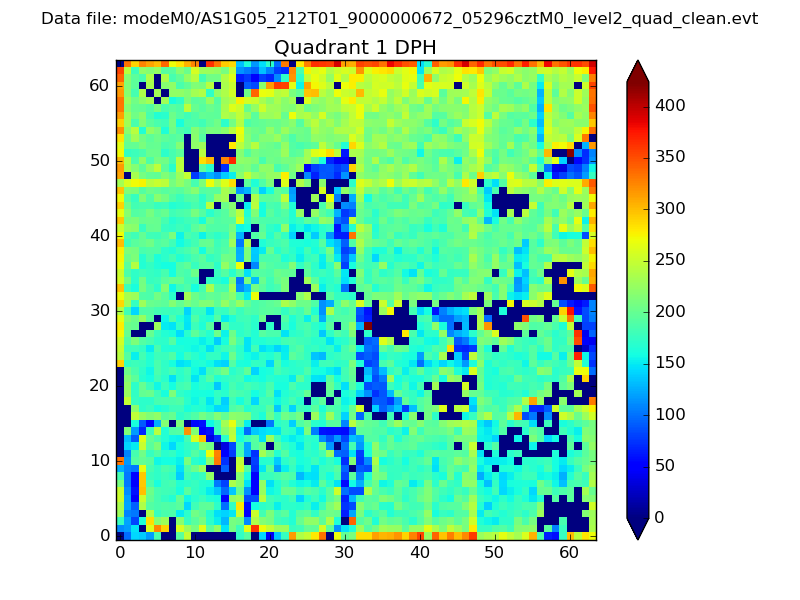 |
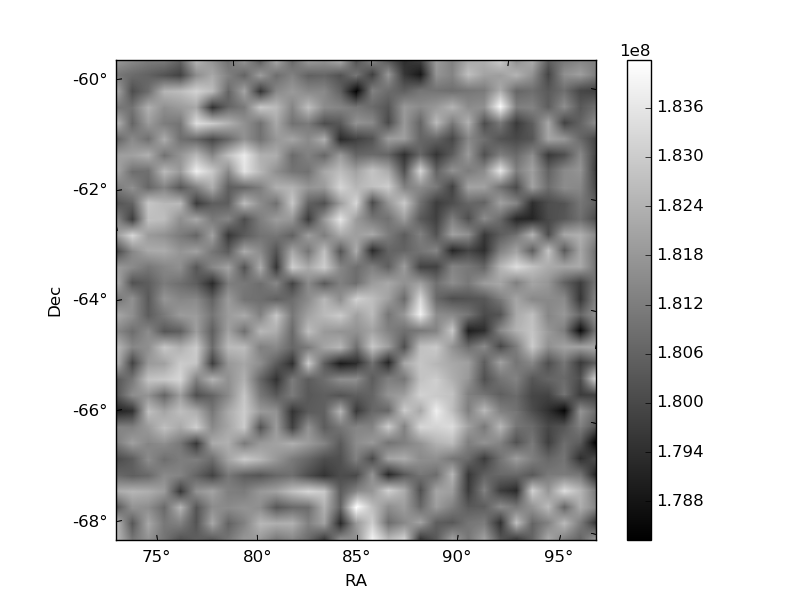
Quadrant B |
|---|---|---|---|
| Quadrant D | 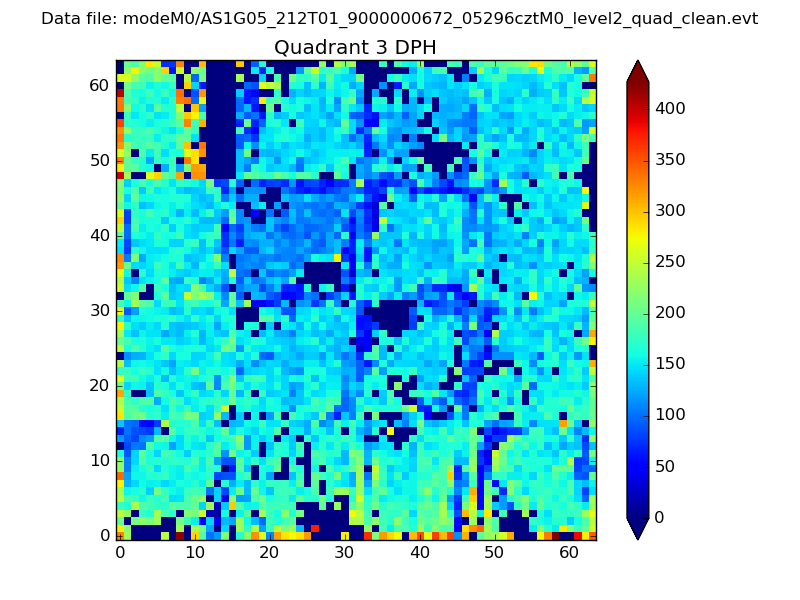 |
 |
Quadrant C |
| Plot type | Count rate plots | Images |
|---|---|---|
| Comparison with Poisson distribution Blue bars denote a histogram of data divided into 1 sec bins. Red curve is a Poisson curve with rate = median count rate of data. |
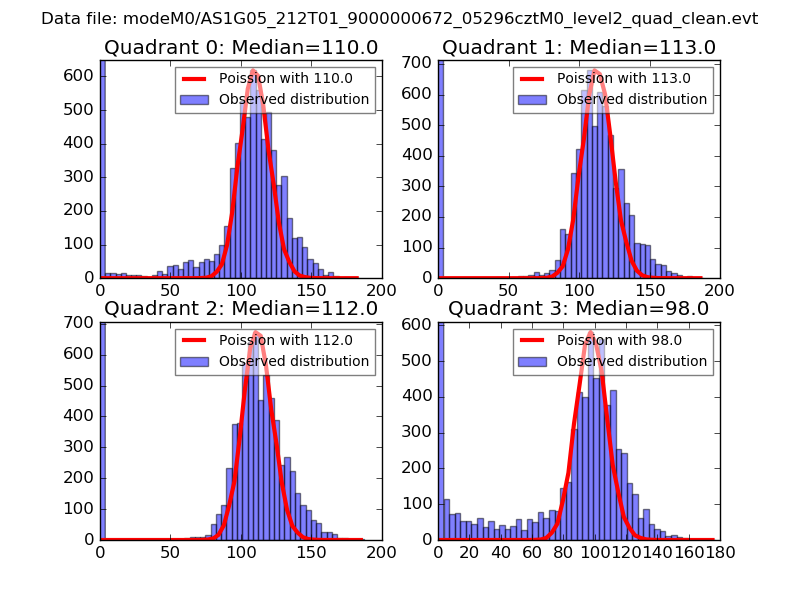 |
 |
| Quadrant-wise count rates Data is divided into 100 sec bins |
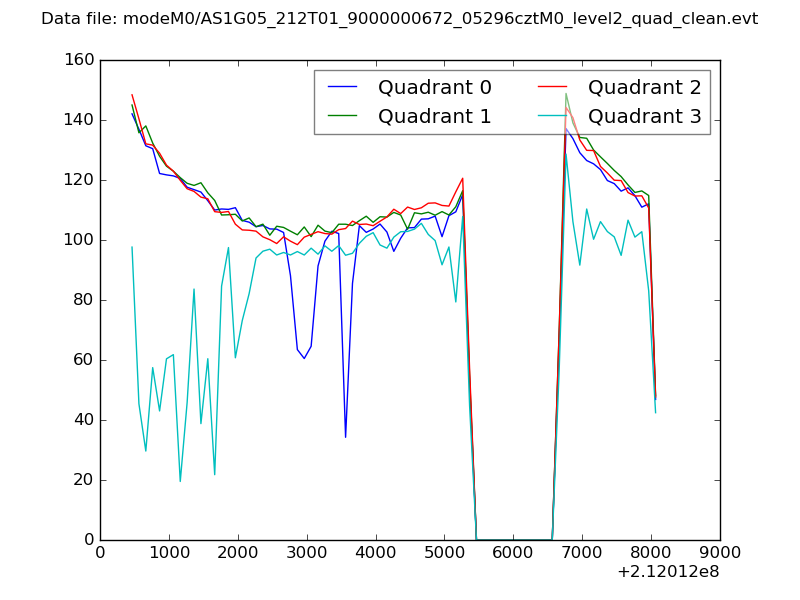 |
|
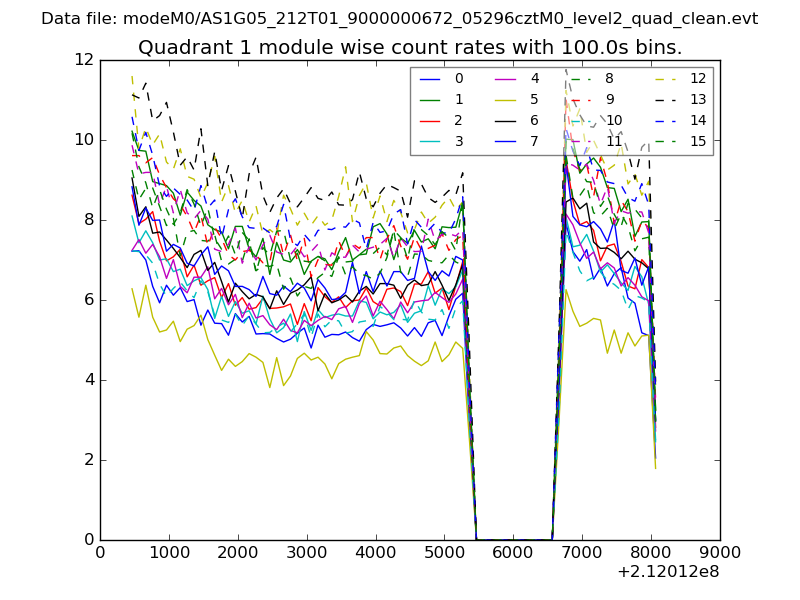
| Module-wise count rates for Quadrant A Data is divided into 100 sec bins |
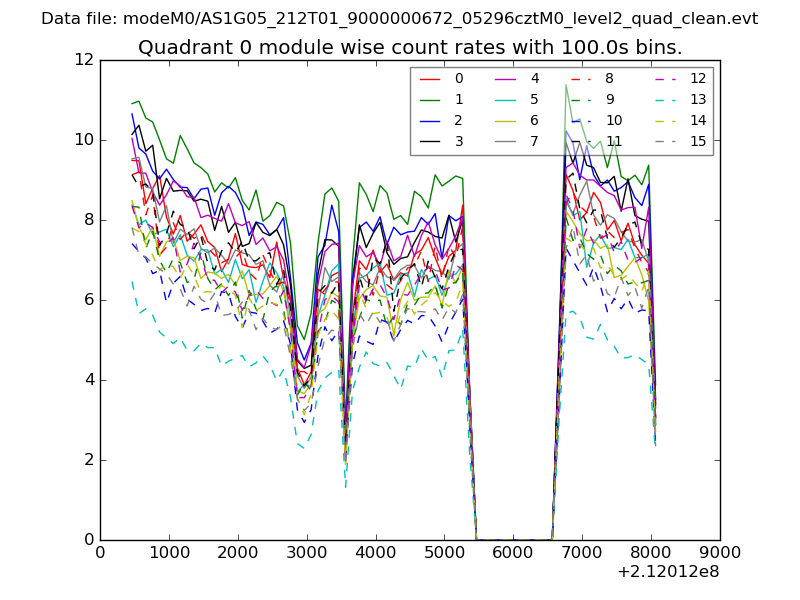 |
 |
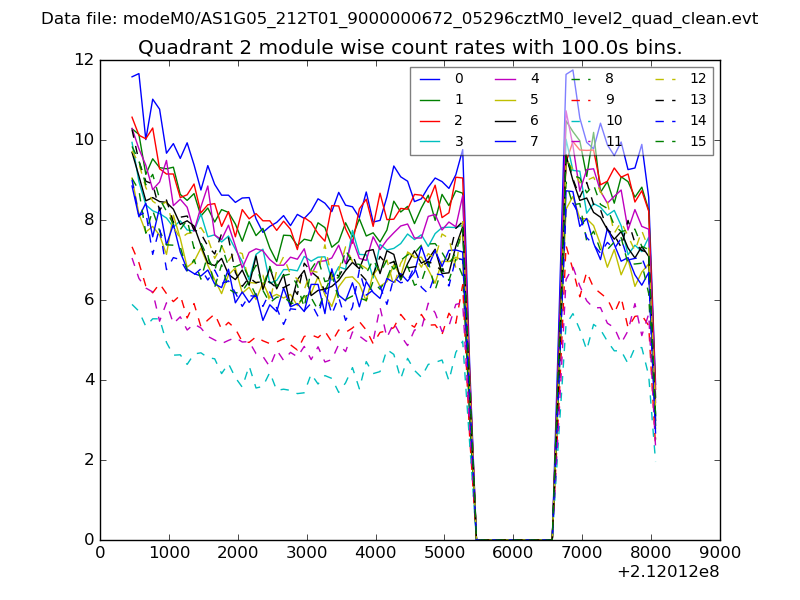
| Module-wise count rates for Quadrant B Data is divided into 100 sec bins |
 |
 |
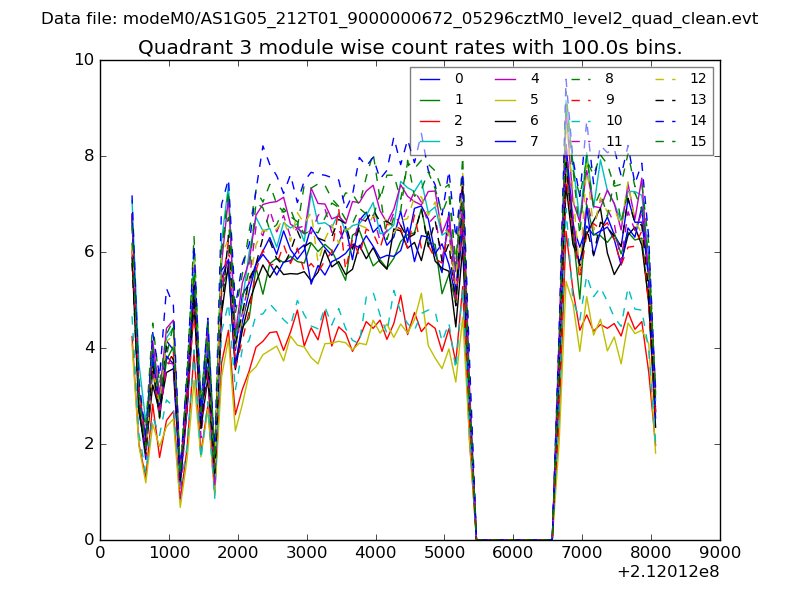
| Module-wise count rates for Quadrant C Data is divided into 100 sec bins |
 |
 |
| Module-wise count rates for Quadrant D Data is divided into 100 sec bins |
 |
 |
| Parameter | Plot |
|---|---|
| CZT HV Monitor |  |
| D_VDD | 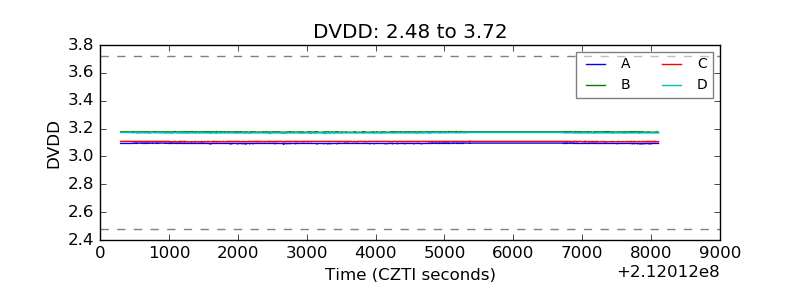 |
| Temperature 1 | 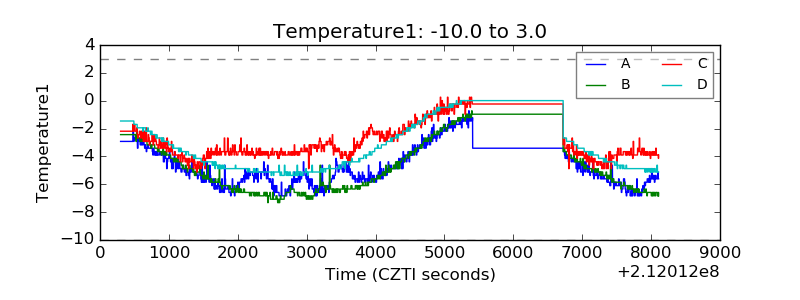 |
| Veto HV Monitor | 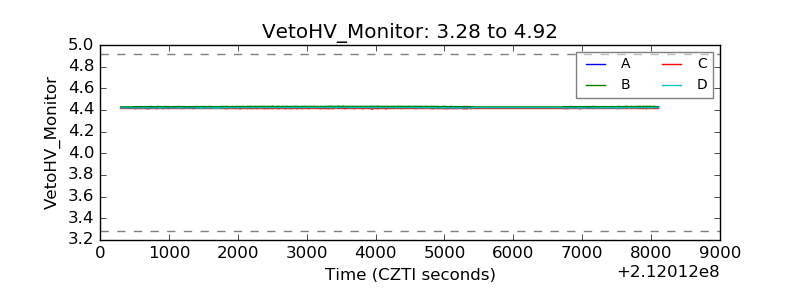 |
| Veto LLD |  |
| Alpha Counter | 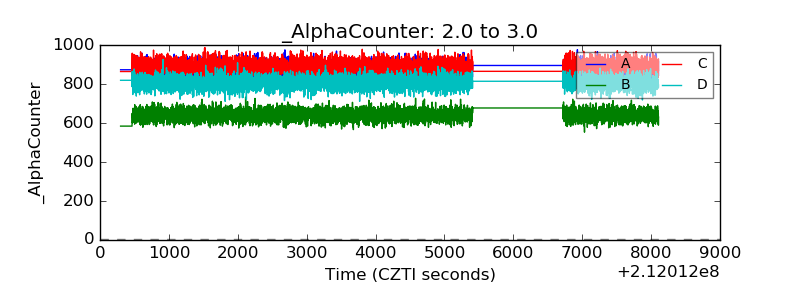 |
| _CPM_Rate | 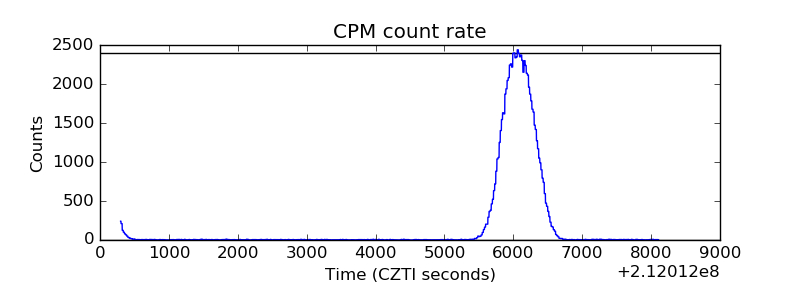 |
| CZT Counter | 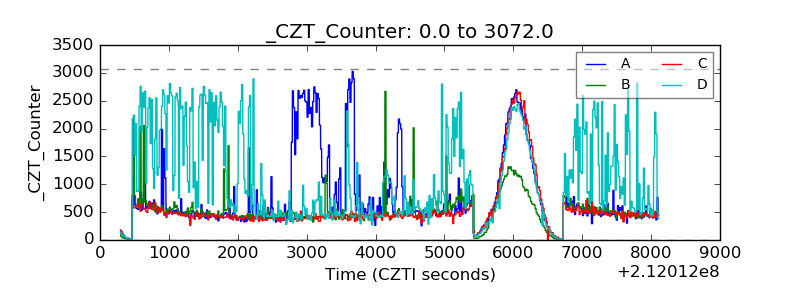 |
| +2.5 Volts monitor |  |
| +5 Volts monitor |  |
| _ROLL_ROT | 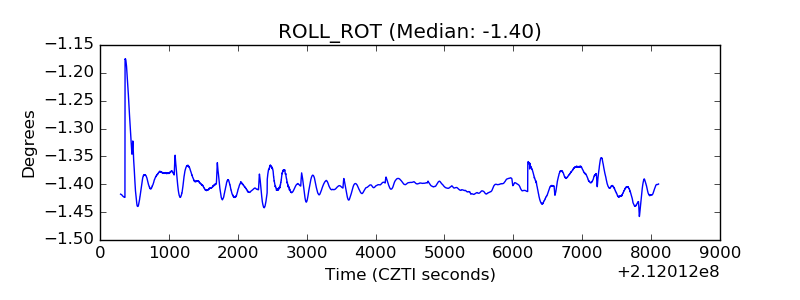 |
| _Roll_DEC | 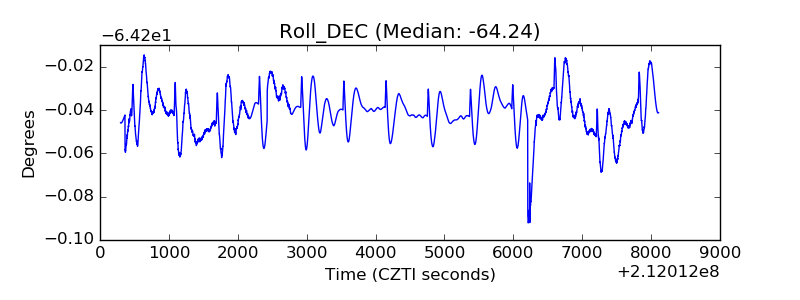 |
| _Roll_RA | 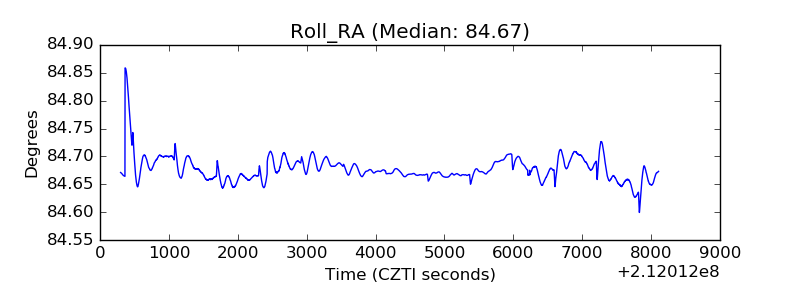 |
| Veto Counter | 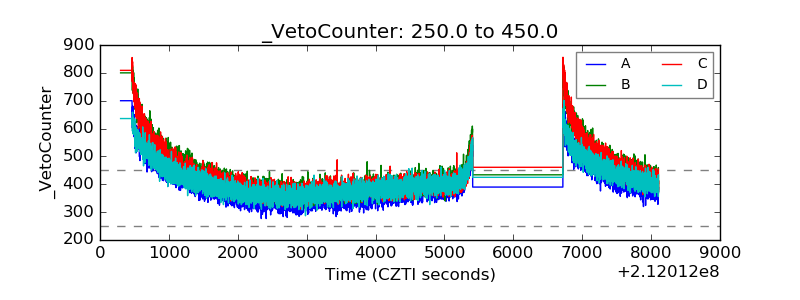 |