| Param | Original file | Final file |
|---|---|---|
| Filename | modeM0/AS1G05_212T01_9000000672_05297cztM0_level2.evt | modeM0/AS1G05_212T01_9000000672_05297cztM0_level2_quad_clean.evt |
| Size (bytes) | 524,162,880 | 106,214,400 |
| Size | 499.9 MB | 101.3 MB |
| Events in quadrant A | 3,139,667 | 703,945 |
| Events in quadrant B | 3,167,973 | 723,666 |
| Events in quadrant C | 2,857,696 | 720,380 |
| Events in quadrant D | 6,282,104 | 629,276 |
| Mode M9 | |||
|---|---|---|---|
| Quadrant | BADHDUFLAG | Total packets | Discarded packets |
| A | 0 | 18 | 0 |
| B | 0 | 18 | 0 |
| C | 0 | 18 | 0 |
| D | 0 | 19 | 0 |
| Mode M0 | |||
|---|---|---|---|
| Quadrant | BADHDUFLAG | Total packets | Discarded packets |
| A | 0 | 13518 | 3 |
| B | 0 | 13503 | 2 |
| C | 0 | 12807 | 2 |
| D | 0 | 23108 | 2 |
| Mode SS | |||
|---|---|---|---|
| Quadrant | BADHDUFLAG | Total packets | Discarded packets |
| A | 0 | 128 | 0 |
| B | 0 | 128 | 0 |
| C | 0 | 128 | 0 |
| D | 0 | 128 | 0 |
| Quadrant | Total seconds | Saturated seconds | Saturation percentage |
|---|---|---|---|
| A | 6290 | 30 | 0.476948% |
| B | 6290 | 40 | 0.635930% |
| C | 6290 | 7 | 0.111288% |
| D | 6290 | 877 | 13.942766% |
Noise dominated data is calculated using 1-second bins in cleaned event files. If a bin has >2000 counts, and if more than 50% of those come from <1% of pixels, then it is considered to be noise-dominated and hence unusable.
| Quadrant | # 1 sec bins | Bins with >0 counts | Bins with >2000 counts | High rate bins dominated by noise | Noise dominated (total time) | Noise dominated (detector-on time) | Marked lightcurve |
|---|---|---|---|---|---|---|---|
| A | 7620 | 6291 | 11 | 11 | 0.14% | 0.17% | 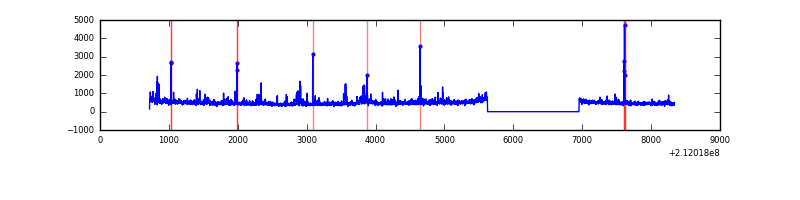 |
| B | 7620 | 6291 | 5 | 5 | 0.07% | 0.08% | 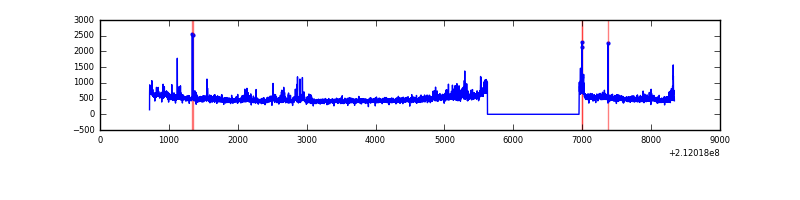 |
| C | 7620 | 6291 | 0 | 0 | 0.00% | 0.00% | 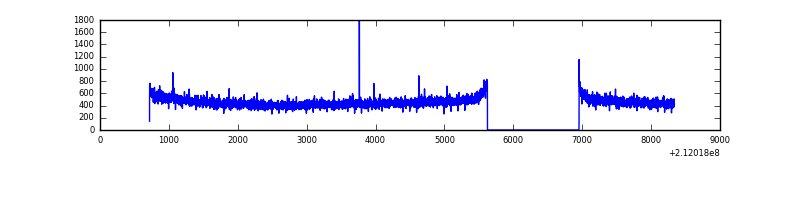 |
| D | 7620 | 6291 | 707 | 707 | 9.28% | 11.24% | 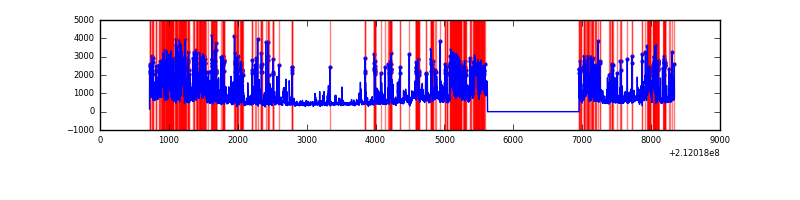 |
Top three noisy pixels from each quadrant. If the there are fewer than three noisy pixels in the level2.evt file, extra rows are filled as -1
| Pixel properties | Quadrant properties | ||||||
|---|---|---|---|---|---|---|---|
| Quadrant | DetID | PixID | Counts | Sigma | Mean | Median | Sigma |
| A | 13 | 251 | 259398 | 1752.4 | 732 | 715 | 147.6 |
| A | 0 | 50 | 63778 | 427.21 | 732 | 715 | 147.6 |
| A | 12 | 194 | 7292 | 44.55 | 732 | 715 | 147.6 |
| B | 4 | 48 | 194073 | 1370.12 | 753 | 732 | 141.1 |
| B | 15 | 204 | 25054 | 172.36 | 753 | 732 | 141.1 |
| B | 10 | 16 | 16814 | 113.97 | 753 | 732 | 141.1 |
| C | 13 | 61 | 5924 | 31.2 | 729 | 732 | 166.4 |
| C | 7 | 159 | 5796 | 30.43 | 729 | 732 | 166.4 |
| C | 12 | 4 | 2842 | 12.68 | 729 | 732 | 166.4 |
| D | 11 | 145 | 2462352 | 14972.65 | 676 | 655 | 164.4 |
| D | 2 | 33 | 778159 | 4728.97 | 676 | 655 | 164.4 |
| D | 8 | 195 | 159774 | 967.8 | 676 | 655 | 164.4 |
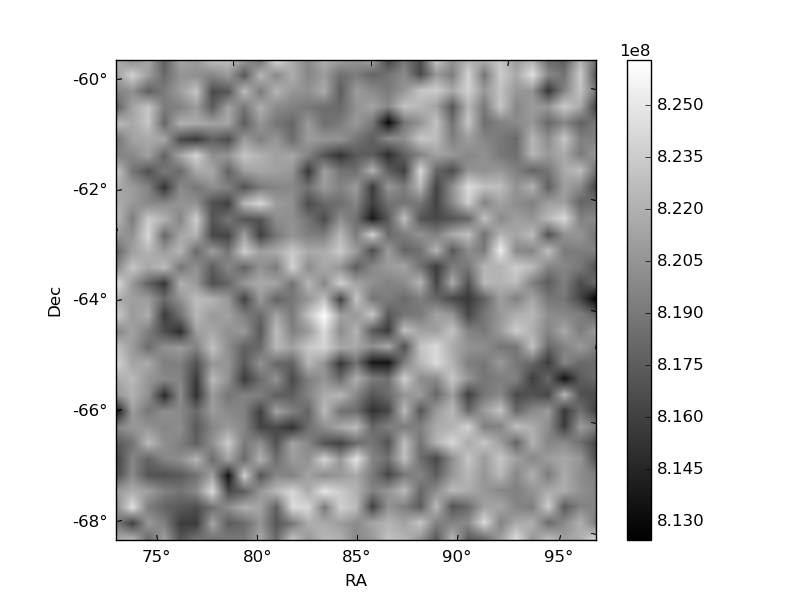
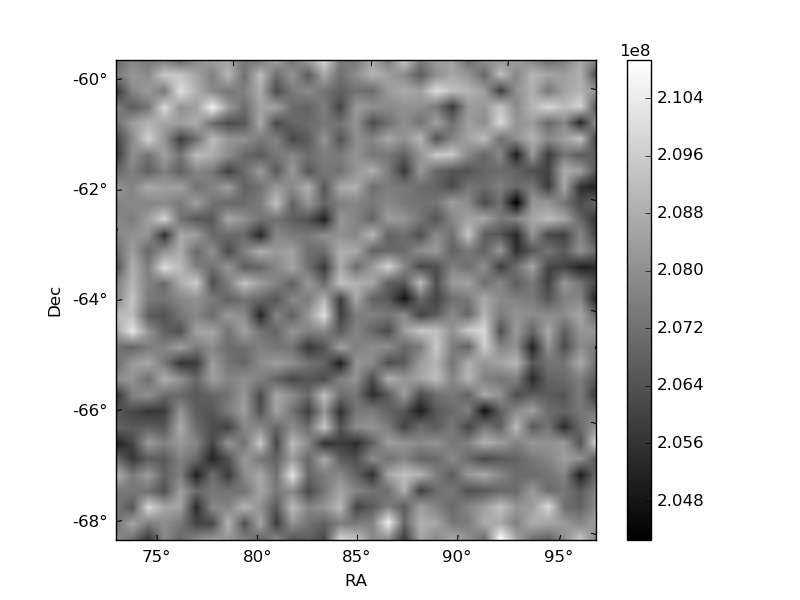
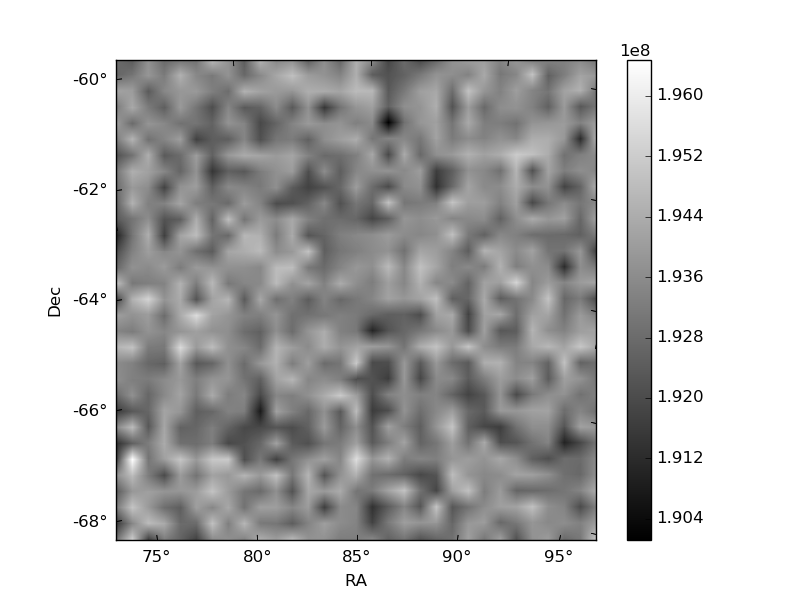
Histogram calculated using DETX and DETY for each event in the final _common_clean file
| Quadrant A | 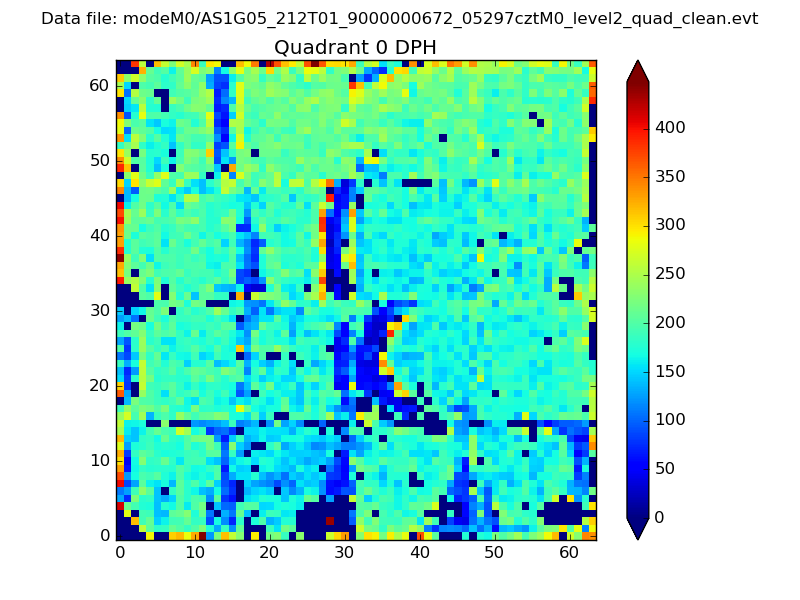 |
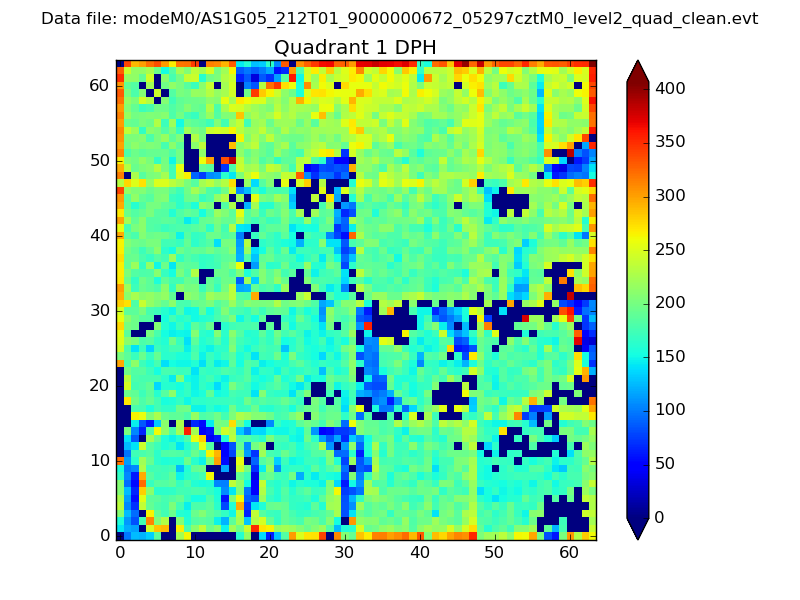 |
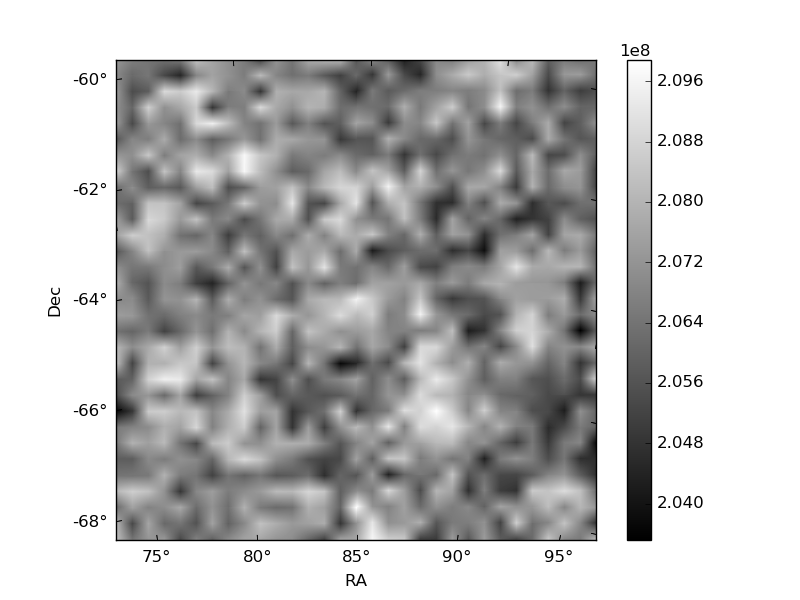
Quadrant B |
|---|---|---|---|
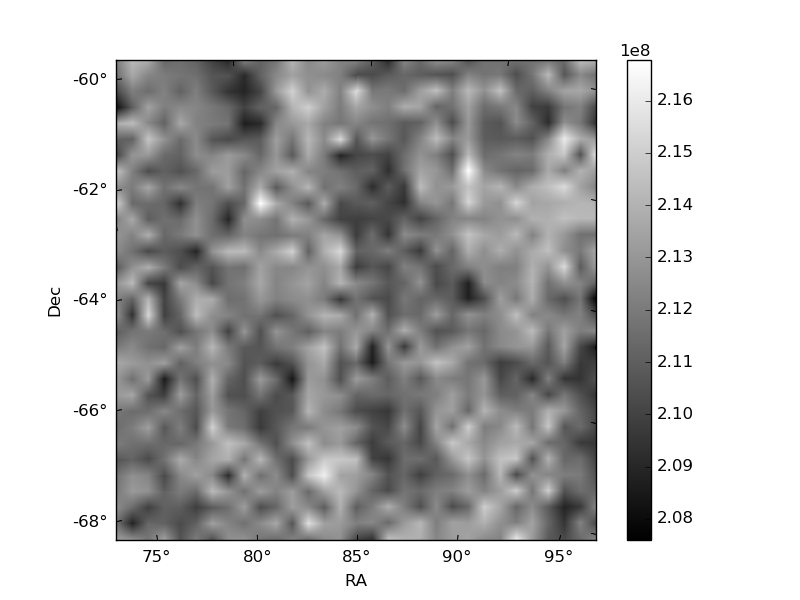
| Quadrant D | 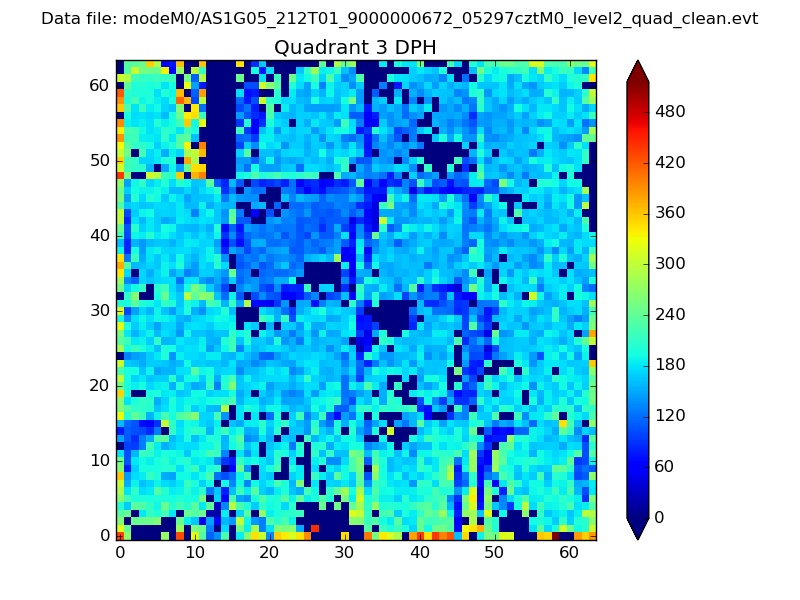 |
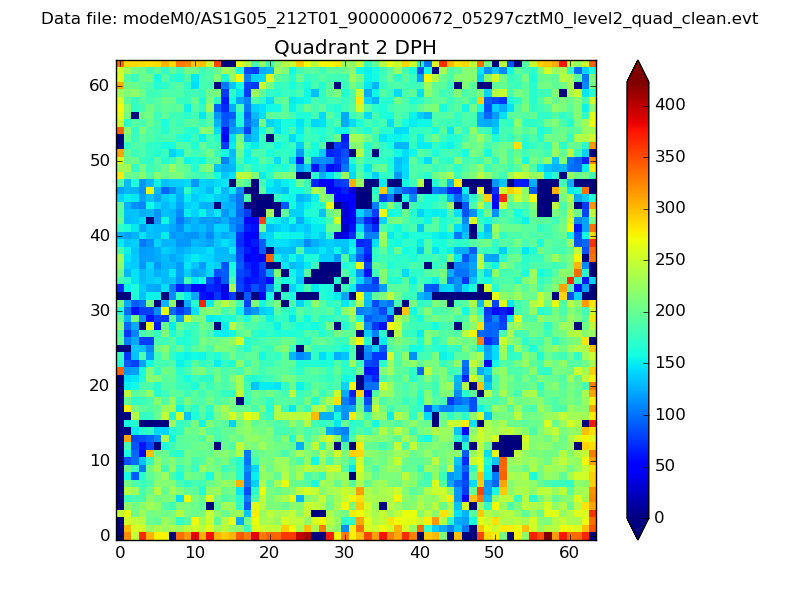 |
Quadrant C |
| Plot type | Count rate plots | Images |
|---|---|---|
| Comparison with Poisson distribution Blue bars denote a histogram of data divided into 1 sec bins. Red curve is a Poisson curve with rate = median count rate of data. |
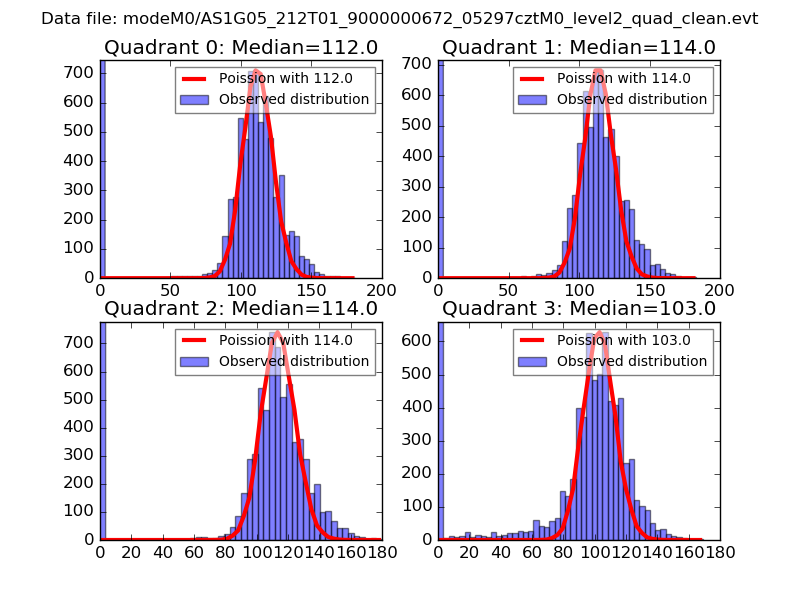 |
 |
| Quadrant-wise count rates Data is divided into 100 sec bins |
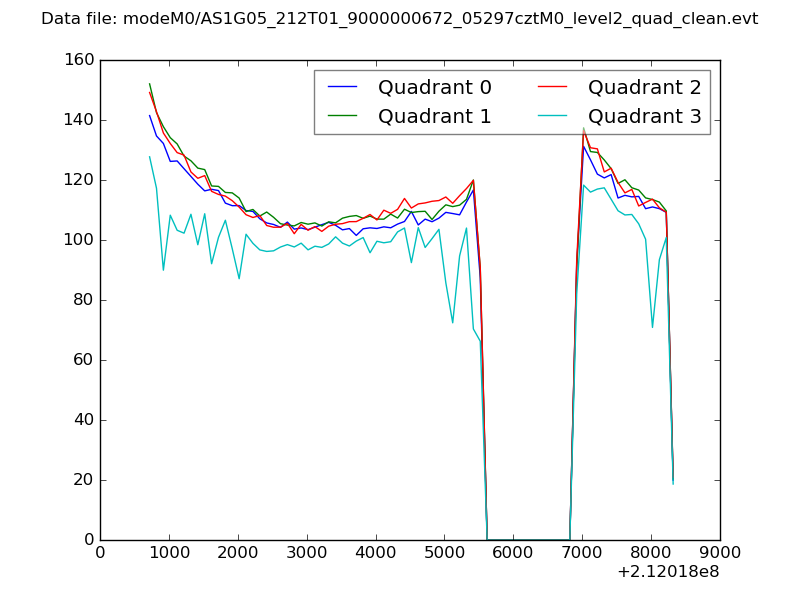 |
|
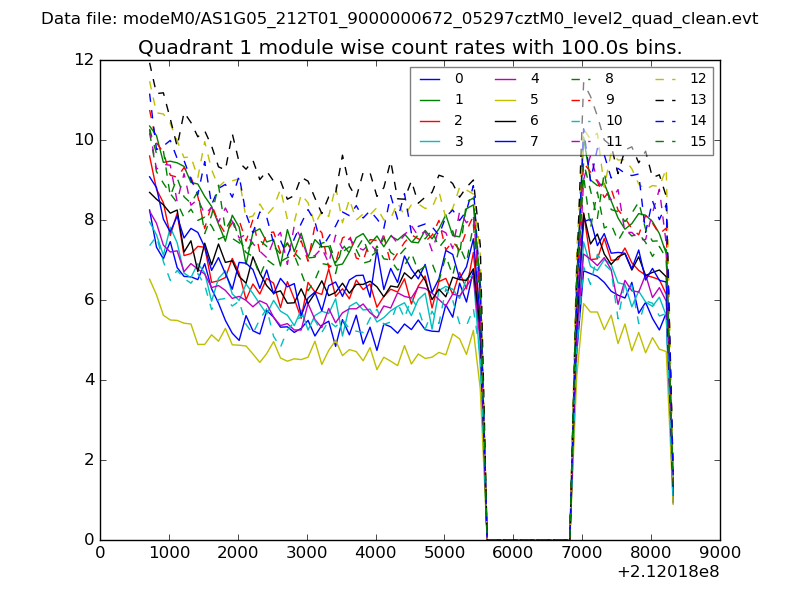
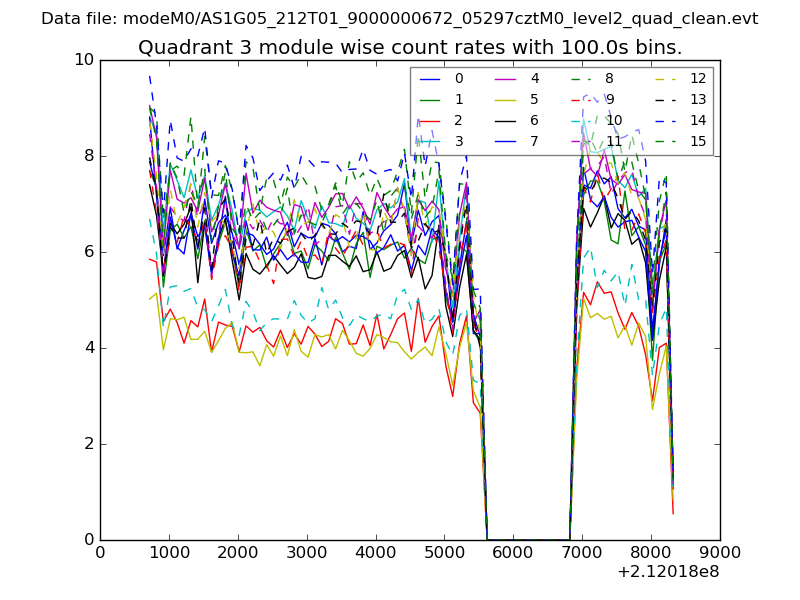
| Module-wise count rates for Quadrant A Data is divided into 100 sec bins |
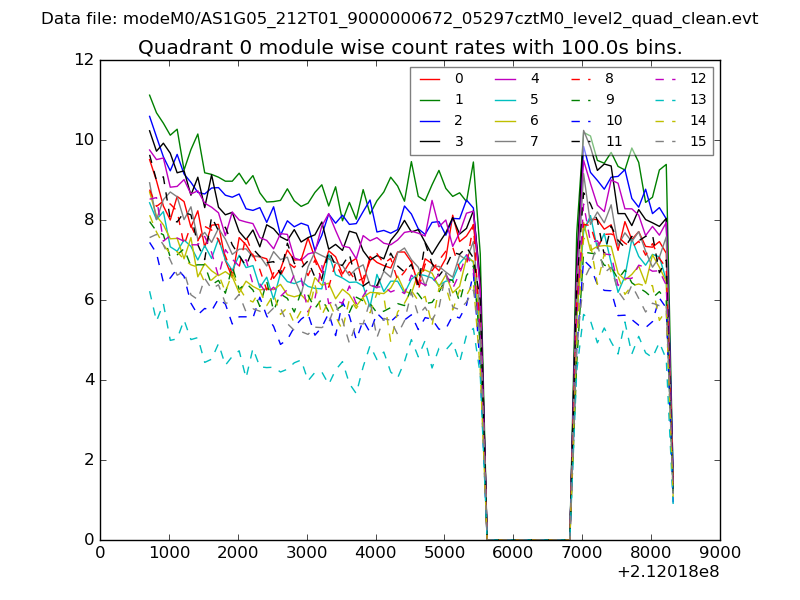 |
 |
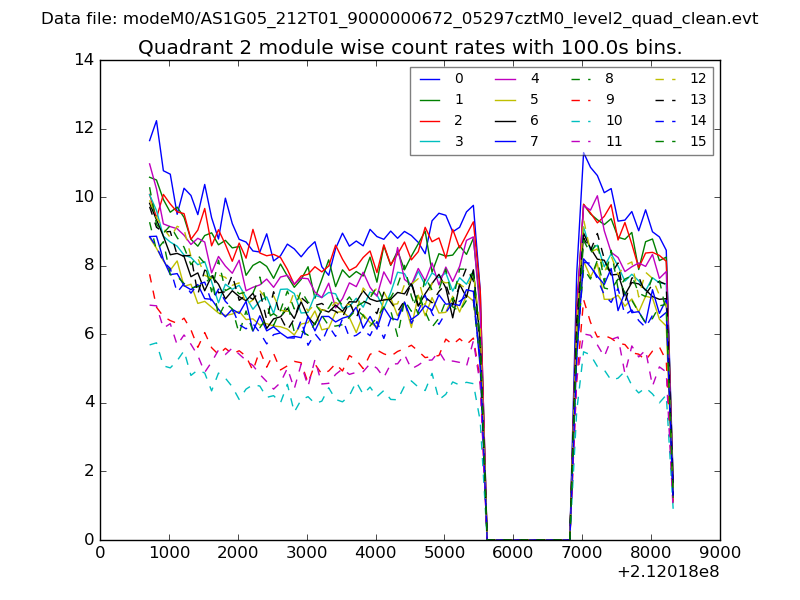
| Module-wise count rates for Quadrant B Data is divided into 100 sec bins |
 |
 |
| Module-wise count rates for Quadrant C Data is divided into 100 sec bins |
 |
 |
| Module-wise count rates for Quadrant D Data is divided into 100 sec bins |
 |
 |
| Parameter | Plot |
|---|---|
| CZT HV Monitor | 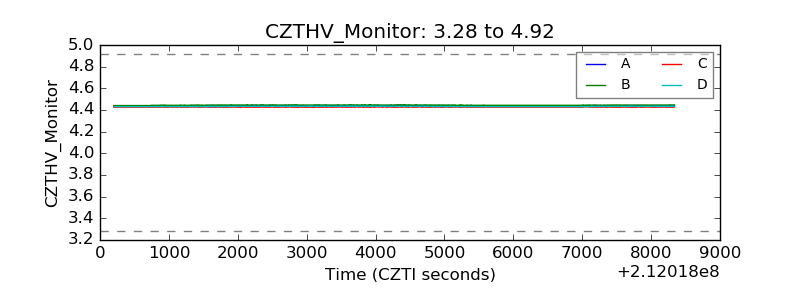 |
| D_VDD | 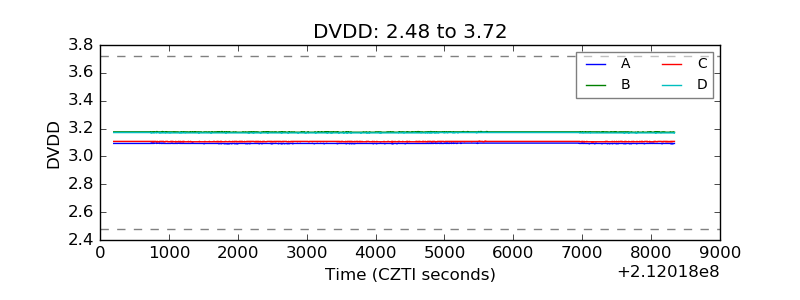 |
| Temperature 1 | 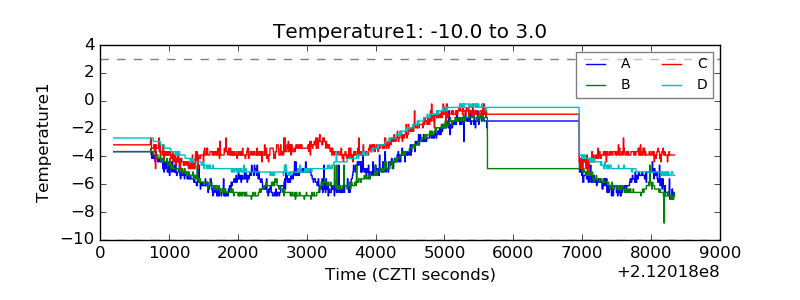 |
| Veto HV Monitor | 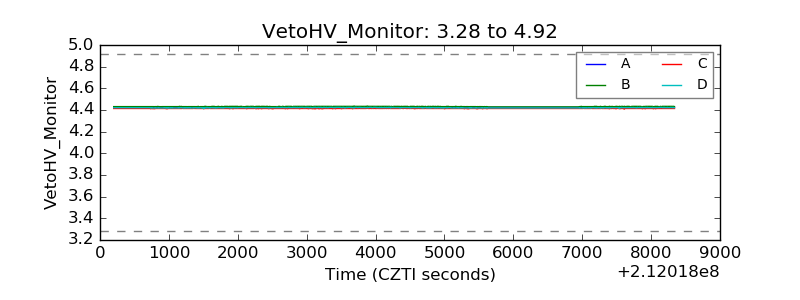 |
| Veto LLD | 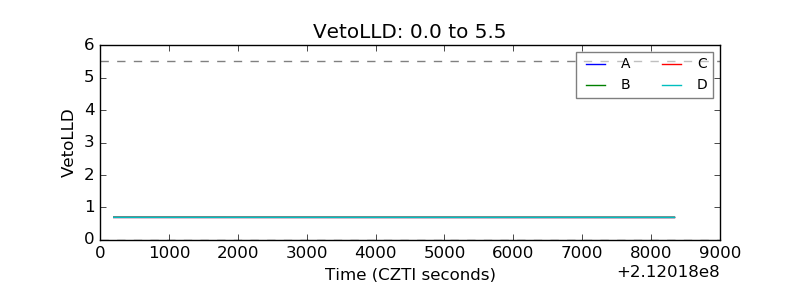 |
| Alpha Counter | 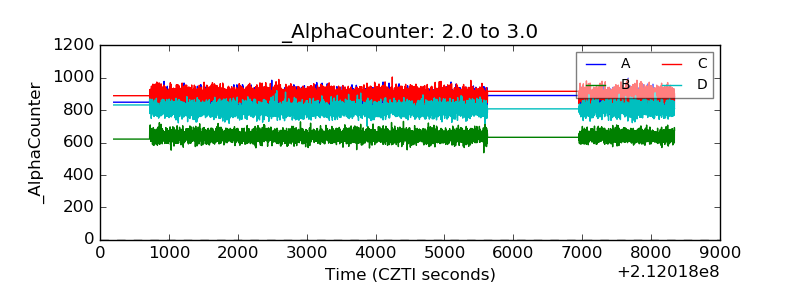 |
| _CPM_Rate | 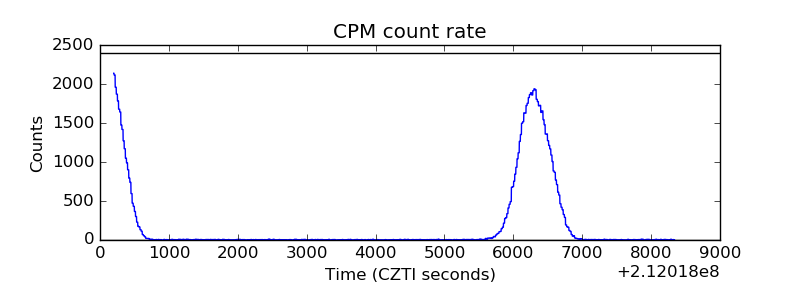 |
| CZT Counter | 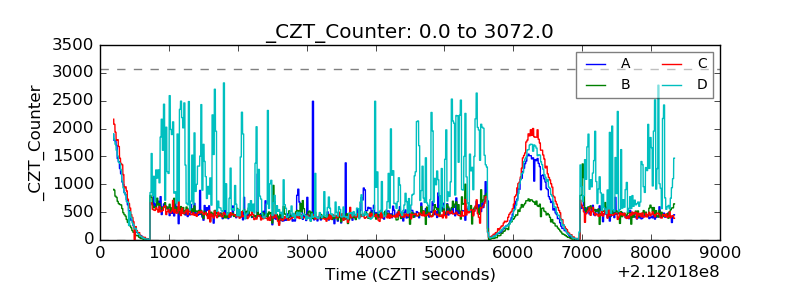 |
| +2.5 Volts monitor |  |
| +5 Volts monitor |  |
| _ROLL_ROT | 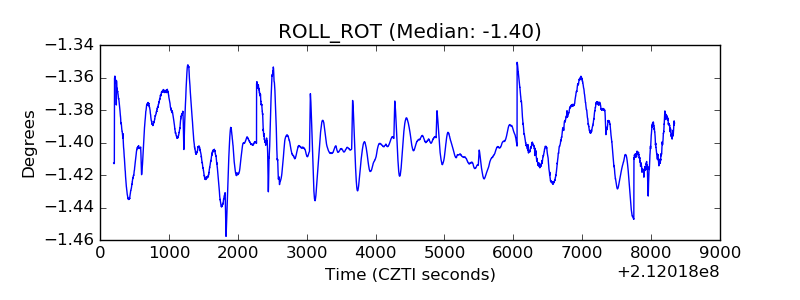 |
| _Roll_DEC | 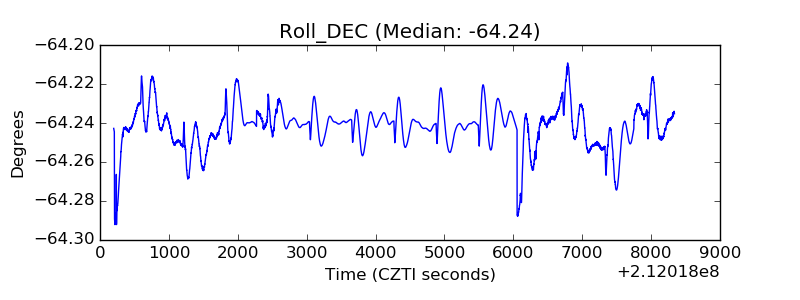 |
| _Roll_RA | 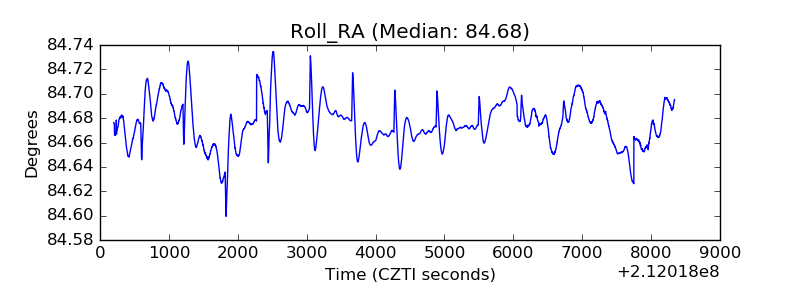 |
| Veto Counter | 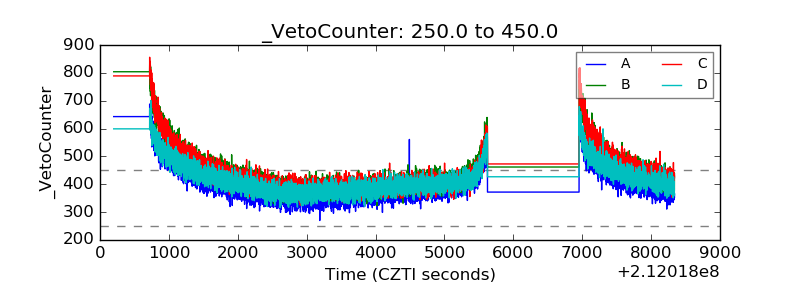 |