| Param | Original file | Final file |
|---|---|---|
| Filename | modeM0/AS1G05_212T01_9000000672_05298cztM0_level2.evt | modeM0/AS1G05_212T01_9000000672_05298cztM0_level2_quad_clean.evt |
| Size (bytes) | 494,694,720 | 105,010,560 |
| Size | 471.8 MB | 100.1 MB |
| Events in quadrant A | 2,933,063 | 685,853 |
| Events in quadrant B | 3,123,247 | 702,152 |
| Events in quadrant C | 2,898,441 | 703,106 |
| Events in quadrant D | 5,586,390 | 636,392 |
| Mode M9 | |||
|---|---|---|---|
| Quadrant | BADHDUFLAG | Total packets | Discarded packets |
| A | 0 | 21 | 0 |
| B | 0 | 21 | 0 |
| C | 0 | 21 | 0 |
| D | 0 | 22 | 0 |
| Mode M0 | |||
|---|---|---|---|
| Quadrant | BADHDUFLAG | Total packets | Discarded packets |
| A | 0 | 13292 | 3 |
| B | 0 | 13631 | 2 |
| C | 0 | 13160 | 2 |
| D | 0 | 21080 | 2 |
| Mode SS | |||
|---|---|---|---|
| Quadrant | BADHDUFLAG | Total packets | Discarded packets |
| A | 0 | 130 | 0 |
| B | 0 | 130 | 0 |
| C | 0 | 130 | 0 |
| D | 0 | 130 | 0 |
| Quadrant | Total seconds | Saturated seconds | Saturation percentage |
|---|---|---|---|
| A | 6495 | 12 | 0.184758% |
| B | 6495 | 26 | 0.400308% |
| C | 6495 | 4 | 0.061586% |
| D | 6495 | 625 | 9.622787% |
Noise dominated data is calculated using 1-second bins in cleaned event files. If a bin has >2000 counts, and if more than 50% of those come from <1% of pixels, then it is considered to be noise-dominated and hence unusable.
| Quadrant | # 1 sec bins | Bins with >0 counts | Bins with >2000 counts | High rate bins dominated by noise | Noise dominated (total time) | Noise dominated (detector-on time) | Marked lightcurve |
|---|---|---|---|---|---|---|---|
| A | 7830 | 6496 | 5 | 5 | 0.06% | 0.08% | 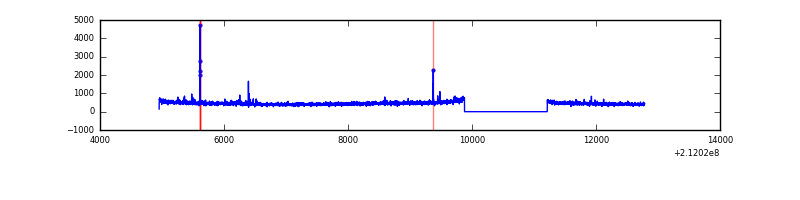 |
| B | 7830 | 6496 | 4 | 4 | 0.05% | 0.06% | 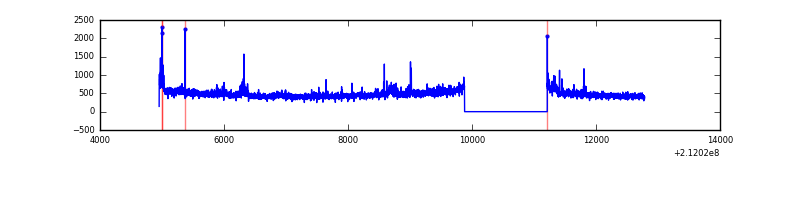 |
| C | 7830 | 6496 | 0 | 0 | 0.00% | 0.00% | 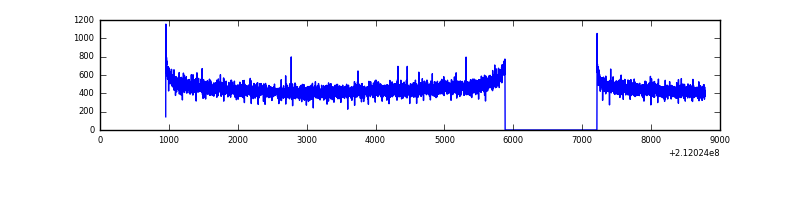 |
| D | 7830 | 6496 | 532 | 532 | 6.79% | 8.19% | 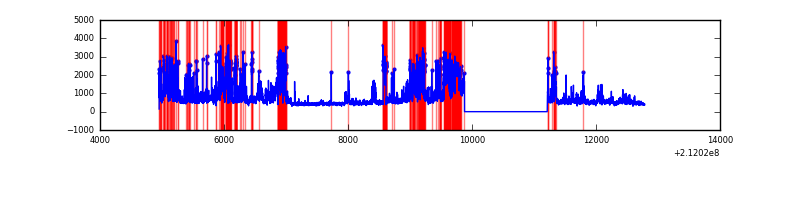 |
Top three noisy pixels from each quadrant. If the there are fewer than three noisy pixels in the level2.evt file, extra rows are filled as -1
| Pixel properties | Quadrant properties | ||||||
|---|---|---|---|---|---|---|---|
| Quadrant | DetID | PixID | Counts | Sigma | Mean | Median | Sigma |
| A | 13 | 251 | 89256 | 592.72 | 736 | 722 | 149.4 |
| A | 0 | 50 | 10767 | 67.25 | 736 | 722 | 149.4 |
| A | 12 | 194 | 7331 | 44.25 | 736 | 722 | 149.4 |
| B | 4 | 48 | 127056 | 892.65 | 758 | 740 | 141.5 |
| B | 15 | 204 | 23574 | 161.36 | 758 | 740 | 141.5 |
| B | 4 | 80 | 16752 | 113.15 | 758 | 740 | 141.5 |
| C | 1 | 16 | 6801 | 35.8 | 739 | 745 | 169.2 |
| C | 13 | 61 | 5866 | 30.27 | 739 | 745 | 169.2 |
| C | 12 | 4 | 3427 | 15.85 | 739 | 745 | 169.2 |
| D | 11 | 145 | 2156278 | 12751.08 | 701 | 681 | 169.1 |
| D | 2 | 33 | 300263 | 1772.13 | 701 | 681 | 169.1 |
| D | 8 | 195 | 157817 | 929.51 | 701 | 681 | 169.1 |
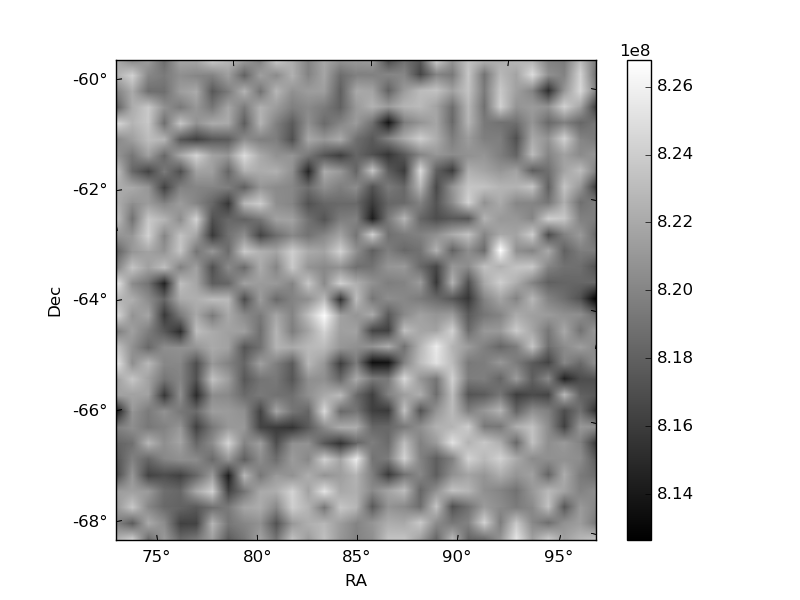
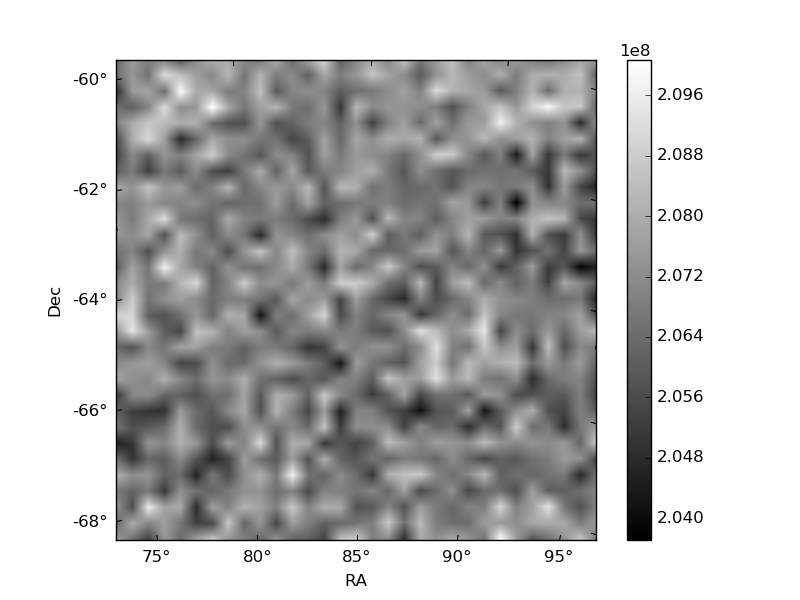
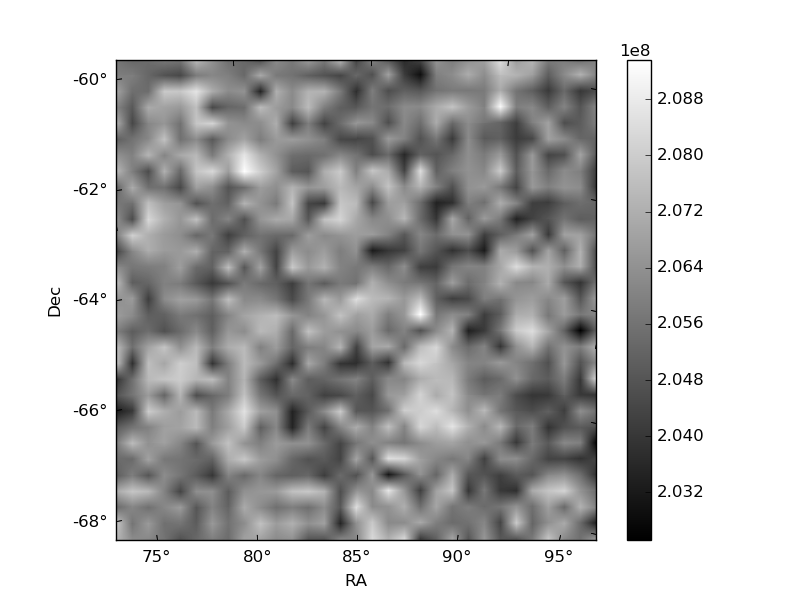
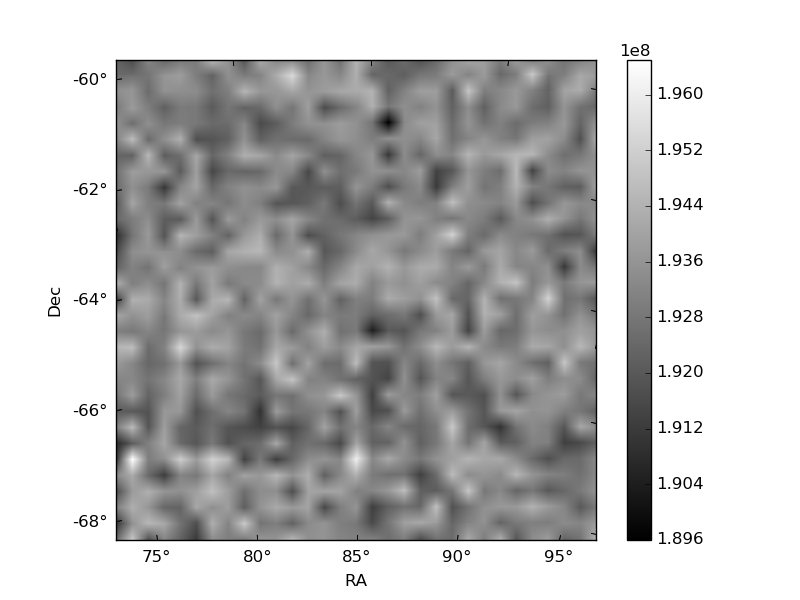
Histogram calculated using DETX and DETY for each event in the final _common_clean file
| Quadrant A | 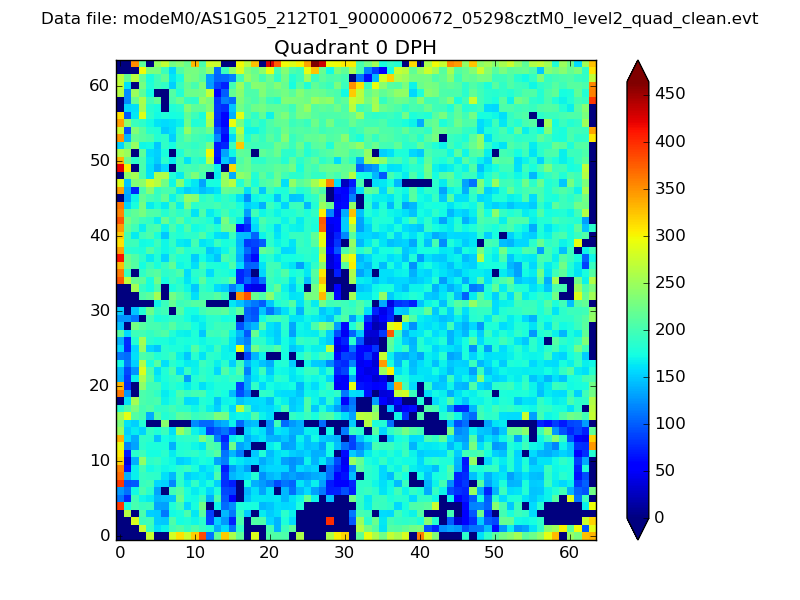 |
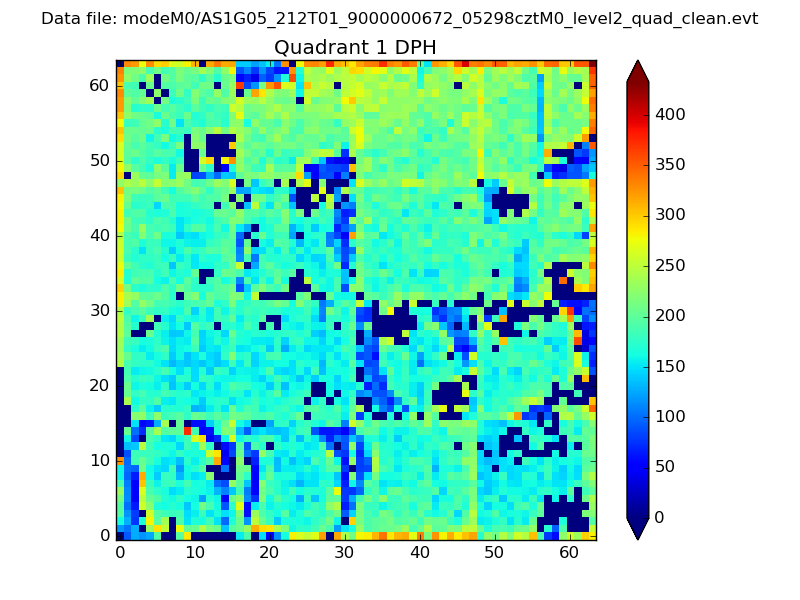 |
Quadrant B |
|---|---|---|---|
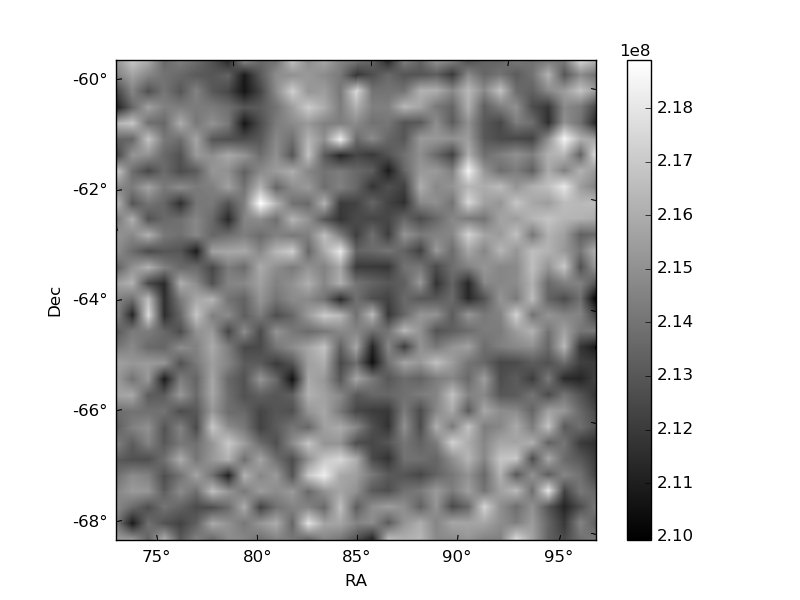
| Quadrant D | 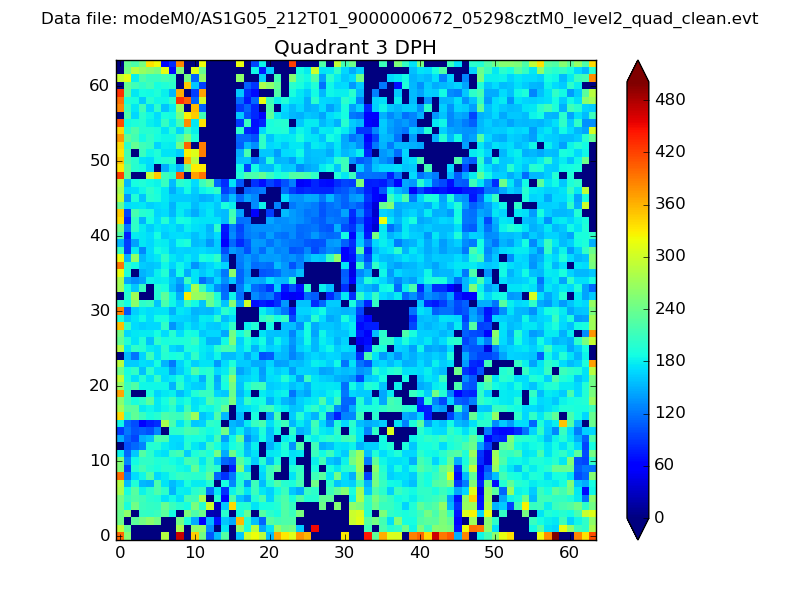 |
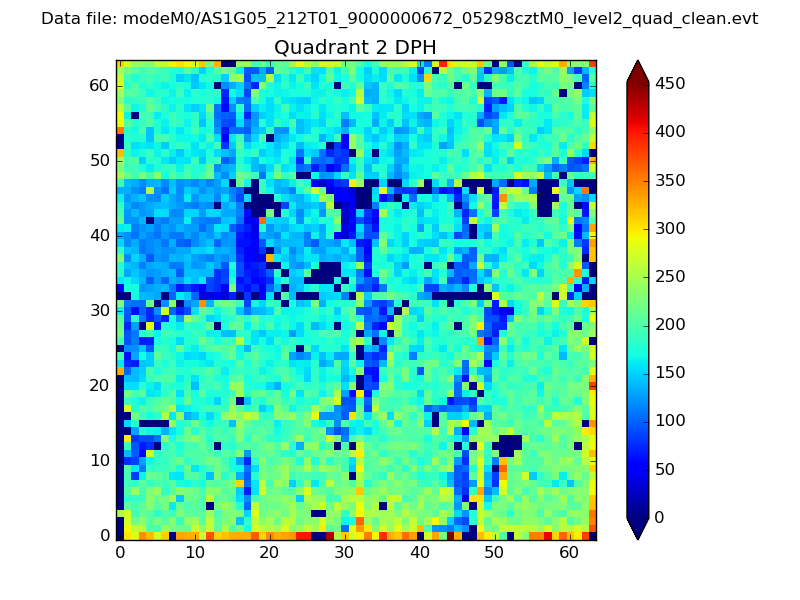 |
Quadrant C |
| Plot type | Count rate plots | Images |
|---|---|---|
| Comparison with Poisson distribution Blue bars denote a histogram of data divided into 1 sec bins. Red curve is a Poisson curve with rate = median count rate of data. |
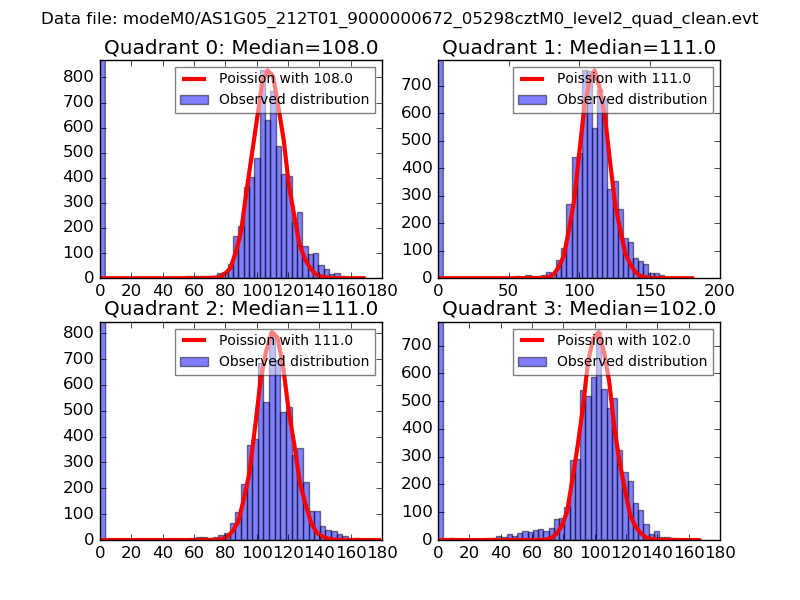 |
 |
| Quadrant-wise count rates Data is divided into 100 sec bins |
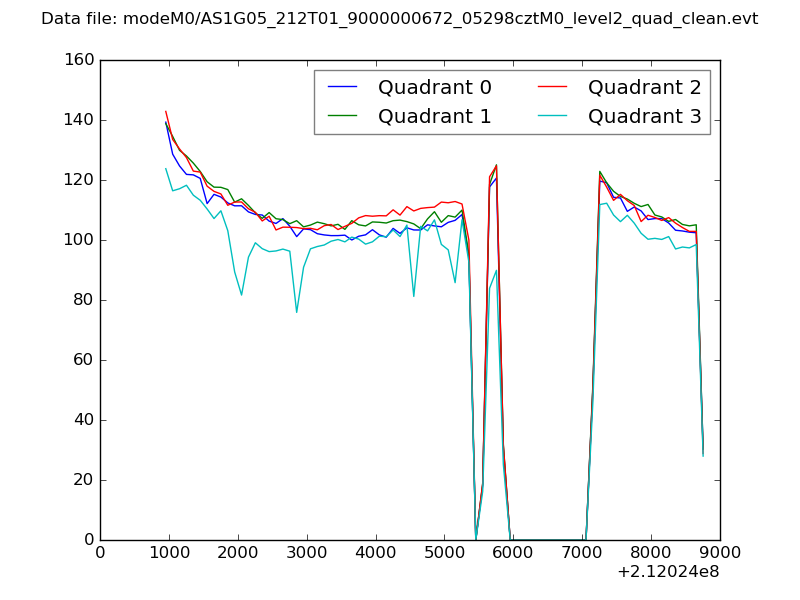 |
|
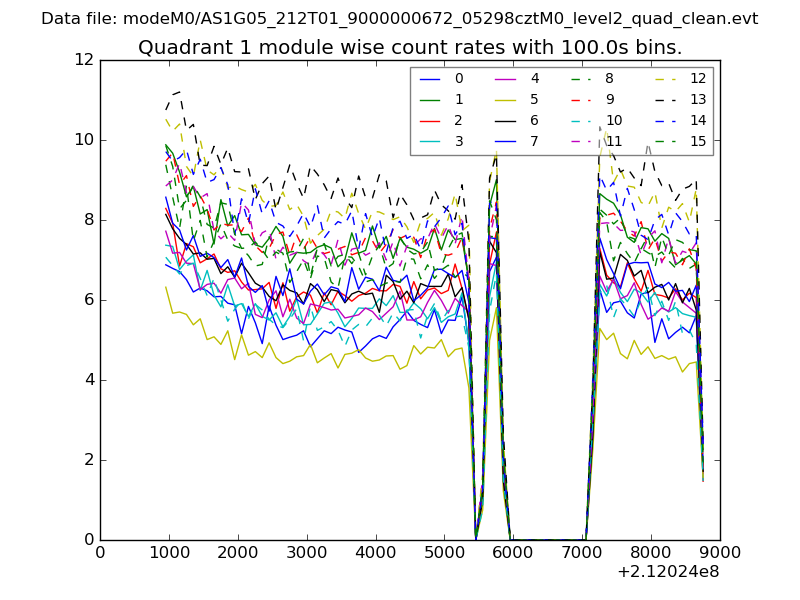
| Module-wise count rates for Quadrant A Data is divided into 100 sec bins |
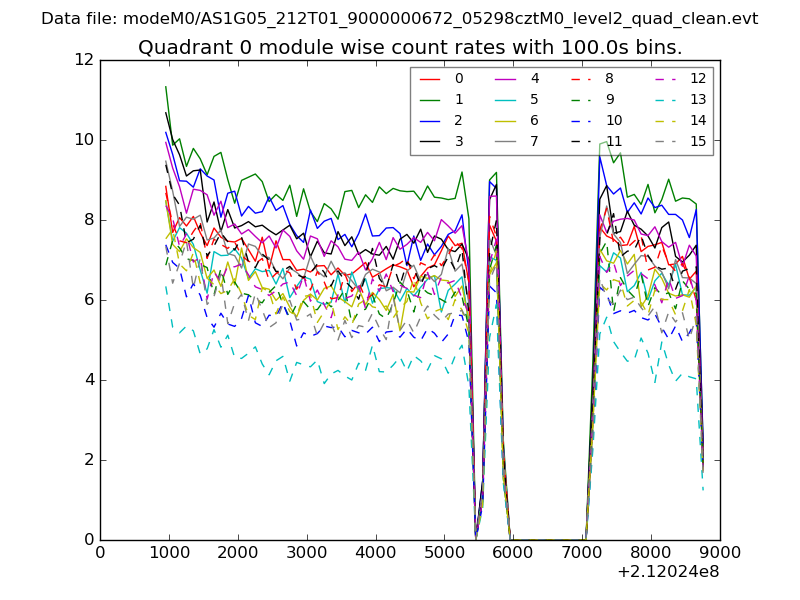 |
 |
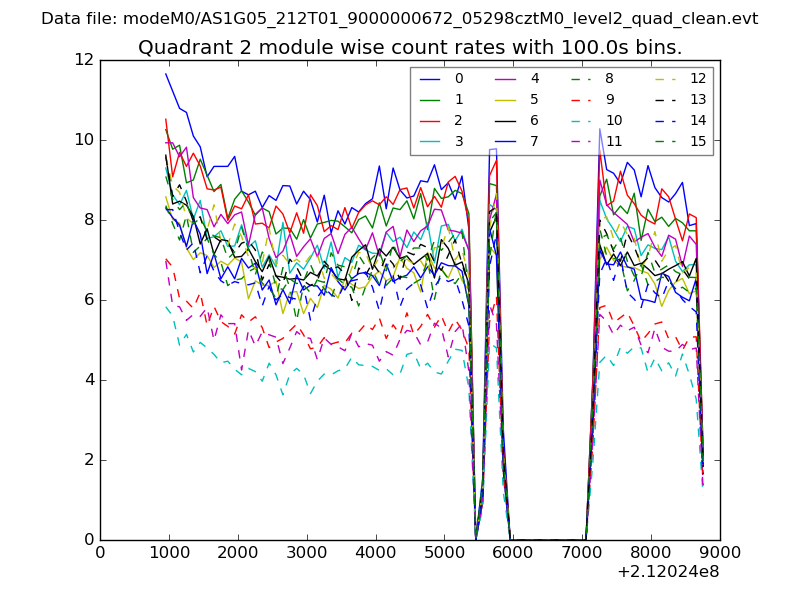
| Module-wise count rates for Quadrant B Data is divided into 100 sec bins |
 |
 |
| Module-wise count rates for Quadrant C Data is divided into 100 sec bins |
 |
 |
| Module-wise count rates for Quadrant D Data is divided into 100 sec bins |
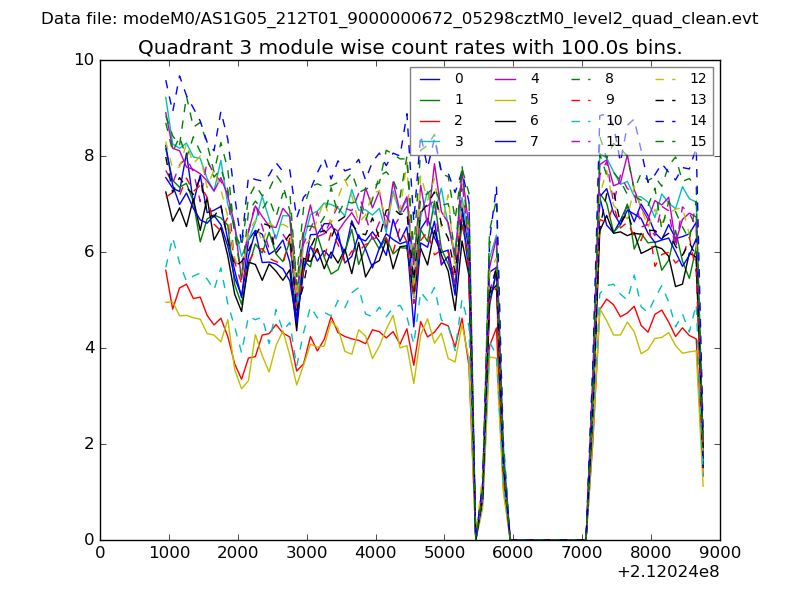 |
 |
| Parameter | Plot |
|---|---|
| CZT HV Monitor | 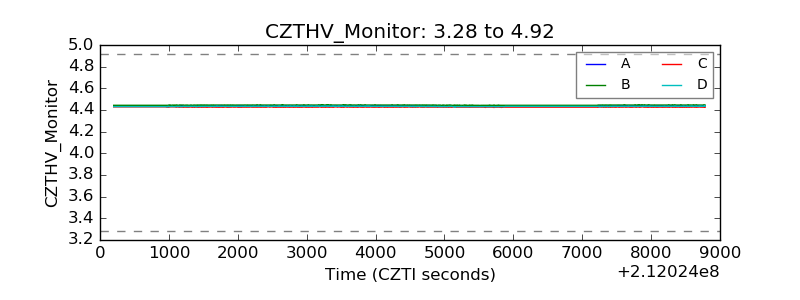 |
| D_VDD | 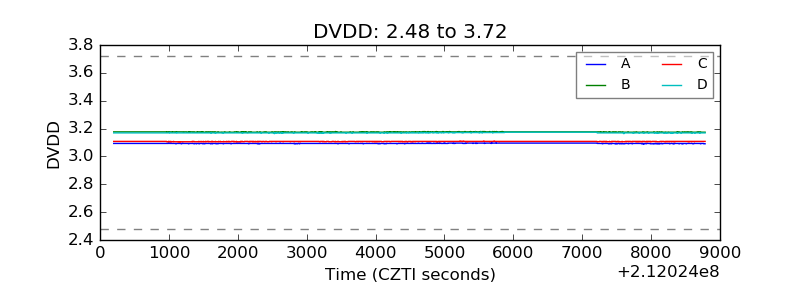 |
| Temperature 1 | 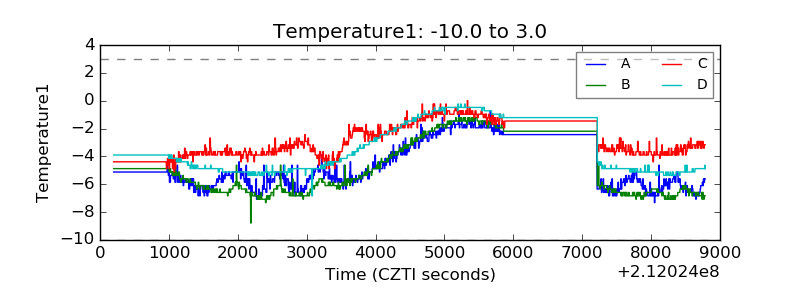 |
| Veto HV Monitor | 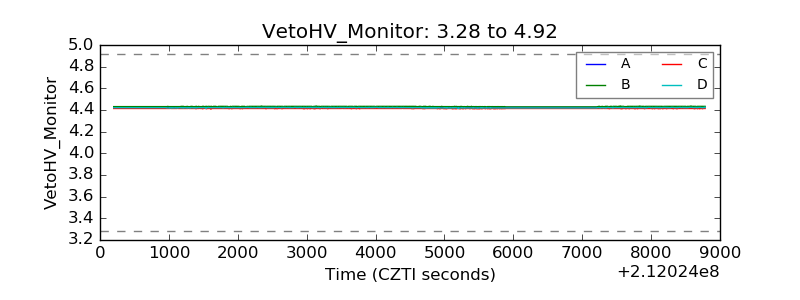 |
| Veto LLD | 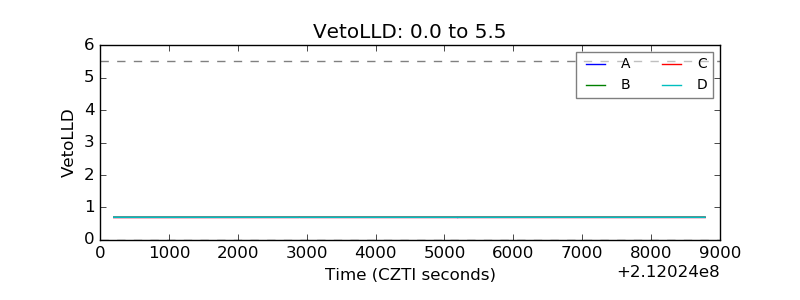 |
| Alpha Counter | 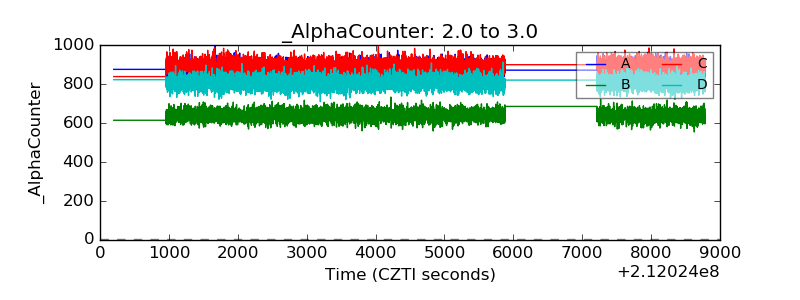 |
| _CPM_Rate | 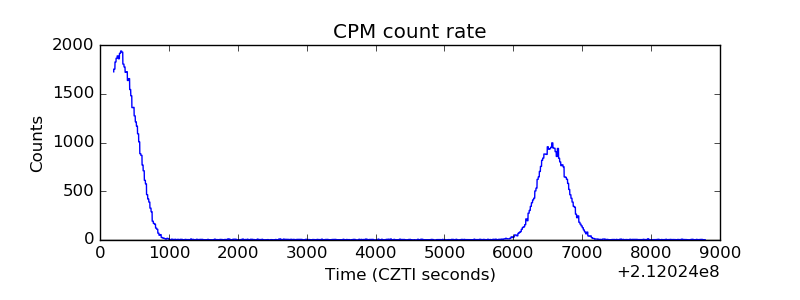 |
| CZT Counter | 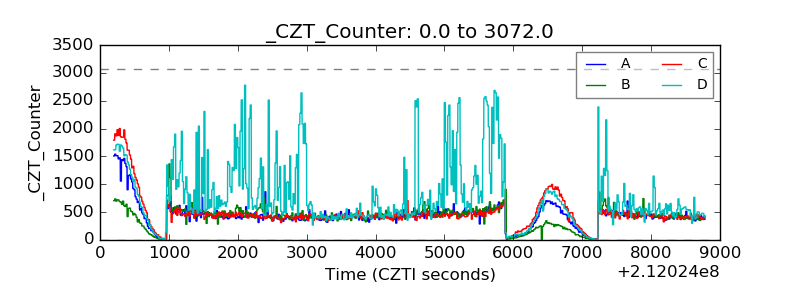 |
| +2.5 Volts monitor |  |
| +5 Volts monitor |  |
| _ROLL_ROT | 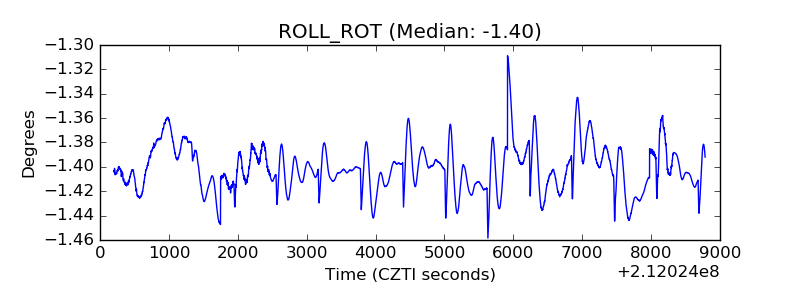 |
| _Roll_DEC | 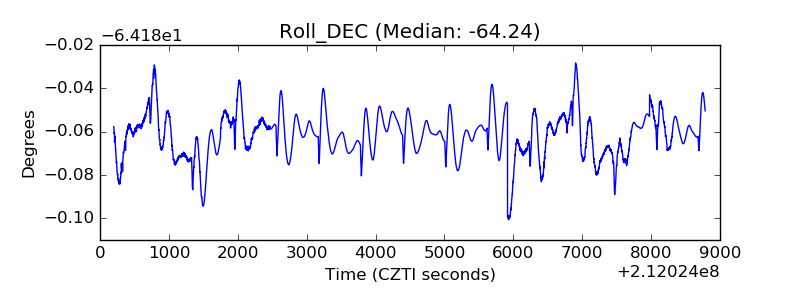 |
| _Roll_RA | 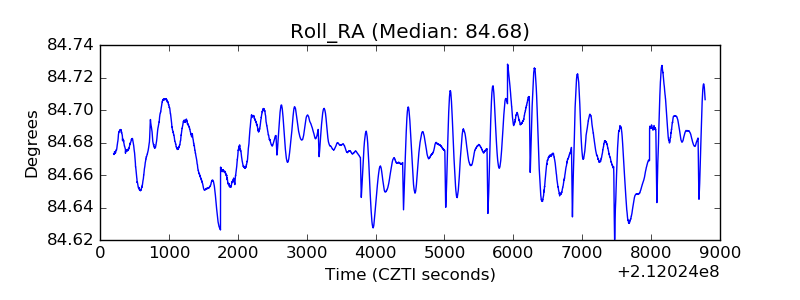 |
| Veto Counter | 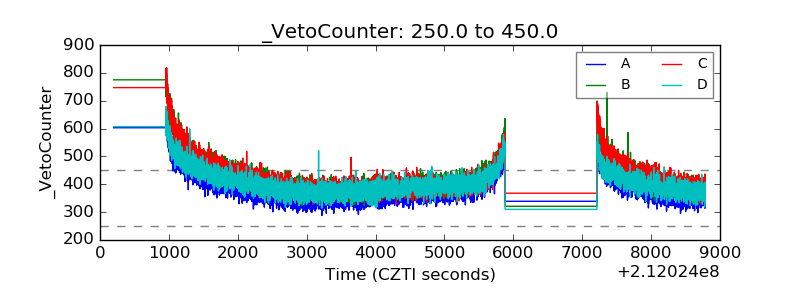 |