| Param | Original file | Final file |
|---|---|---|
| Filename | modeM0/AS1G05_212T01_9000000672_05299cztM0_level2.evt | modeM0/AS1G05_212T01_9000000672_05299cztM0_level2_quad_clean.evt |
| Size (bytes) | 478,693,440 | 101,718,720 |
| Size | 456.5 MB | 97.0 MB |
| Events in quadrant A | 2,846,055 | 659,662 |
| Events in quadrant B | 3,081,157 | 675,112 |
| Events in quadrant C | 2,948,377 | 675,361 |
| Events in quadrant D | 5,180,514 | 617,441 |
| Mode M9 | |||
|---|---|---|---|
| Quadrant | BADHDUFLAG | Total packets | Discarded packets |
| A | 0 | 23 | 0 |
| B | 0 | 23 | 0 |
| C | 0 | 23 | 0 |
| D | 0 | 24 | 0 |
| Mode M0 | |||
|---|---|---|---|
| Quadrant | BADHDUFLAG | Total packets | Discarded packets |
| A | 0 | 13198 | 3 |
| B | 0 | 13588 | 2 |
| C | 0 | 13279 | 2 |
| D | 0 | 19903 | 2 |
| Mode SS | |||
|---|---|---|---|
| Quadrant | BADHDUFLAG | Total packets | Discarded packets |
| A | 0 | 130 | 0 |
| B | 0 | 130 | 0 |
| C | 0 | 130 | 0 |
| D | 0 | 130 | 0 |
| Quadrant | Total seconds | Saturated seconds | Saturation percentage |
|---|---|---|---|
| A | 6499 | 11 | 0.169257% |
| B | 6499 | 32 | 0.492383% |
| C | 6499 | 28 | 0.430836% |
| D | 6499 | 554 | 8.524388% |
Noise dominated data is calculated using 1-second bins in cleaned event files. If a bin has >2000 counts, and if more than 50% of those come from <1% of pixels, then it is considered to be noise-dominated and hence unusable.
| Quadrant | # 1 sec bins | Bins with >0 counts | Bins with >2000 counts | High rate bins dominated by noise | Noise dominated (total time) | Noise dominated (detector-on time) | Marked lightcurve |
|---|---|---|---|---|---|---|---|
| A | 7564 | 6500 | 0 | 0 | 0.00% | 0.00% | 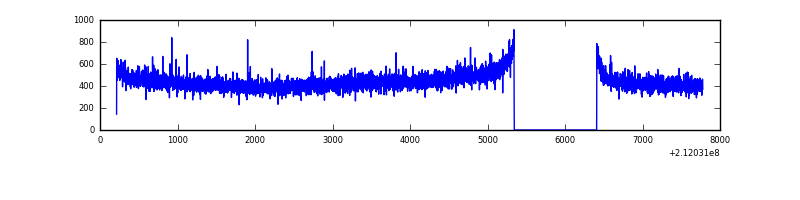 |
| B | 7564 | 6500 | 2 | 2 | 0.03% | 0.03% | 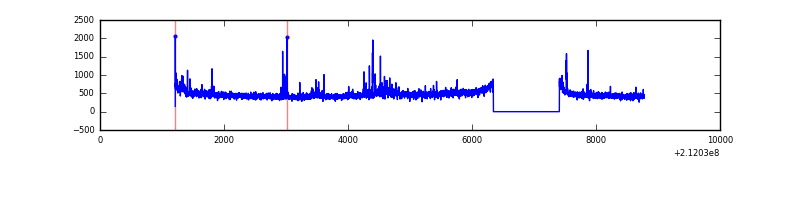 |
| C | 7564 | 6500 | 0 | 0 | 0.00% | 0.00% | 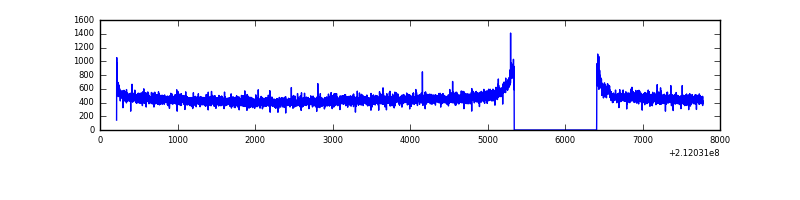 |
| D | 7564 | 6500 | 414 | 414 | 5.47% | 6.37% | 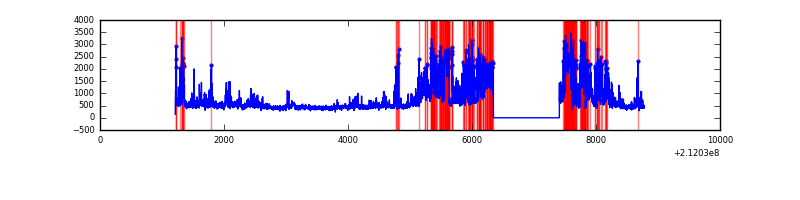 |
Top three noisy pixels from each quadrant. If the there are fewer than three noisy pixels in the level2.evt file, extra rows are filled as -1
| Pixel properties | Quadrant properties | ||||||
|---|---|---|---|---|---|---|---|
| Quadrant | DetID | PixID | Counts | Sigma | Mean | Median | Sigma |
| A | 13 | 251 | 28500 | 188.43 | 730 | 715 | 147.5 |
| A | 12 | 194 | 7119 | 43.43 | 730 | 715 | 147.5 |
| A | 0 | 226 | 6911 | 42.02 | 730 | 715 | 147.5 |
| B | 4 | 48 | 125179 | 885.28 | 748 | 730 | 140.6 |
| B | 15 | 204 | 26956 | 186.56 | 748 | 730 | 140.6 |
| B | 15 | 54 | 15127 | 102.41 | 748 | 730 | 140.6 |
| C | 1 | 16 | 74236 | 435.43 | 734 | 737 | 168.8 |
| C | 13 | 61 | 5864 | 30.37 | 734 | 737 | 168.8 |
| C | 12 | 4 | 5012 | 25.33 | 734 | 737 | 168.8 |
| D | 11 | 145 | 1848627 | 10830.26 | 704 | 684 | 170.6 |
| D | 2 | 136 | 209161 | 1221.82 | 704 | 684 | 170.6 |
| D | 1 | 239 | 120482 | 702.1 | 704 | 684 | 170.6 |
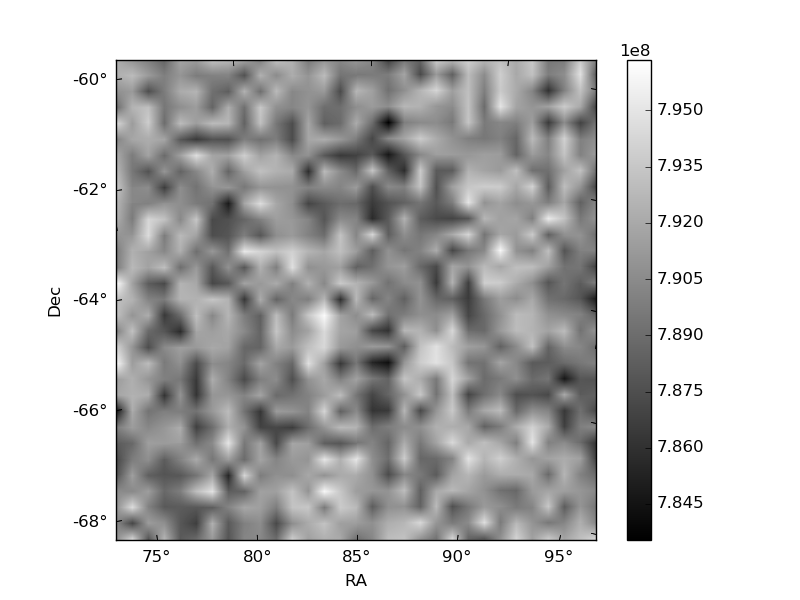
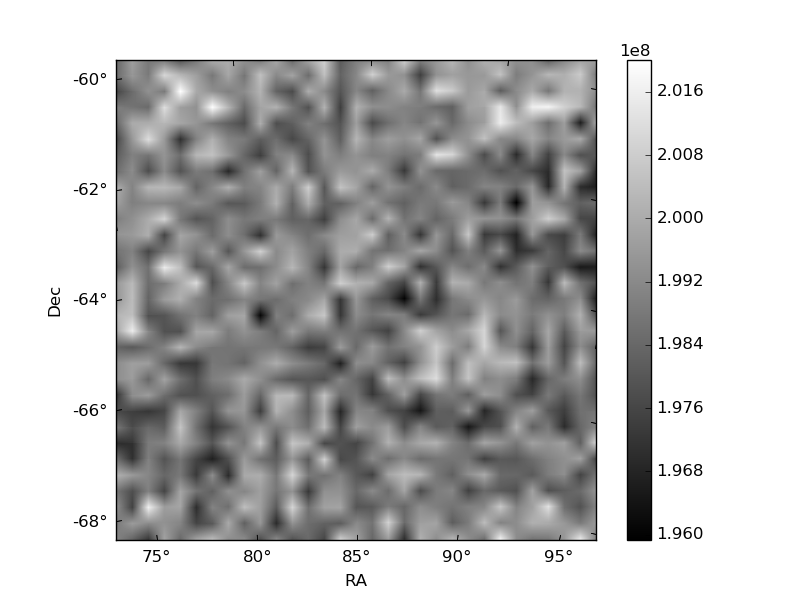
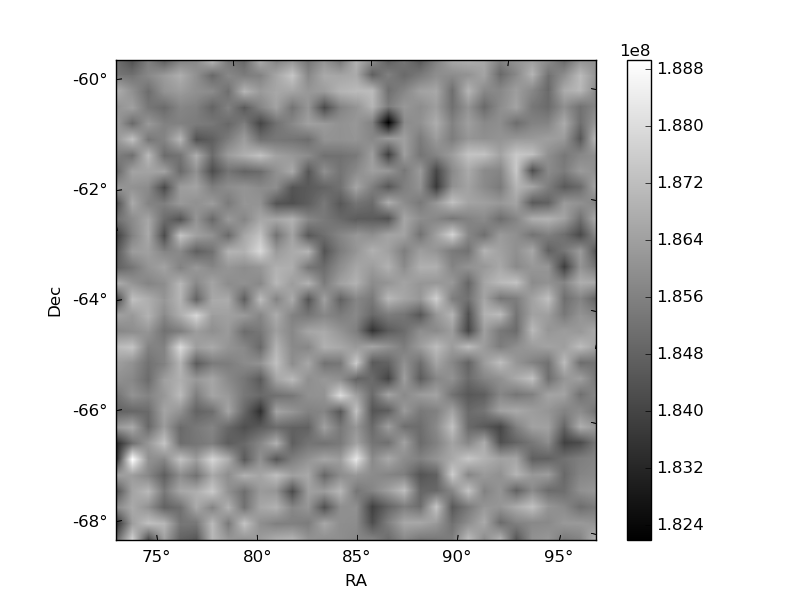
Histogram calculated using DETX and DETY for each event in the final _common_clean file
| Quadrant A | 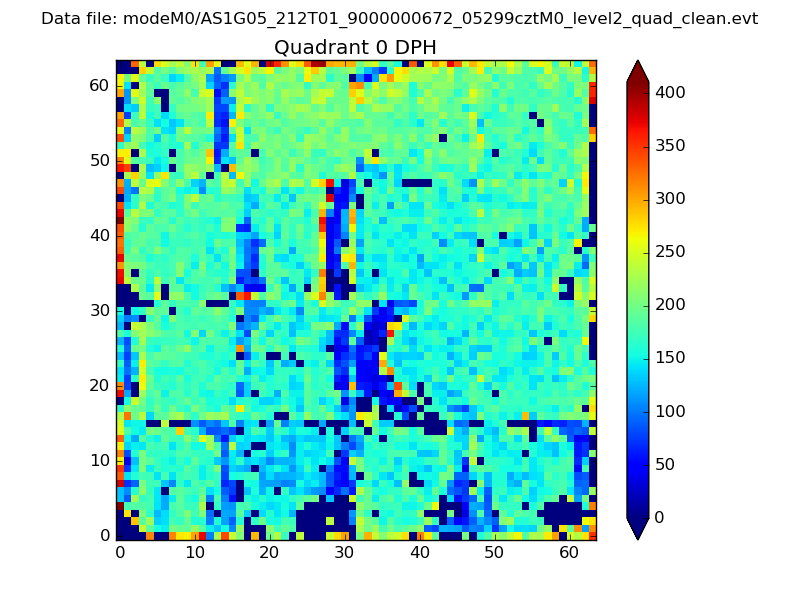 |
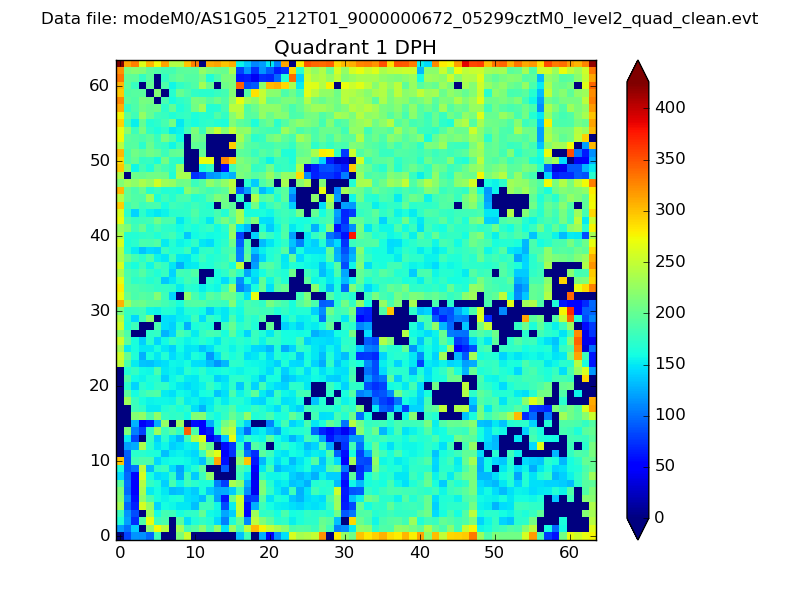 |
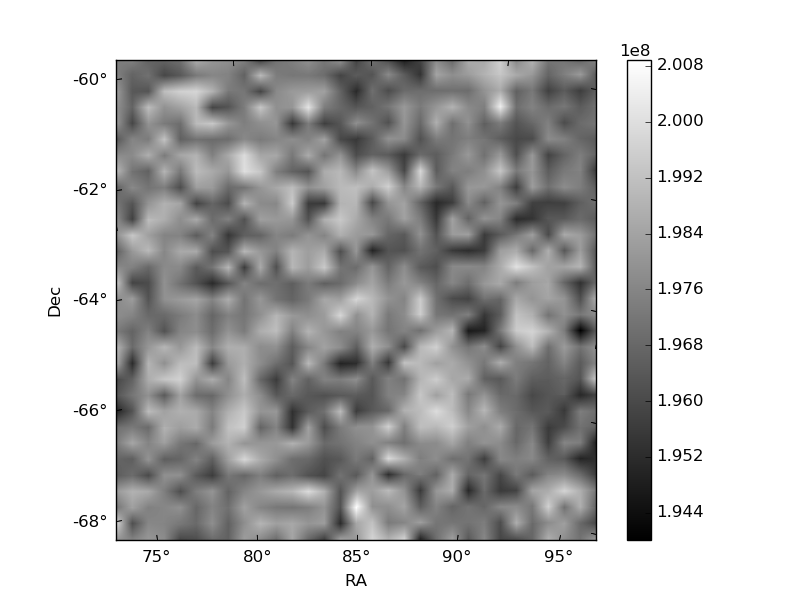
Quadrant B |
|---|---|---|---|
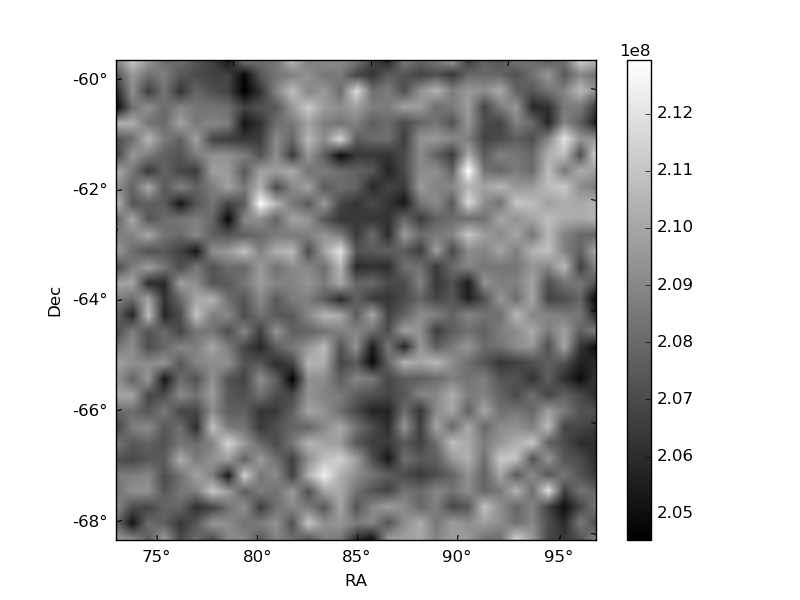
| Quadrant D | 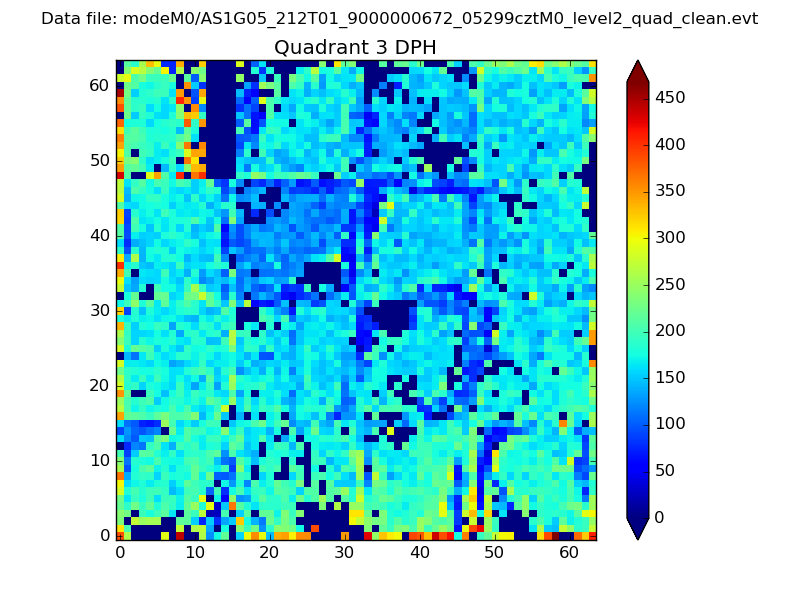 |
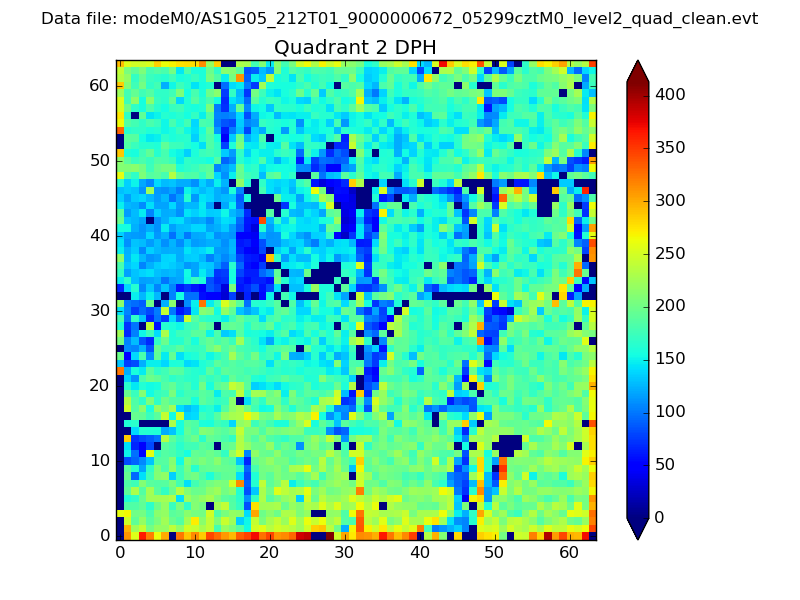 |
Quadrant C |
| Plot type | Count rate plots | Images |
|---|---|---|
| Comparison with Poisson distribution Blue bars denote a histogram of data divided into 1 sec bins. Red curve is a Poisson curve with rate = median count rate of data. |
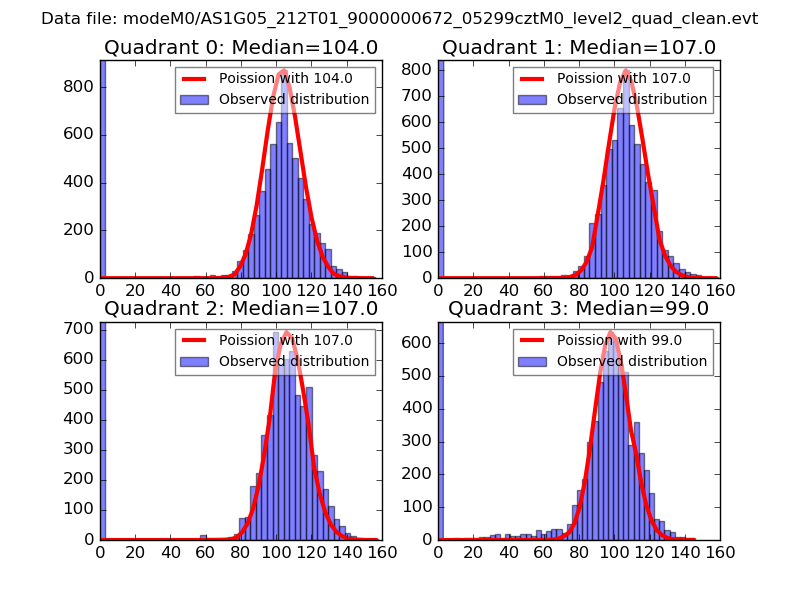 |
 |
| Quadrant-wise count rates Data is divided into 100 sec bins |
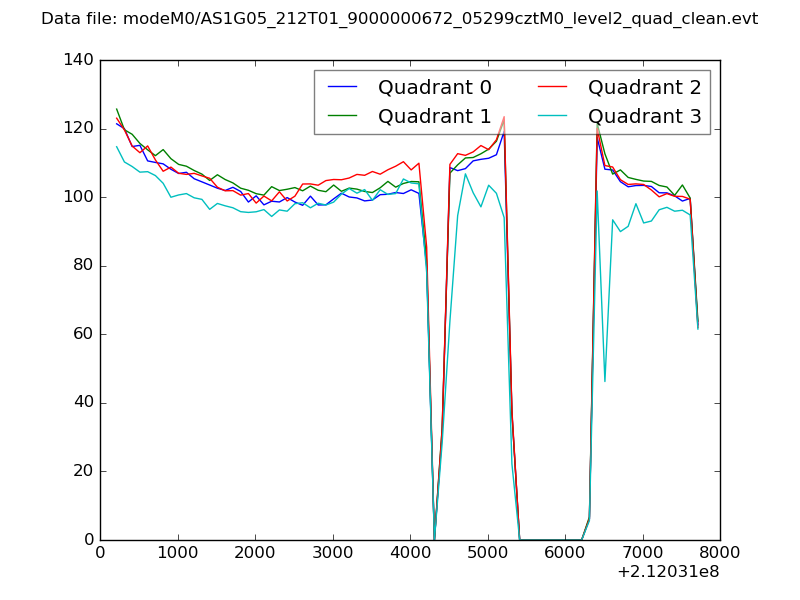 |
|
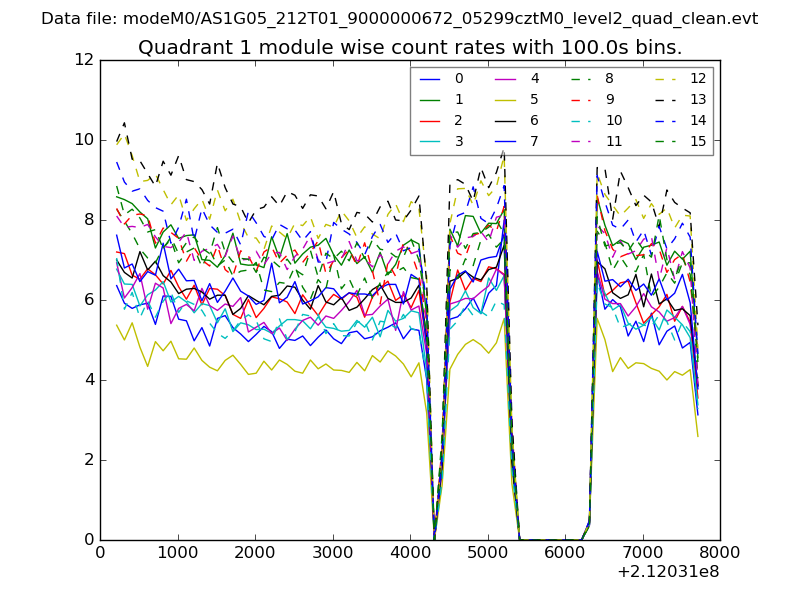
| Module-wise count rates for Quadrant A Data is divided into 100 sec bins |
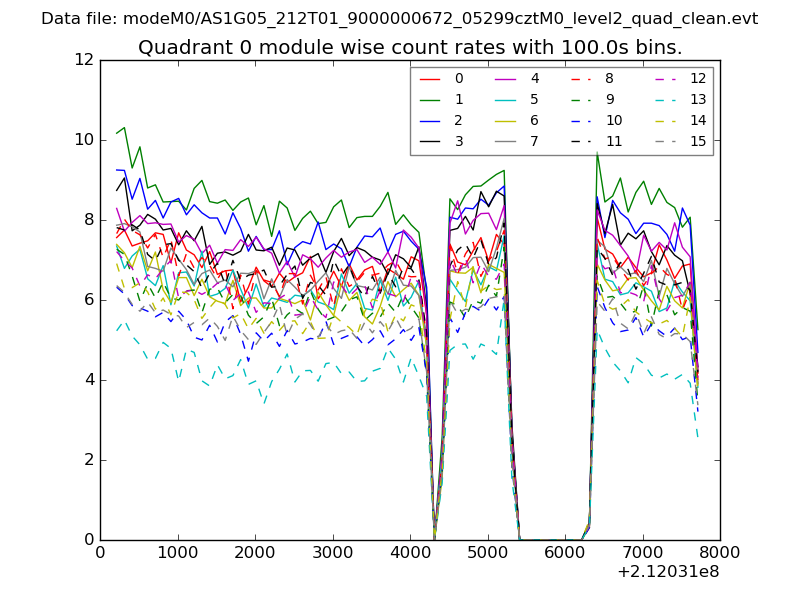 |
 |
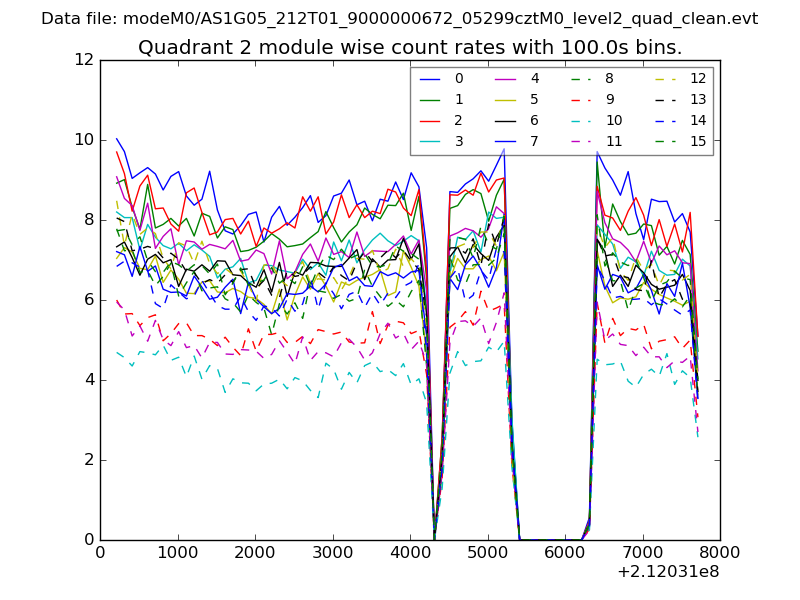
| Module-wise count rates for Quadrant B Data is divided into 100 sec bins |
 |
 |
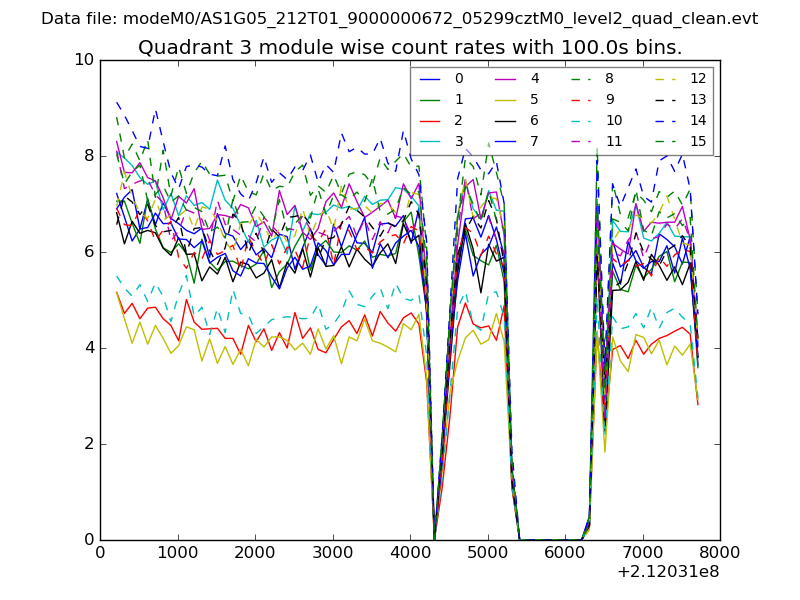
| Module-wise count rates for Quadrant C Data is divided into 100 sec bins |
 |
 |
| Module-wise count rates for Quadrant D Data is divided into 100 sec bins |
 |
 |
| Parameter | Plot |
|---|---|
| CZT HV Monitor | 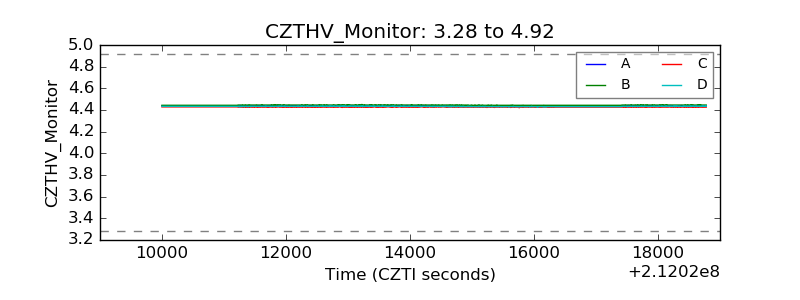 |
| D_VDD | 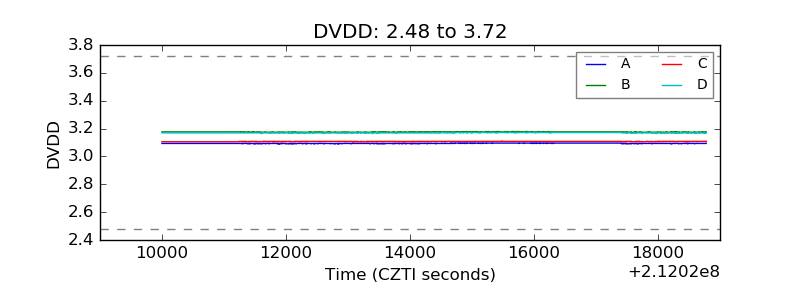 |
| Temperature 1 |  |
| Veto HV Monitor | 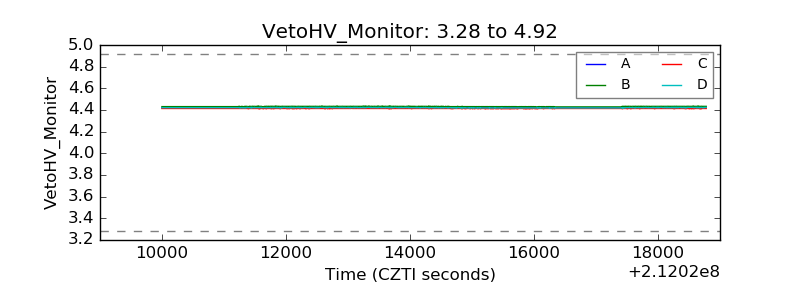 |
| Veto LLD | 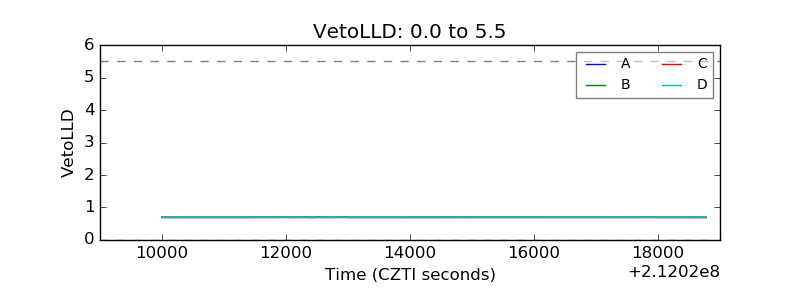 |
| Alpha Counter | 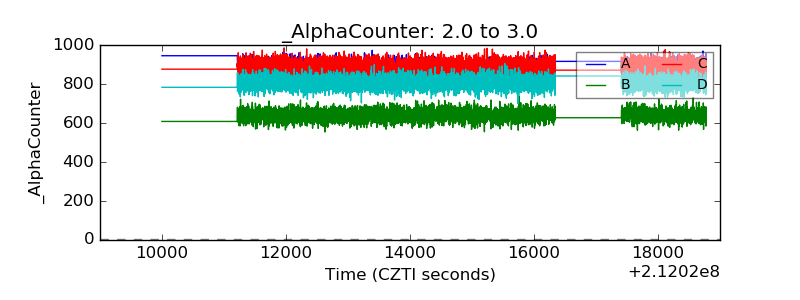 |
| _CPM_Rate | 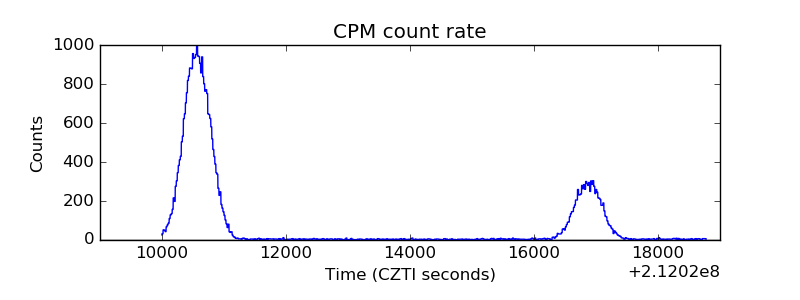 |
| CZT Counter | 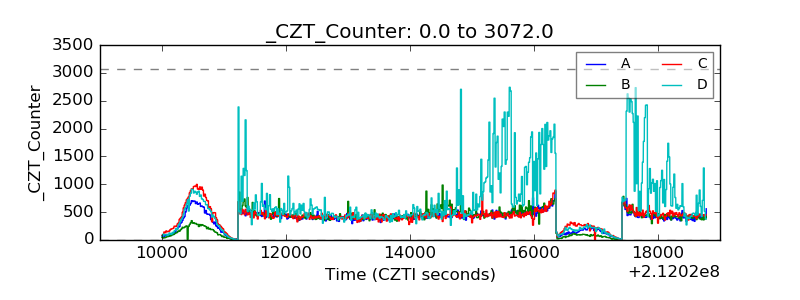 |
| +2.5 Volts monitor |  |
| +5 Volts monitor |  |
| _ROLL_ROT |  |
| _Roll_DEC |  |
| _Roll_RA | 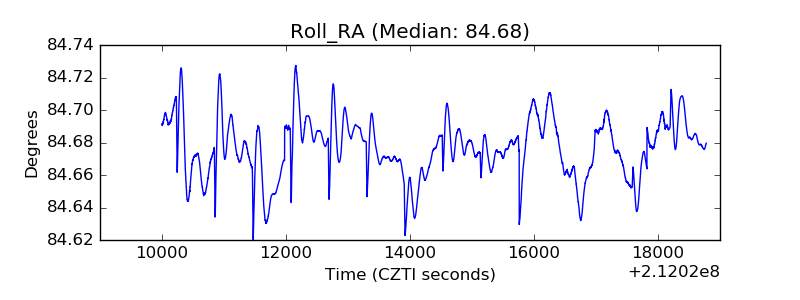 |
| Veto Counter | 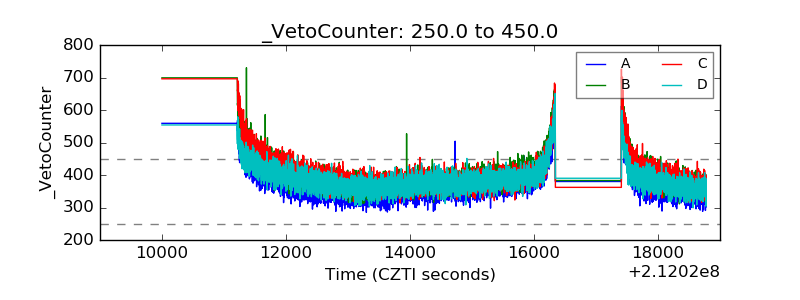 |