| Param | Original file | Final file |
|---|---|---|
| Filename | modeM0/AS1G05_212T01_9000000672_05300cztM0_level2.evt | modeM0/AS1G05_212T01_9000000672_05300cztM0_level2_quad_clean.evt |
| Size (bytes) | 567,472,320 | 107,579,520 |
| Size | 541.2 MB | 102.6 MB |
| Events in quadrant A | 3,096,846 | 702,710 |
| Events in quadrant B | 3,364,209 | 710,407 |
| Events in quadrant C | 3,330,383 | 715,123 |
| Events in quadrant D | 6,915,046 | 637,330 |
| Mode M9 | |||
|---|---|---|---|
| Quadrant | BADHDUFLAG | Total packets | Discarded packets |
| A | 0 | 17 | 0 |
| B | 0 | 17 | 0 |
| C | 0 | 17 | 0 |
| D | 0 | 17 | 0 |
| Mode M0 | |||
|---|---|---|---|
| Quadrant | BADHDUFLAG | Total packets | Discarded packets |
| A | 0 | 14439 | 3 |
| B | 0 | 14960 | 4 |
| C | 0 | 14490 | 2 |
| D | 0 | 25589 | 2 |
| Mode SS | |||
|---|---|---|---|
| Quadrant | BADHDUFLAG | Total packets | Discarded packets |
| A | 0 | 142 | 0 |
| B | 0 | 142 | 0 |
| C | 0 | 142 | 0 |
| D | 0 | 142 | 0 |
| Quadrant | Total seconds | Saturated seconds | Saturation percentage |
|---|---|---|---|
| A | 7071 | 45 | 0.636402% |
| B | 7070 | 66 | 0.933522% |
| C | 7071 | 58 | 0.820252% |
| D | 7071 | 1166 | 16.489888% |
Noise dominated data is calculated using 1-second bins in cleaned event files. If a bin has >2000 counts, and if more than 50% of those come from <1% of pixels, then it is considered to be noise-dominated and hence unusable.
| Quadrant | # 1 sec bins | Bins with >0 counts | Bins with >2000 counts | High rate bins dominated by noise | Noise dominated (total time) | Noise dominated (detector-on time) | Marked lightcurve |
|---|---|---|---|---|---|---|---|
| A | 7771 | 7073 | 2 | 2 | 0.03% | 0.03% |  |
| B | 7771 | 7073 | 5 | 5 | 0.06% | 0.07% | 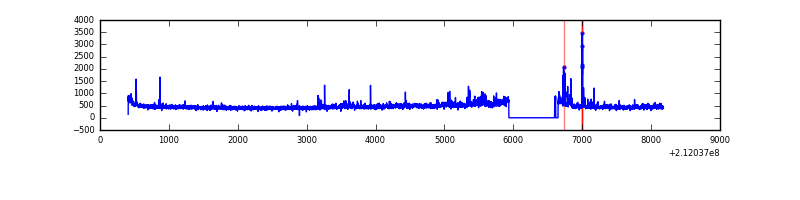 |
| C | 7771 | 7073 | 0 | 0 | 0.00% | 0.00% | 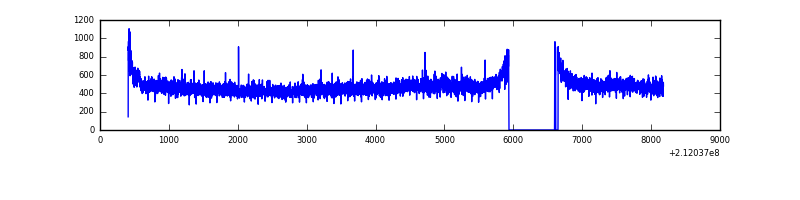 |
| D | 7771 | 7073 | 1022 | 1022 | 13.15% | 14.45% | 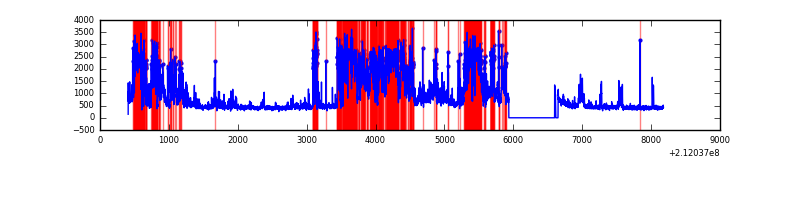 |
Top three noisy pixels from each quadrant. If the there are fewer than three noisy pixels in the level2.evt file, extra rows are filled as -1
| Pixel properties | Quadrant properties | ||||||
|---|---|---|---|---|---|---|---|
| Quadrant | DetID | PixID | Counts | Sigma | Mean | Median | Sigma |
| A | 0 | 50 | 35499 | 216.09 | 787 | 768 | 160.7 |
| A | 13 | 251 | 19317 | 115.41 | 787 | 768 | 160.7 |
| A | 12 | 194 | 7953 | 44.7 | 787 | 768 | 160.7 |
| B | 4 | 48 | 209701 | 1380.47 | 799 | 779 | 151.3 |
| B | 15 | 204 | 19889 | 126.27 | 799 | 779 | 151.3 |
| B | 12 | 111 | 13443 | 83.68 | 799 | 779 | 151.3 |
| C | 1 | 16 | 265995 | 1478.55 | 784 | 785 | 179.4 |
| C | 13 | 61 | 6347 | 31.01 | 784 | 785 | 179.4 |
| C | 14 | 67 | 3597 | 15.68 | 784 | 785 | 179.4 |
| D | 11 | 145 | 3719267 | 20787.84 | 728 | 703 | 178.9 |
| D | 8 | 195 | 138073 | 767.94 | 728 | 703 | 178.9 |
| D | 2 | 136 | 115627 | 642.46 | 728 | 703 | 178.9 |
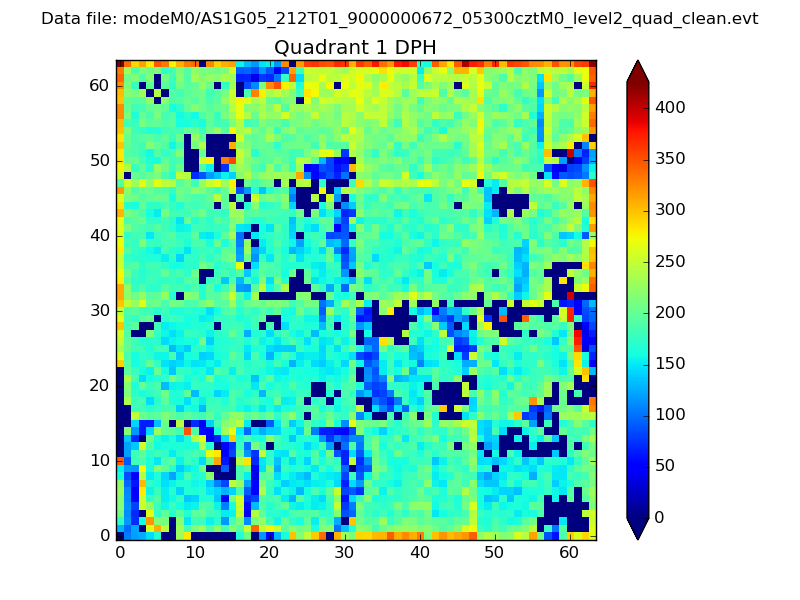
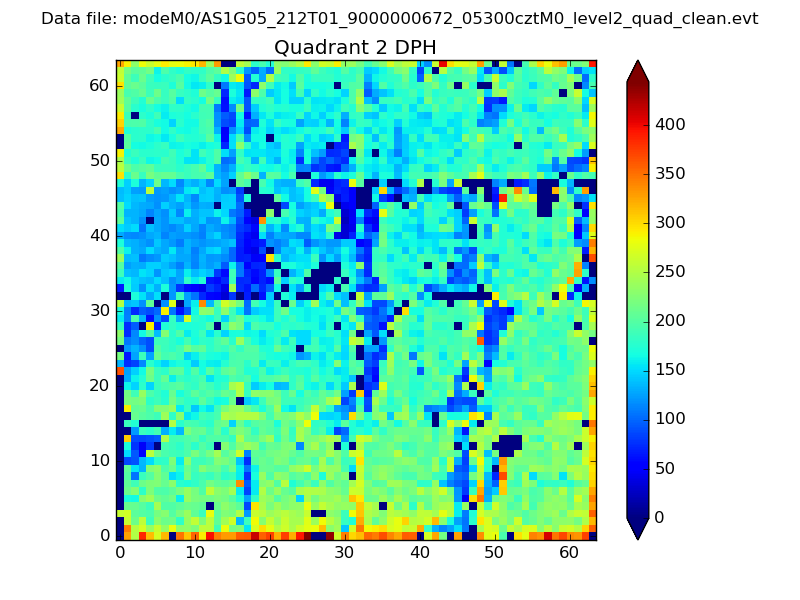
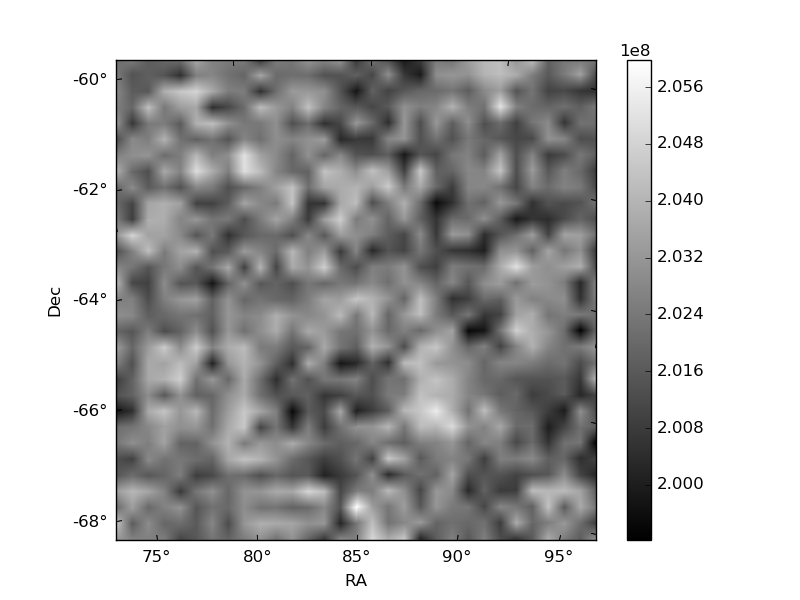
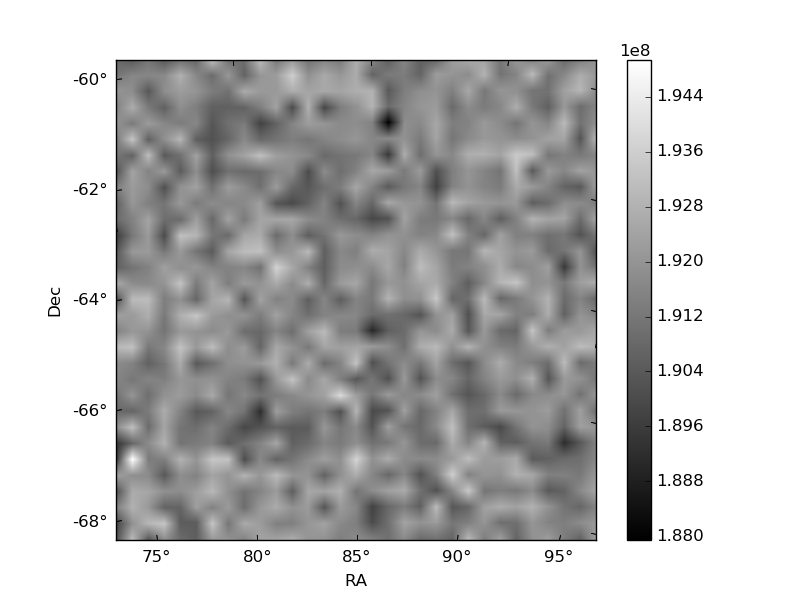
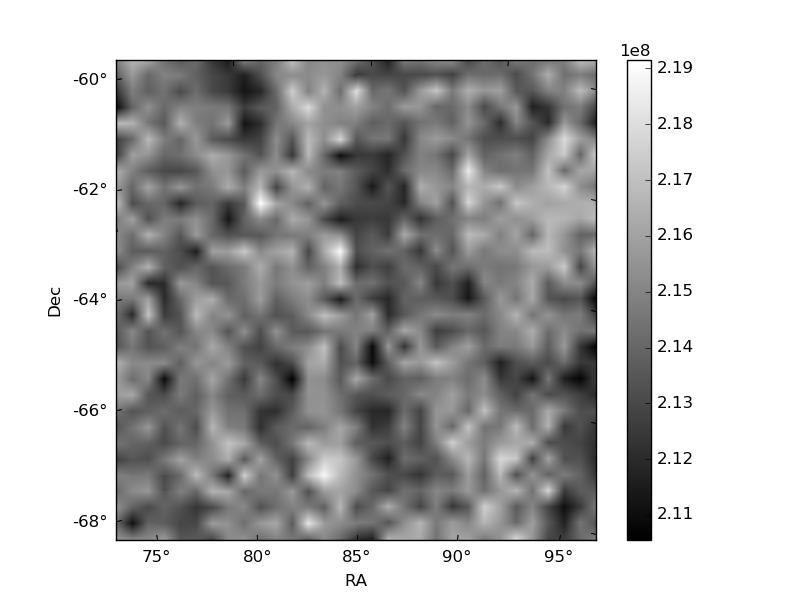
Histogram calculated using DETX and DETY for each event in the final _common_clean file
| Quadrant A | 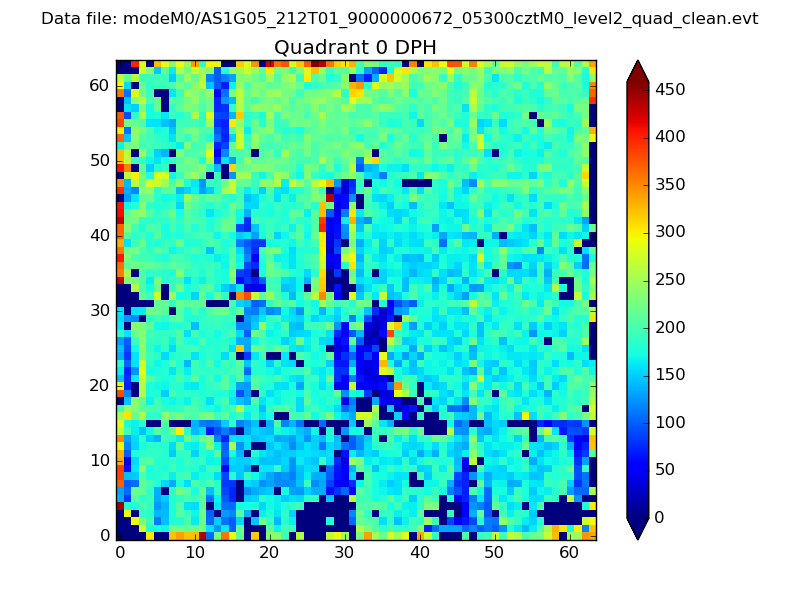 |
 |
Quadrant B |
|---|---|---|---|
| Quadrant D | 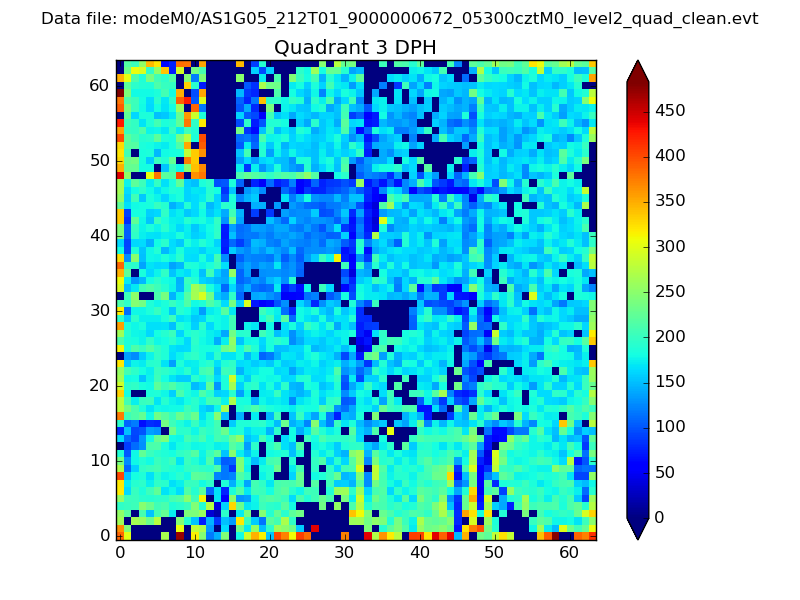 |
 |
Quadrant C |
| Plot type | Count rate plots | Images |
|---|---|---|
| Comparison with Poisson distribution Blue bars denote a histogram of data divided into 1 sec bins. Red curve is a Poisson curve with rate = median count rate of data. |
 |
 |
| Quadrant-wise count rates Data is divided into 100 sec bins |
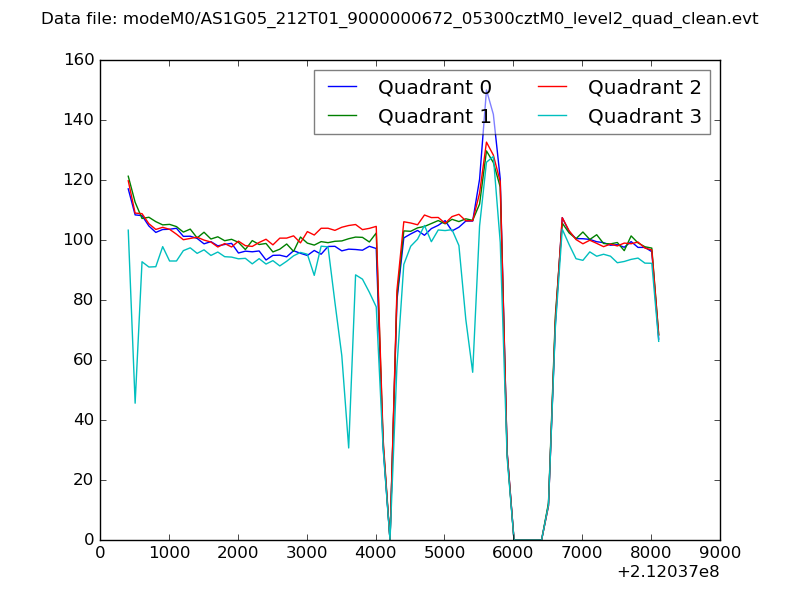 |
|
| Module-wise count rates for Quadrant A Data is divided into 100 sec bins |
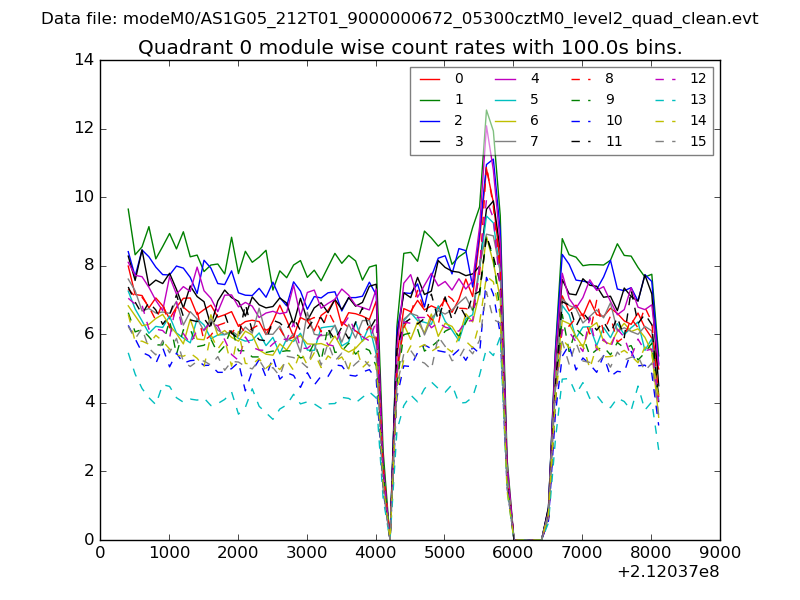 |
 |
| Module-wise count rates for Quadrant B Data is divided into 100 sec bins |
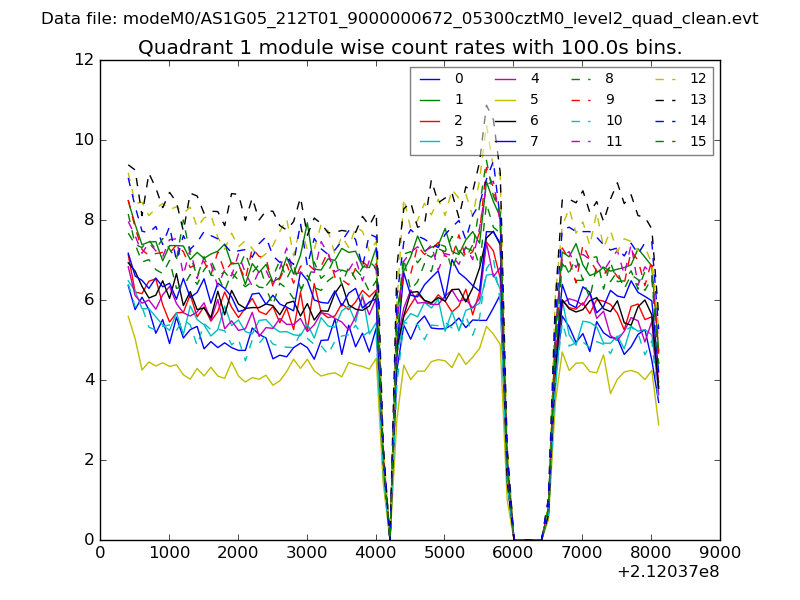 |
 |
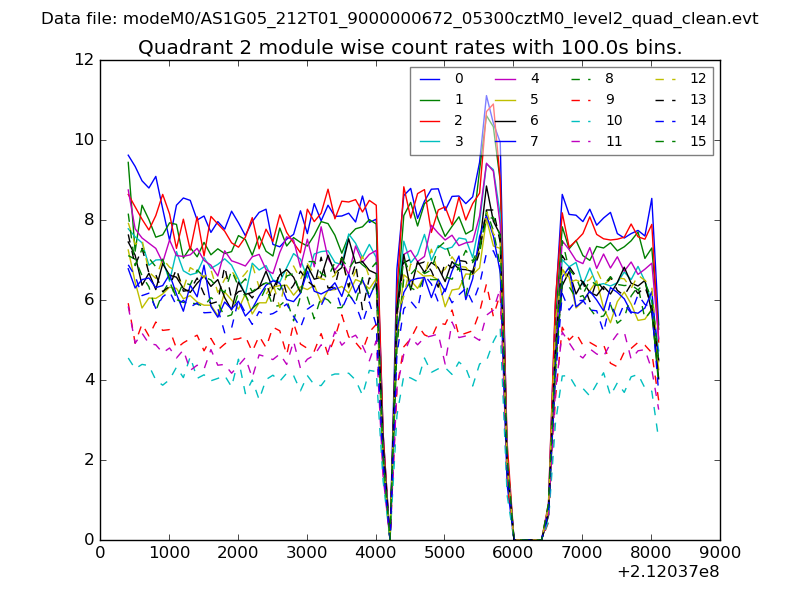
| Module-wise count rates for Quadrant C Data is divided into 100 sec bins |
 |
 |
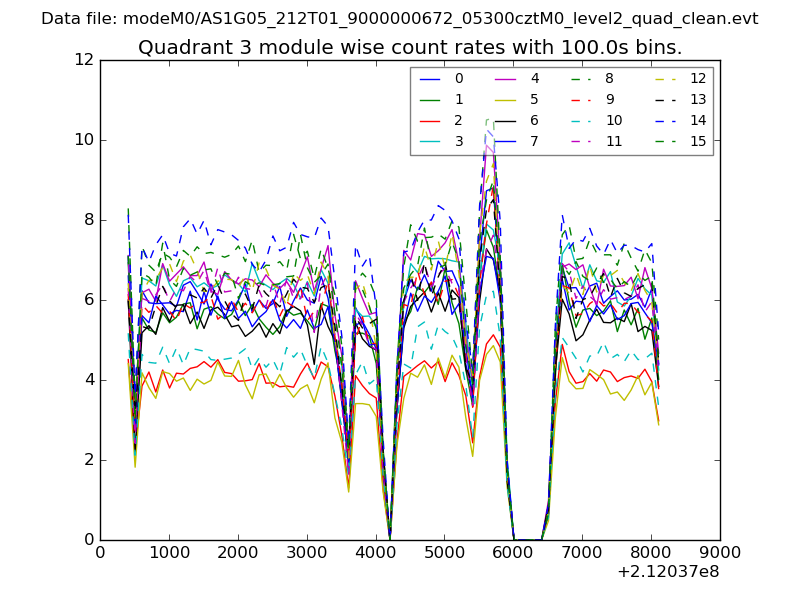
| Module-wise count rates for Quadrant D Data is divided into 100 sec bins |
 |
 |
| Parameter | Plot |
|---|---|
| CZT HV Monitor | 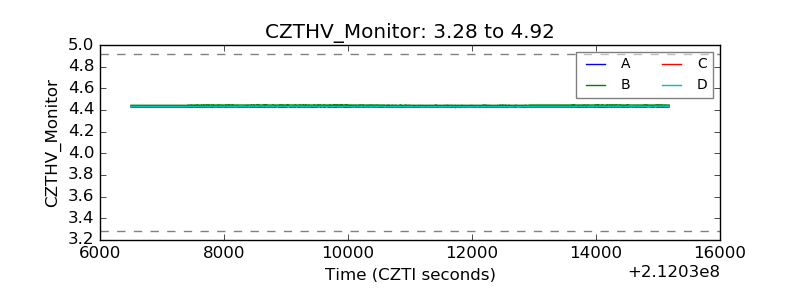 |
| D_VDD | 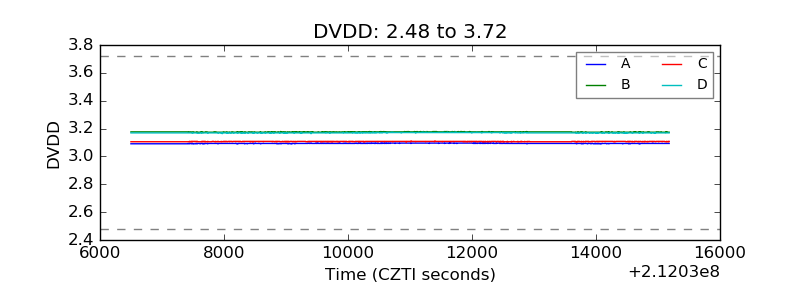 |
| Temperature 1 | 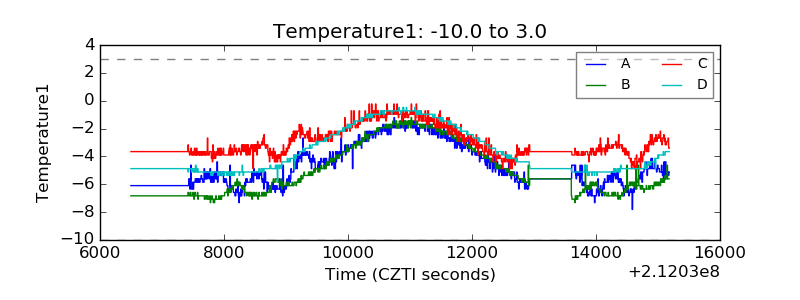 |
| Veto HV Monitor | 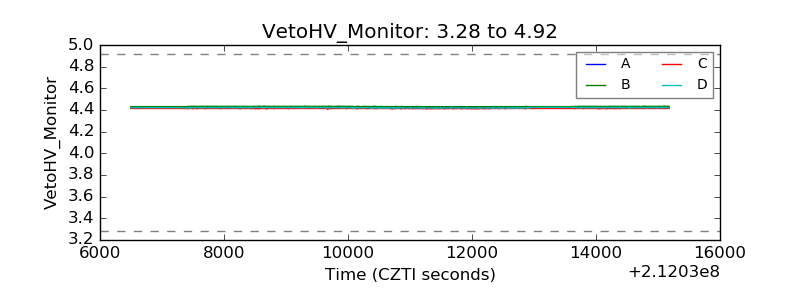 |
| Veto LLD | 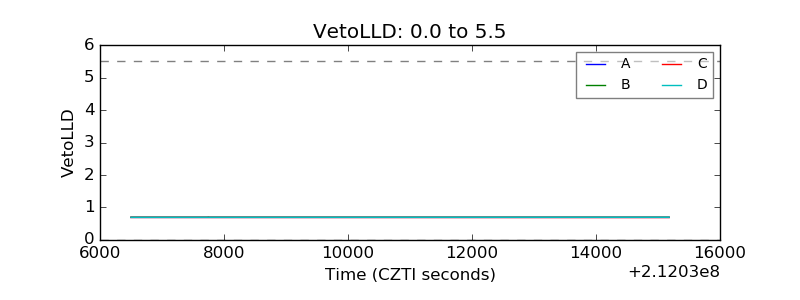 |
| Alpha Counter | 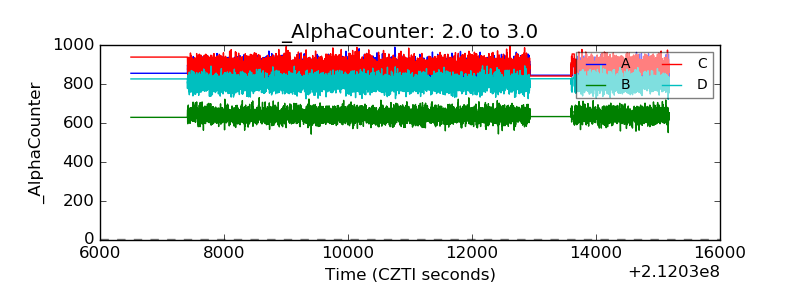 |
| _CPM_Rate | 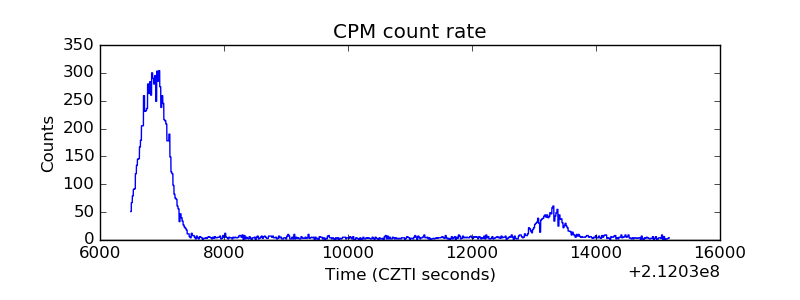 |
| CZT Counter | 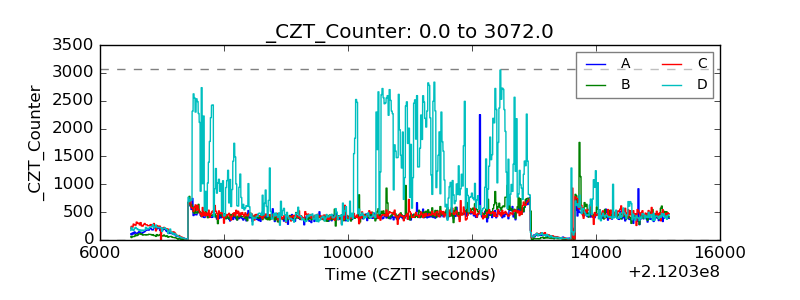 |
| +2.5 Volts monitor |  |
| +5 Volts monitor |  |
| _ROLL_ROT | 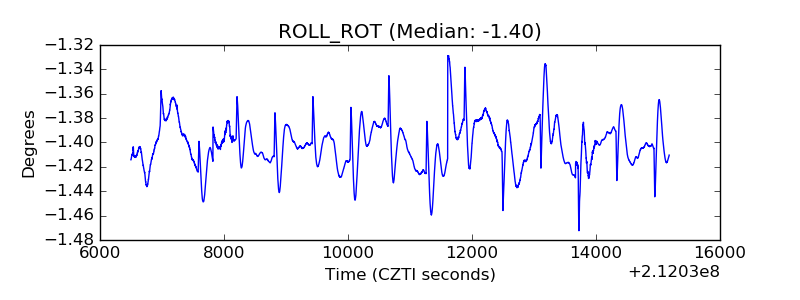 |
| _Roll_DEC | 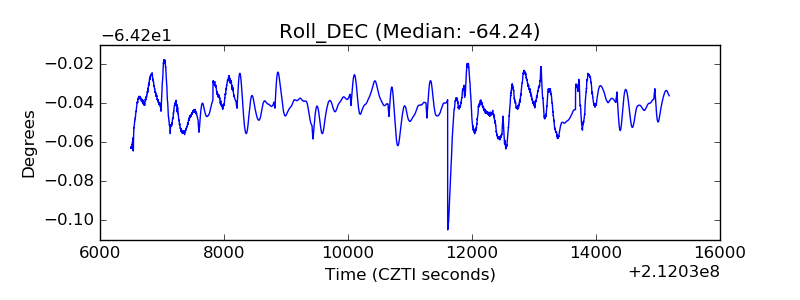 |
| _Roll_RA | 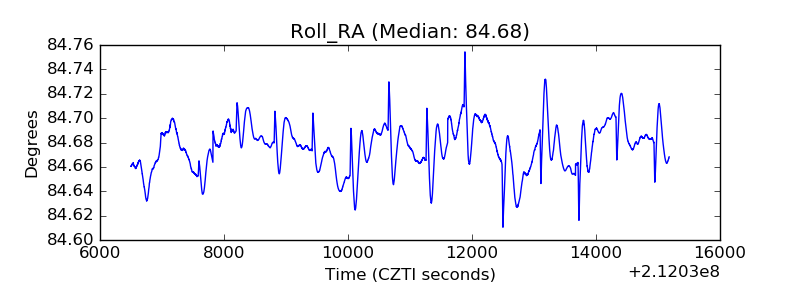 |
| Veto Counter | 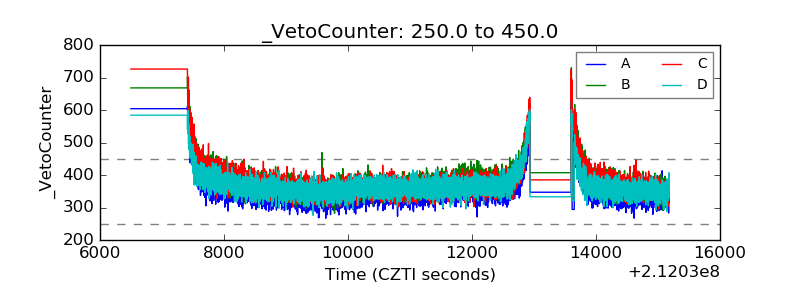 |