| Param | Original file | Final file |
|---|---|---|
| Filename | modeM0/AS1G05_212T01_9000000672_05301cztM0_level2.evt | modeM0/AS1G05_212T01_9000000672_05301cztM0_level2_quad_clean.evt |
| Size (bytes) | 91,425,600 | 22,982,400 |
| Size | 87.2 MB | 21.9 MB |
| Events in quadrant A | 609,835 | 146,523 |
| Events in quadrant B | 653,773 | 148,957 |
| Events in quadrant C | 693,831 | 148,892 |
| Events in quadrant D | 705,077 | 138,796 |
| Mode M0 | |||
|---|---|---|---|
| Quadrant | BADHDUFLAG | Total packets | Discarded packets |
| A | 0 | 3057 | 6 |
| B | 0 | 3062 | 12 |
| C | 0 | 3063 | 6 |
| D | 0 | 3262 | 8 |
| Mode SS | |||
|---|---|---|---|
| Quadrant | BADHDUFLAG | Total packets | Discarded packets |
| A | 0 | 30 | 0 |
| B | 0 | 30 | 0 |
| C | 0 | 30 | 0 |
| D | 0 | 30 | 0 |
| Quadrant | Total seconds | Saturated seconds | Saturation percentage |
|---|---|---|---|
| A | 1524 | 0 | 0.000000% |
| B | 1521 | 0 | 0.000000% |
| C | 1524 | 0 | 0.000000% |
| D | 1501 | 10 | 0.666223% |
Noise dominated data is calculated using 1-second bins in cleaned event files. If a bin has >2000 counts, and if more than 50% of those come from <1% of pixels, then it is considered to be noise-dominated and hence unusable.
| Quadrant | # 1 sec bins | Bins with >0 counts | Bins with >2000 counts | High rate bins dominated by noise | Noise dominated (total time) | Noise dominated (detector-on time) | Marked lightcurve |
|---|---|---|---|---|---|---|---|
| A | 1527 | 1527 | 0 | 0 | 0.00% | 0.00% | 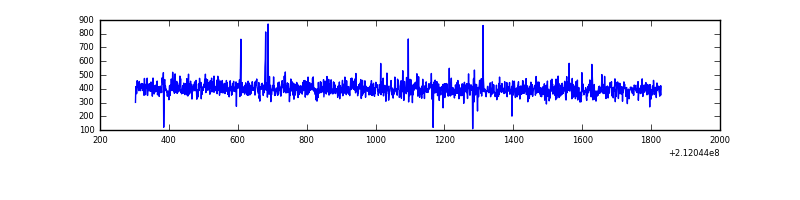 |
| B | 1527 | 1527 | 0 | 0 | 0.00% | 0.00% | 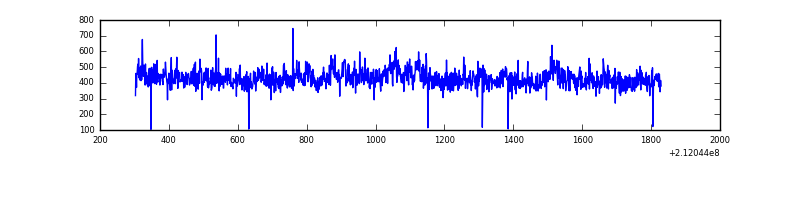 |
| C | 1527 | 1527 | 0 | 0 | 0.00% | 0.00% | 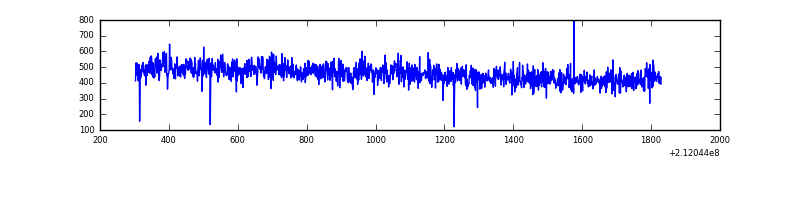 |
| D | 1527 | 1505 | 9 | 9 | 0.59% | 0.60% | 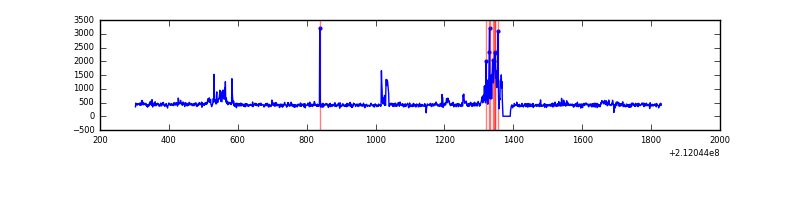 |
Top three noisy pixels from each quadrant. If the there are fewer than three noisy pixels in the level2.evt file, extra rows are filled as -1
| Pixel properties | Quadrant properties | ||||||
|---|---|---|---|---|---|---|---|
| Quadrant | DetID | PixID | Counts | Sigma | Mean | Median | Sigma |
| A | 13 | 251 | 2683 | 74.1 | 157 | 153 | 34.1 |
| A | 12 | 194 | 1575 | 41.65 | 157 | 153 | 34.1 |
| A | 0 | 226 | 1467 | 38.49 | 157 | 153 | 34.1 |
| B | 4 | 48 | 37585 | 1159.39 | 159 | 155 | 32.3 |
| B | 12 | 111 | 2847 | 83.38 | 159 | 155 | 32.3 |
| B | 11 | 111 | 2201 | 63.37 | 159 | 155 | 32.3 |
| C | 1 | 16 | 68560 | 1777.92 | 159 | 160 | 38.5 |
| C | 13 | 61 | 1295 | 29.5 | 159 | 160 | 38.5 |
| C | 14 | 67 | 994 | 21.68 | 159 | 160 | 38.5 |
| D | 11 | 145 | 76518 | 1925.75 | 155 | 150 | 39.7 |
| D | 8 | 195 | 25691 | 644.06 | 155 | 150 | 39.7 |
| D | 13 | 137 | 10388 | 258.17 | 155 | 150 | 39.7 |
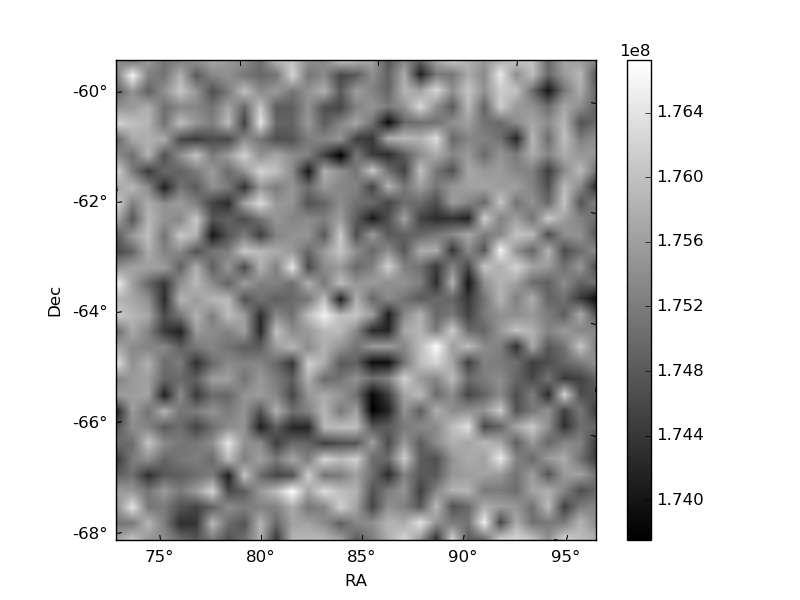
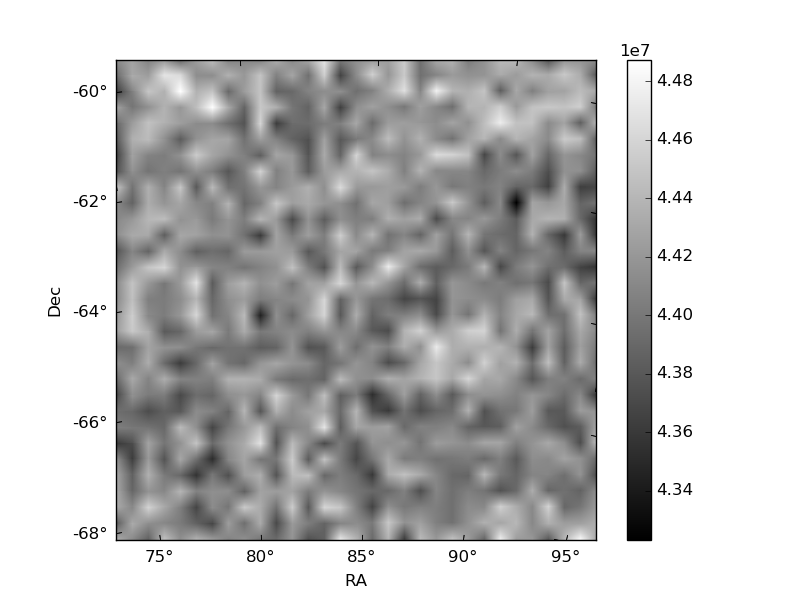
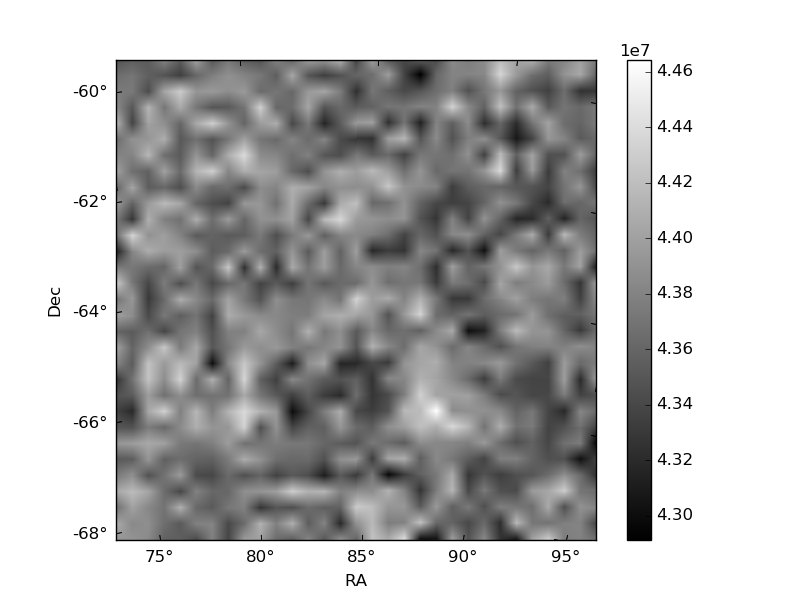
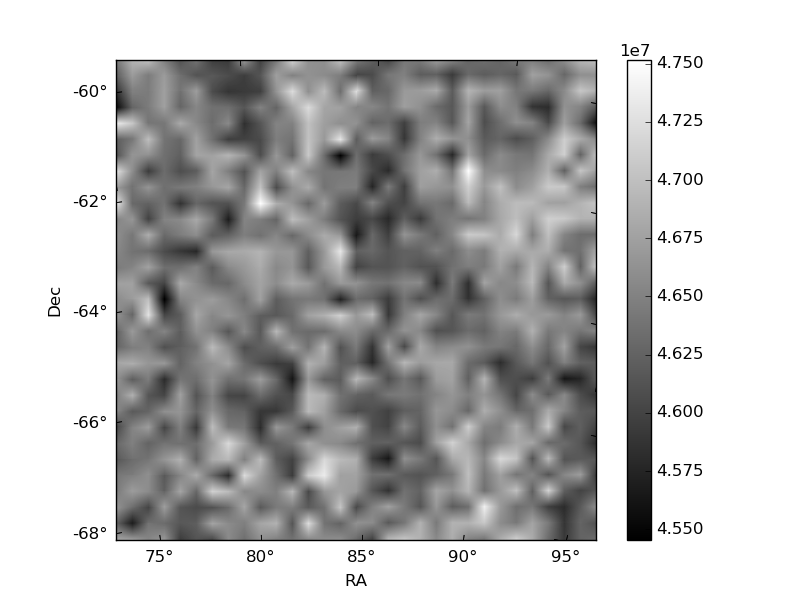
Histogram calculated using DETX and DETY for each event in the final _common_clean file
| Quadrant A | 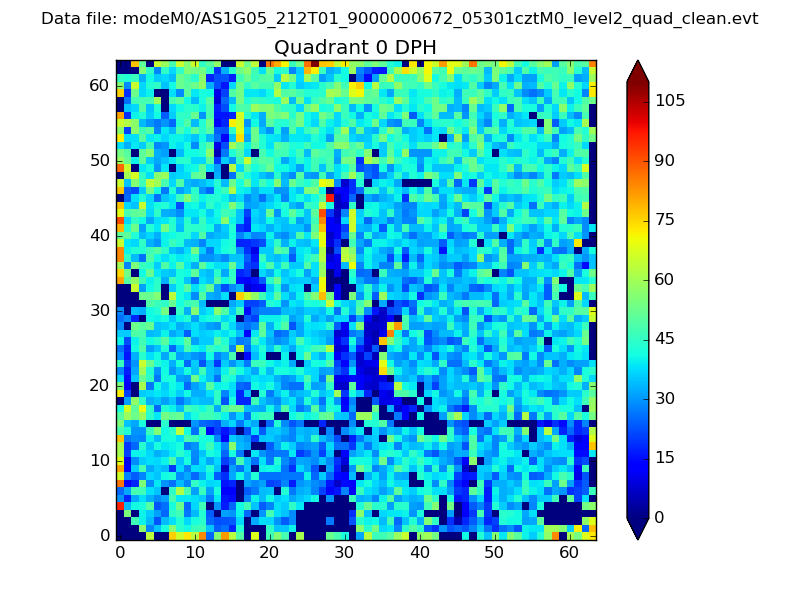 |
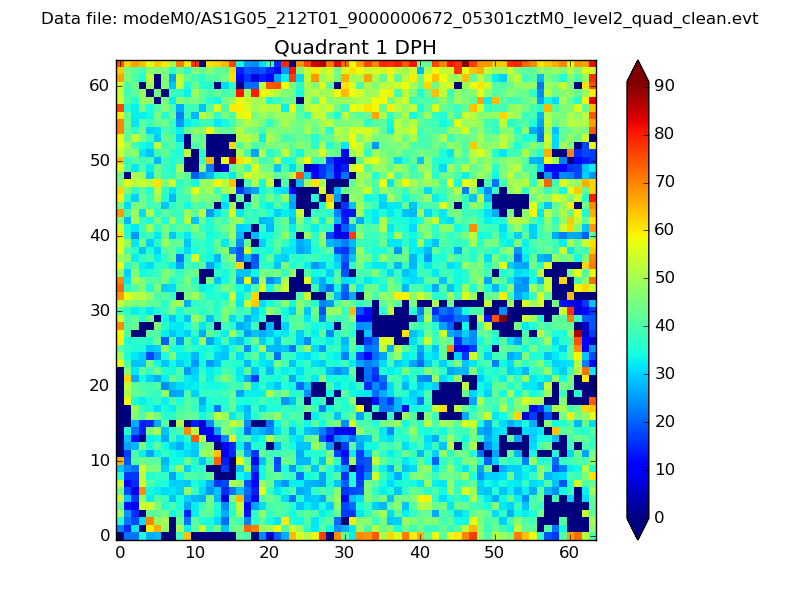 |
Quadrant B |
|---|---|---|---|
| Quadrant D | 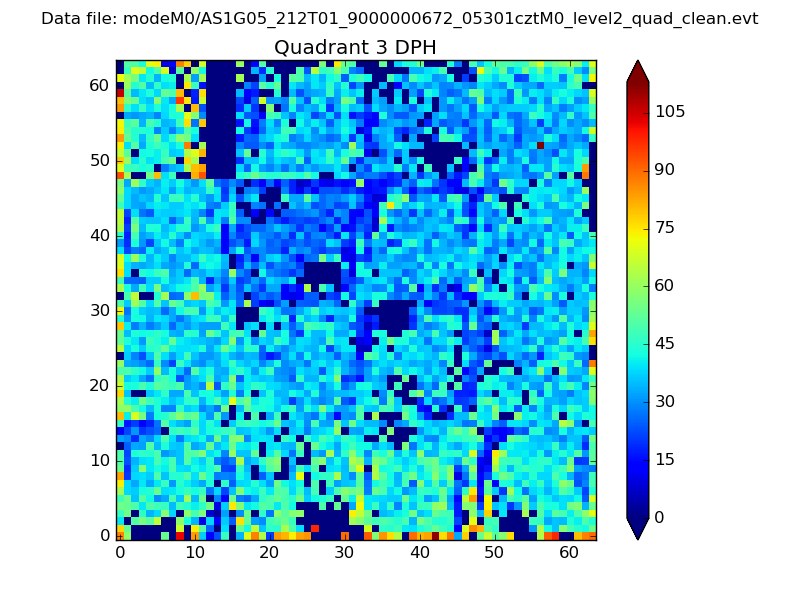 |
 |
Quadrant C |
| Plot type | Count rate plots | Images |
|---|---|---|
| Comparison with Poisson distribution Blue bars denote a histogram of data divided into 1 sec bins. Red curve is a Poisson curve with rate = median count rate of data. |
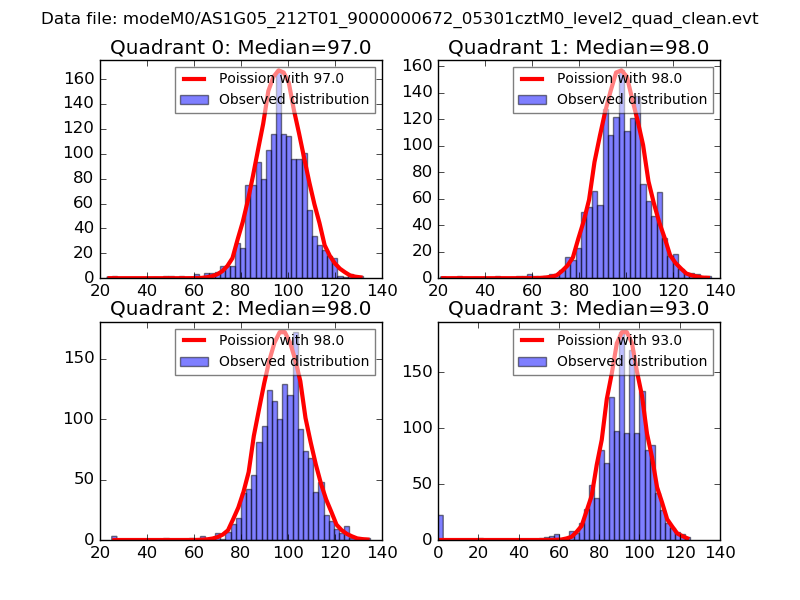 |
 |
| Quadrant-wise count rates Data is divided into 100 sec bins |
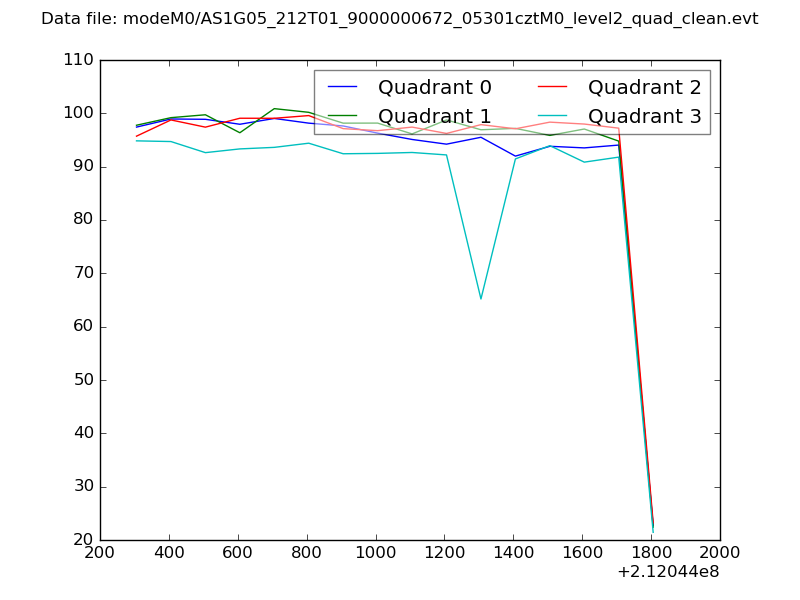 |
|
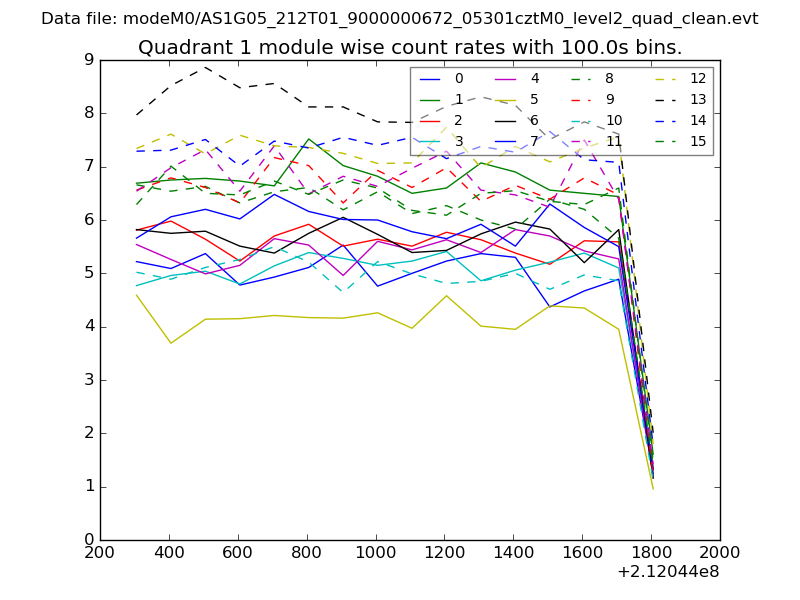
| Module-wise count rates for Quadrant A Data is divided into 100 sec bins |
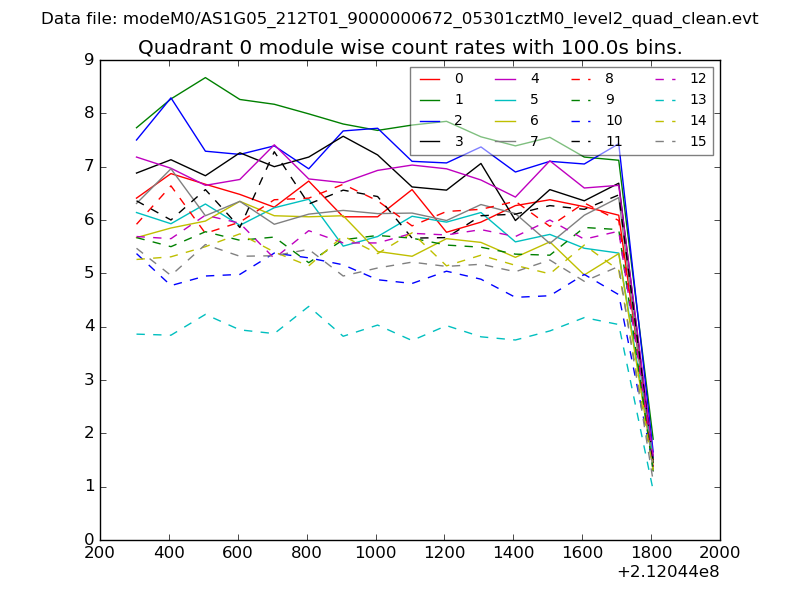 |
 |
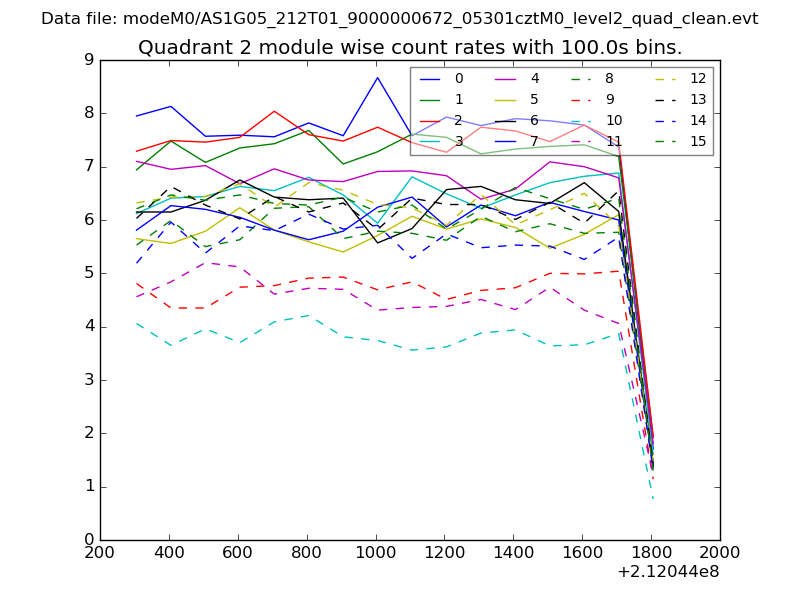
| Module-wise count rates for Quadrant B Data is divided into 100 sec bins |
 |
 |
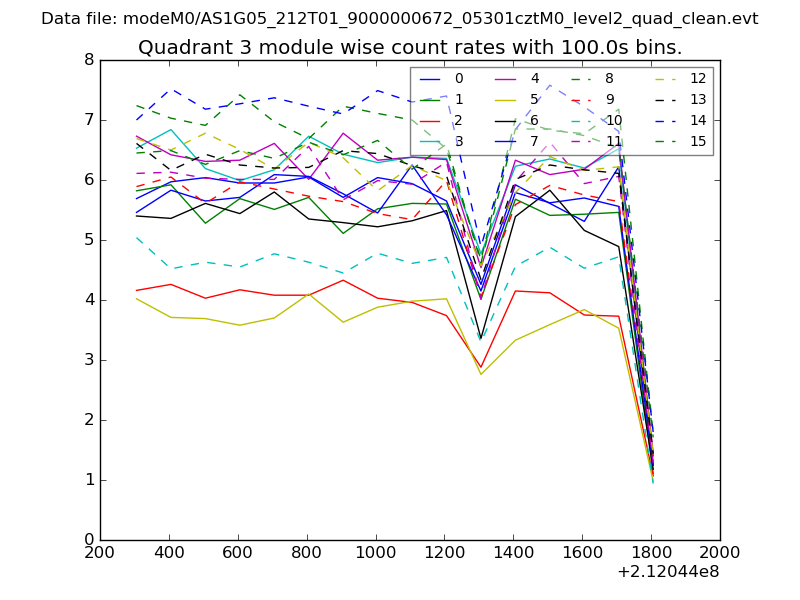
| Module-wise count rates for Quadrant C Data is divided into 100 sec bins |
 |
 |
| Module-wise count rates for Quadrant D Data is divided into 100 sec bins |
 |
 |
| Parameter | Plot |
|---|---|
| CZT HV Monitor | 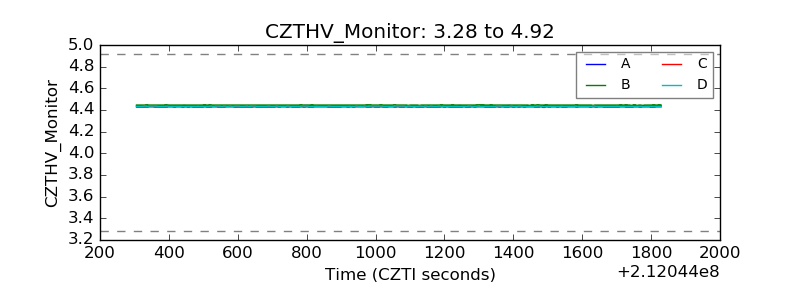 |
| D_VDD |  |
| Temperature 1 | 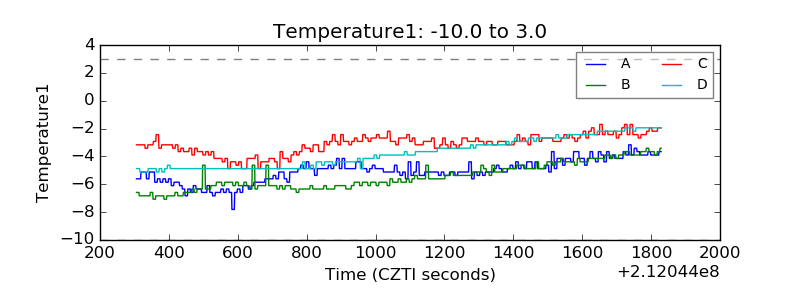 |
| Veto HV Monitor | 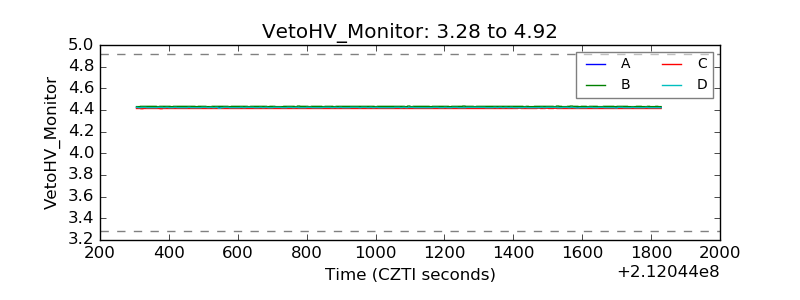 |
| Veto LLD | 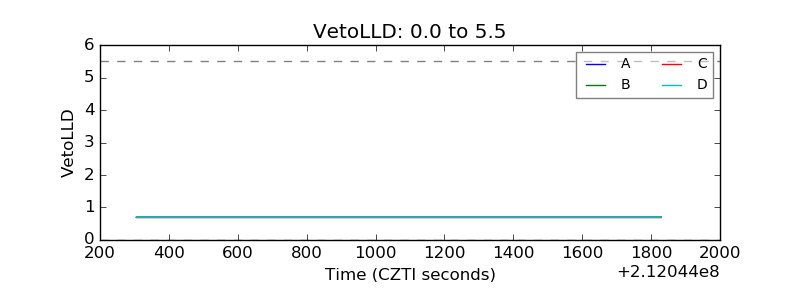 |
| Alpha Counter | 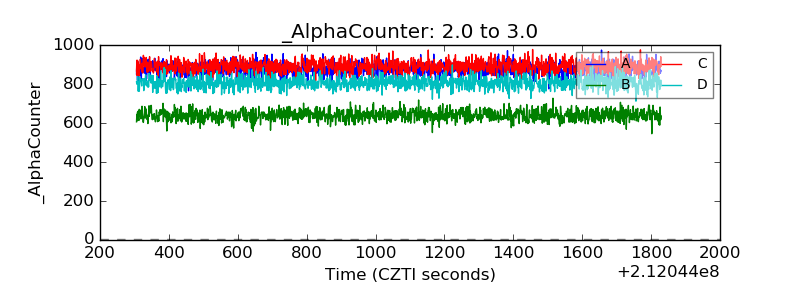 |
| _CPM_Rate | 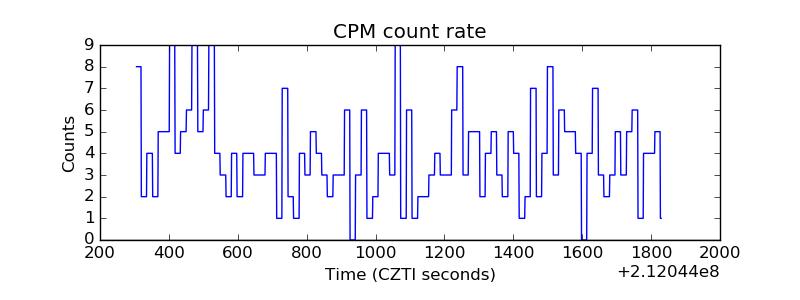 |
| CZT Counter |  |
| +2.5 Volts monitor |  |
| +5 Volts monitor |  |
| _ROLL_ROT | 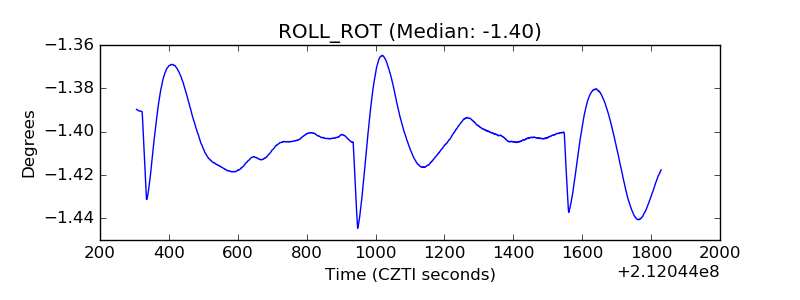 |
| _Roll_DEC | 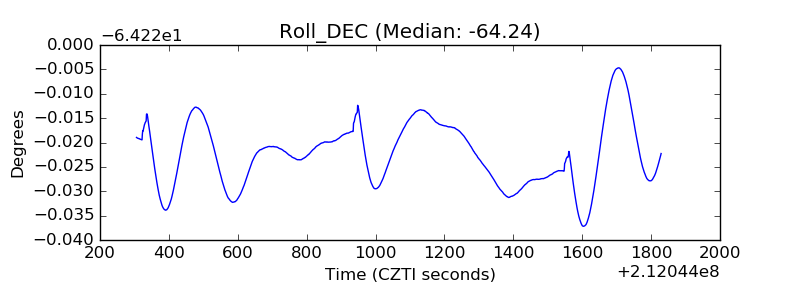 |
| _Roll_RA | 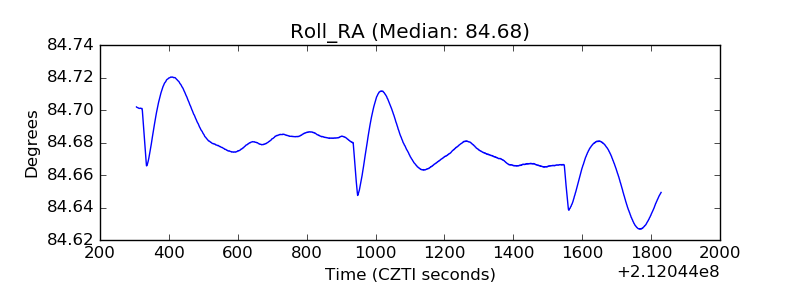 |
| Veto Counter | 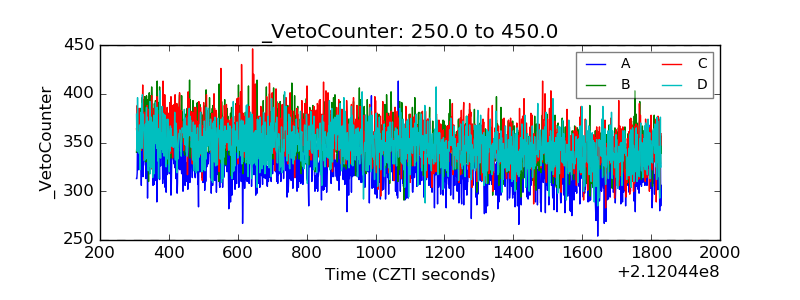 |