| Param | Original file | Final file |
|---|---|---|
| Filename | modeM0/AS1G05_240T01_9000000674cztM0_level2.fits | modeM0/AS1G05_240T01_9000000674cztM0_level2_quad_clean.evt |
| Size (bytes) | 1,637,026,560 | 1,722,041,280 |
| Size | 1.5 GB | 1.6 GB |
| Events in quadrant A | 9,758,130 | 10,381,906 |
| Events in quadrant B | 9,536,052 | 10,577,837 |
| Events in quadrant C | 9,681,602 | 9,866,886 |
| Events in quadrant D | 8,306,040 | 9,038,080 |
| Mode M0 | |||
|---|---|---|---|
| Quadrant | BADHDUFLAG | Total packets | Discarded packets |
| A | 0 | 376507 | 0 |
| B | 0 | 385848 | 0 |
| C | 0 | 386138 | 0 |
| D | 0 | 399778 | 0 |
| Mode SS | |||
|---|---|---|---|
| Quadrant | BADHDUFLAG | Total packets | Discarded packets |
| A | 0 | 3656 | 0 |
| B | 0 | 3662 | 0 |
| C | 0 | 3644 | 0 |
| D | 0 | 3654 | 0 |
| Mode M9 | |||
|---|---|---|---|
| Quadrant | BADHDUFLAG | Total packets | Discarded packets |
| A | 0 | 261 | 0 |
| B | 0 | 264 | 0 |
| C | 0 | 266 | 0 |
| D | 0 | 265 | 0 |
| Quadrant | Total seconds | Saturated seconds | Saturation percentage |
|---|---|---|---|
| A | 179520 | 2868 | 1.597594% |
| B | 179481 | 3092 | 1.722745% |
| C | 179027 | 1822 | 1.017724% |
| D | 179435 | 3650 | 2.034163% |
Noise dominated data is calculated using 1-second bins in cleaned event files. If a bin has >2000 counts, and if more than 50% of those come from <1% of pixels, then it is considered to be noise-dominated and hence unusable.
| Quadrant | # 1 sec bins | Bins with >0 counts | Bins with >2000 counts | High rate bins dominated by noise | Noise dominated (total time) | Noise dominated (detector-on time) | Marked lightcurve |
|---|---|---|---|---|---|---|---|
| A | 226382 | 181837 | 0 | 0 | 0.00% | 0.00% |  |
| B | 226382 | 181830 | 0 | 0 | 0.00% | 0.00% |  |
| C | 226382 | 181500 | 0 | 0 | 0.00% | 0.00% |  |
| D | 226382 | 181742 | 0 | 0 | 0.00% | 0.00% |  |
Top three noisy pixels from each quadrant. If the there are fewer than three noisy pixels in the level2.evt file, extra rows are filled as -1
| Pixel properties | Quadrant properties | ||||||
|---|---|---|---|---|---|---|---|
| Quadrant | DetID | PixID | Counts | Sigma | Mean | Median | Sigma |
| A | 0 | 29 | 9365 | 10.68 | 2537 | 2355 | 656.1 |
| A | 7 | 110 | 8322 | 9.09 | 2537 | 2355 | 656.1 |
| A | 0 | 30 | 7364 | 7.63 | 2537 | 2355 | 656.1 |
| B | 2 | 9 | 8320 | 11.77 | 2513 | 2384 | 504.2 |
| B | 12 | 226 | 6531 | 8.22 | 2513 | 2384 | 504.2 |
| B | 3 | 17 | 6461 | 8.09 | 2513 | 2384 | 504.2 |
| C | 1 | 80 | 7133 | 7.0 | 2558 | 2359 | 681.9 |
| C | 1 | 81 | 7045 | 6.87 | 2558 | 2359 | 681.9 |
| C | 12 | 241 | 6858 | 6.6 | 2558 | 2359 | 681.9 |
| D | 11 | 82 | 6353 | 6.68 | 2365 | 2146 | 629.8 |
| D | 3 | 14 | 6157 | 6.37 | 2365 | 2146 | 629.8 |
| D | 6 | 231 | 5989 | 6.1 | 2365 | 2146 | 629.8 |
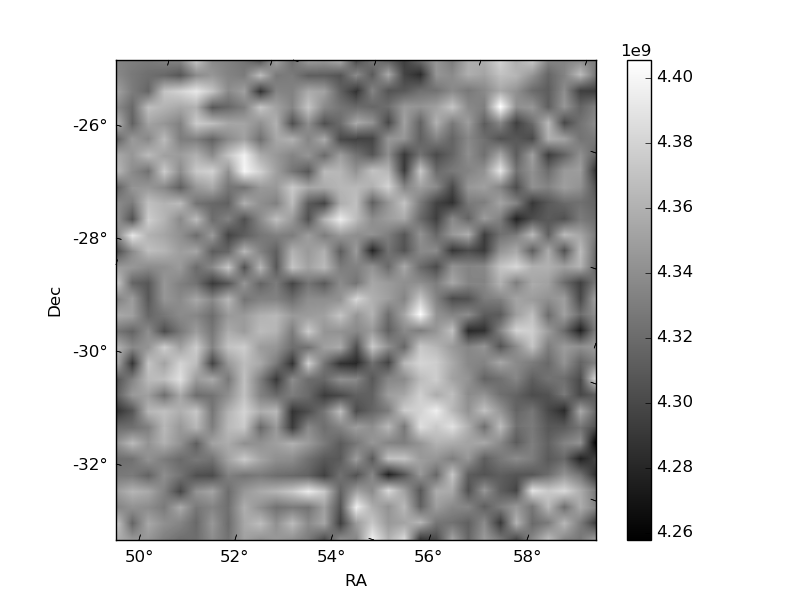
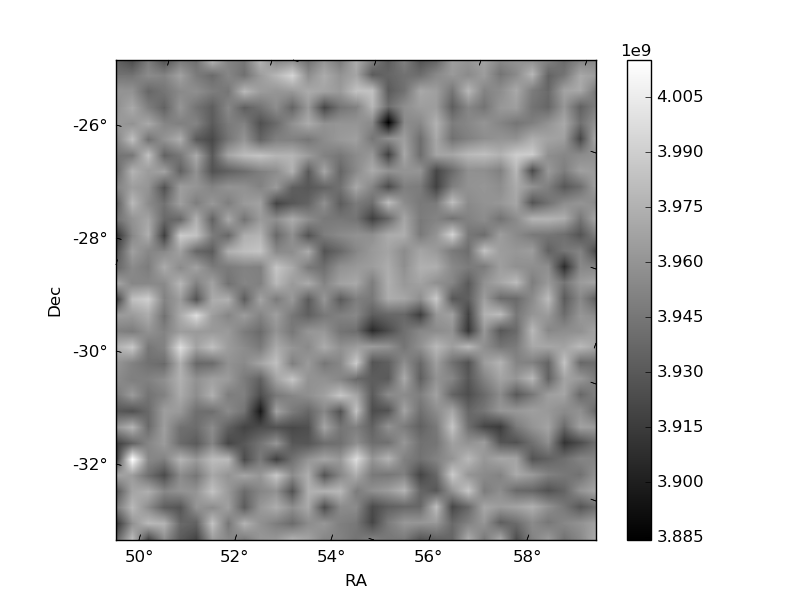
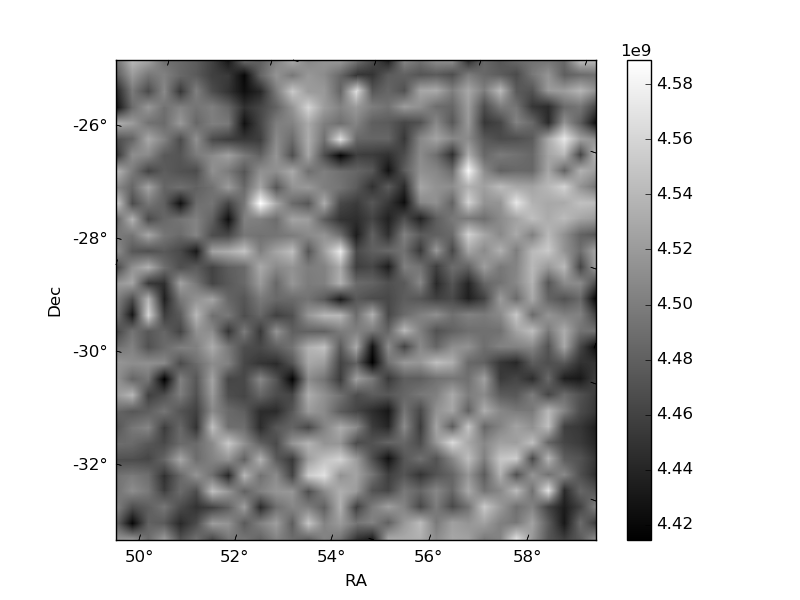
Histogram calculated using DETX and DETY for each event in the final _common_clean file
| Quadrant A | 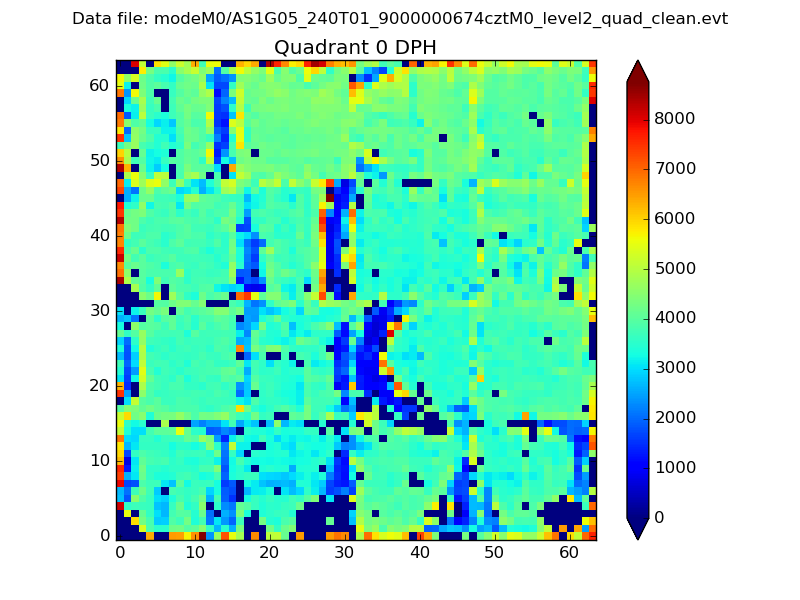 |
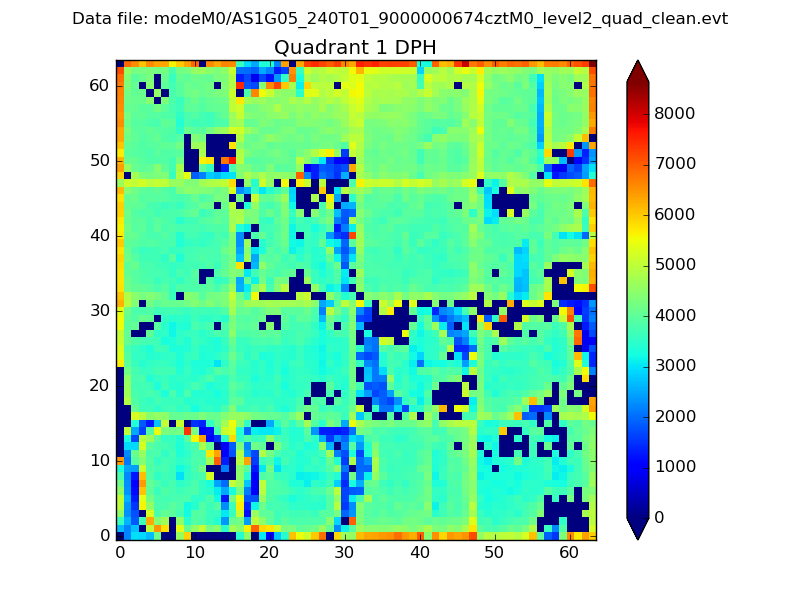 |
Quadrant B |
|---|---|---|---|
| Quadrant D | 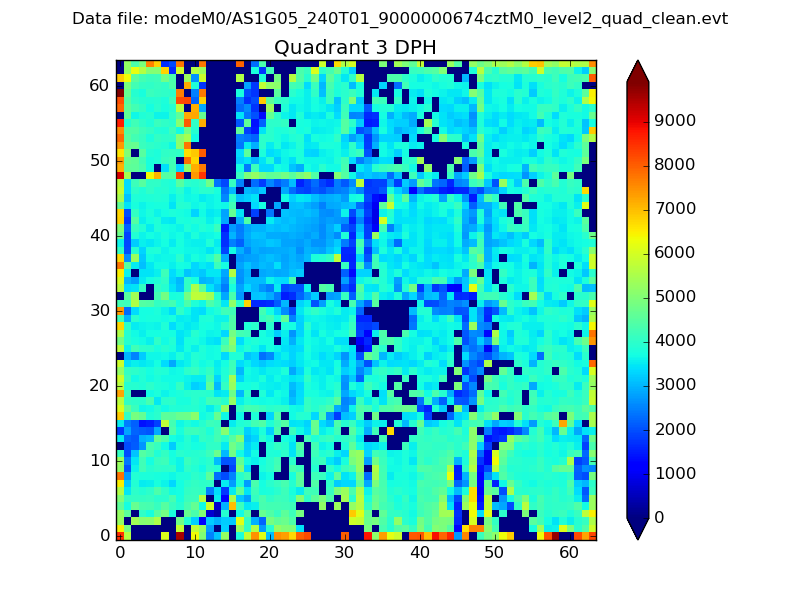 |
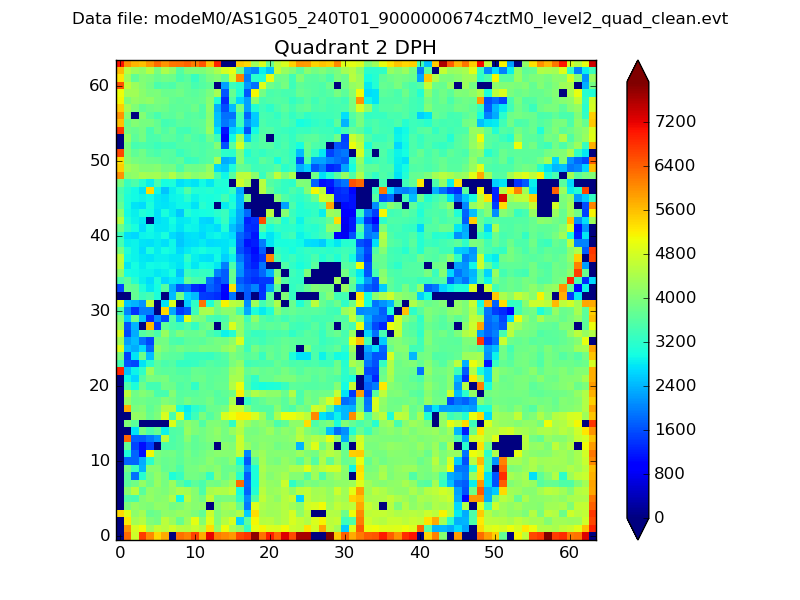 |
Quadrant C |
| Plot type | Count rate plots | Images |
|---|---|---|
| Comparison with Poisson distribution Blue bars denote a histogram of data divided into 1 sec bins. Red curve is a Poisson curve with rate = median count rate of data. |
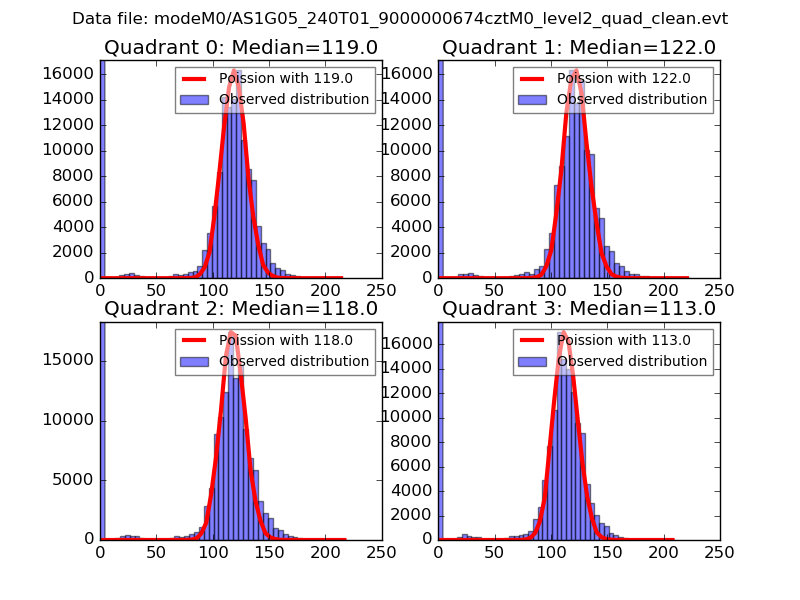 |
 |
| Quadrant-wise count rates Data is divided into 100 sec bins |
 |
|
| Module-wise count rates for Quadrant A Data is divided into 100 sec bins |
 |
 |
| Module-wise count rates for Quadrant B Data is divided into 100 sec bins |
 |
 |
| Module-wise count rates for Quadrant C Data is divided into 100 sec bins |
 |
 |
| Module-wise count rates for Quadrant D Data is divided into 100 sec bins |
 |
 |
| Parameter | Plot |
|---|---|
| CZT HV Monitor |  |
| D_VDD |  |
| Temperature 1 | 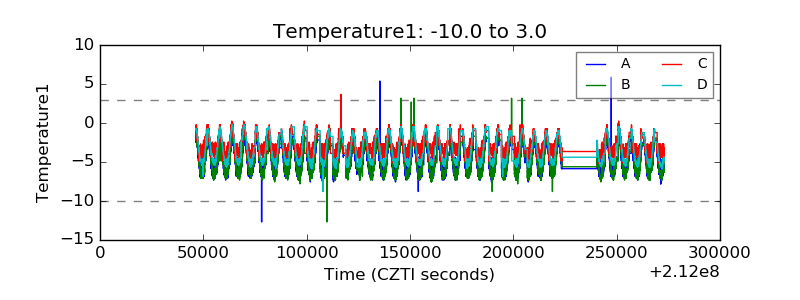 |
| Veto HV Monitor |  |
| Veto LLD |  |
| Alpha Counter |  |
| _CPM_Rate |  |
| CZT Counter |  |
| +2.5 Volts monitor | 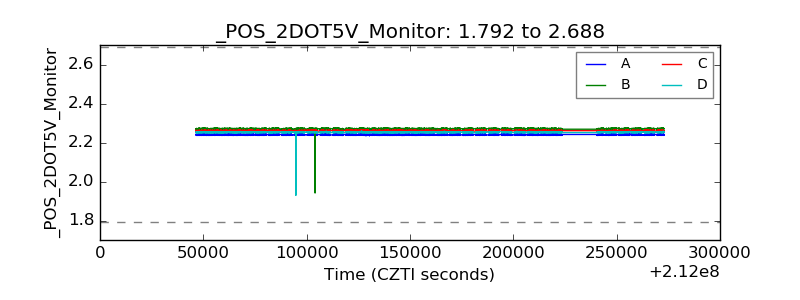 |
| +5 Volts monitor |  |
| _ROLL_ROT | 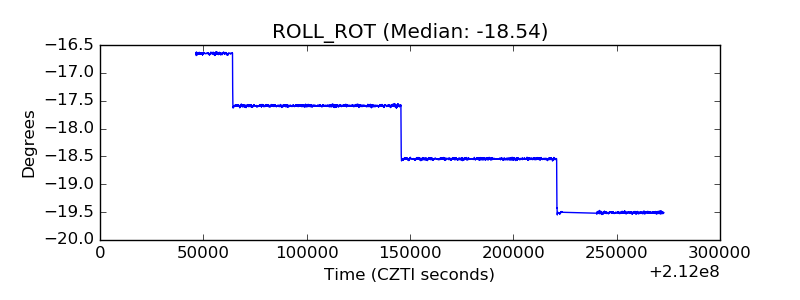 |
| _Roll_DEC | 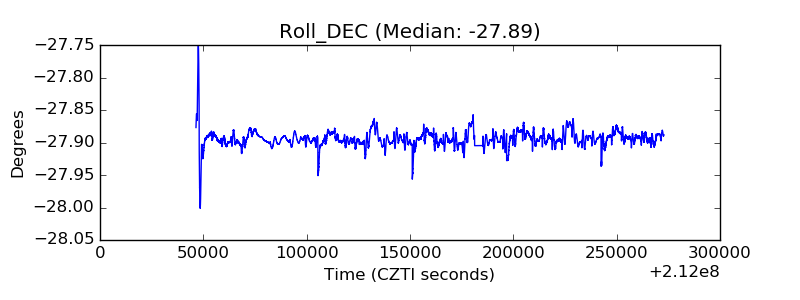 |
| _Roll_RA |  |
| Veto Counter | 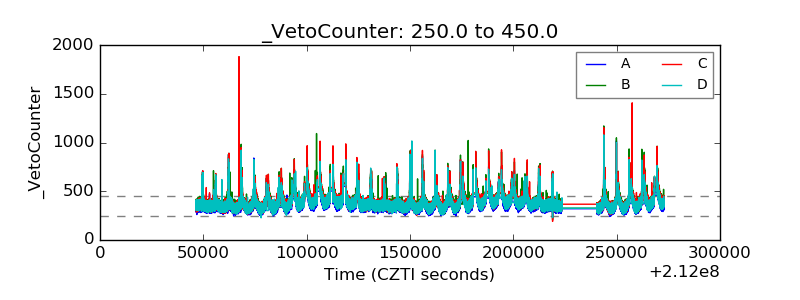 |