| Param | Original file | Final file |
|---|---|---|
| Filename | modeM0/AS1G05_240T01_9000000674_05301cztM0_level2.evt | modeM0/AS1G05_240T01_9000000674_05301cztM0_level2_quad_clean.evt |
| Size (bytes) | 350,985,600 | 61,686,720 |
| Size | 334.7 MB | 58.8 MB |
| Events in quadrant A | 2,379,620 | 391,310 |
| Events in quadrant B | 2,775,307 | 387,942 |
| Events in quadrant C | 2,434,364 | 378,148 |
| Events in quadrant D | 2,709,614 | 369,638 |
| Mode M0 | |||
|---|---|---|---|
| Quadrant | BADHDUFLAG | Total packets | Discarded packets |
| A | 0 | 10474 | 62 |
| B | 0 | 11605 | 102 |
| C | 0 | 10283 | 89 |
| D | 0 | 11365 | 69 |
| Mode SS | |||
|---|---|---|---|
| Quadrant | BADHDUFLAG | Total packets | Discarded packets |
| A | 0 | 98 | 0 |
| B | 0 | 98 | 0 |
| C | 0 | 98 | 0 |
| D | 0 | 98 | 0 |
| Mode M9 | |||
|---|---|---|---|
| Quadrant | BADHDUFLAG | Total packets | Discarded packets |
| A | 0 | 2 | 0 |
| B | 0 | 2 | 1 |
| C | 0 | 2 | 0 |
| D | 0 | 2 | 0 |
| Quadrant | Total seconds | Saturated seconds | Saturation percentage |
|---|---|---|---|
| A | 4867 | 266 | 5.465379% |
| B | 4852 | 265 | 5.461665% |
| C | 4854 | 206 | 4.243923% |
| D | 4865 | 269 | 5.529291% |
Noise dominated data is calculated using 1-second bins in cleaned event files. If a bin has >2000 counts, and if more than 50% of those come from <1% of pixels, then it is considered to be noise-dominated and hence unusable.
| Quadrant | # 1 sec bins | Bins with >0 counts | Bins with >2000 counts | High rate bins dominated by noise | Noise dominated (total time) | Noise dominated (detector-on time) | Marked lightcurve |
|---|---|---|---|---|---|---|---|
| A | 4946 | 4890 | 9 | 9 | 0.18% | 0.18% | 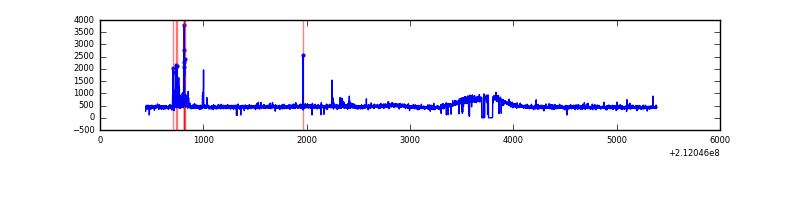 |
| B | 4946 | 4891 | 25 | 25 | 0.51% | 0.51% | 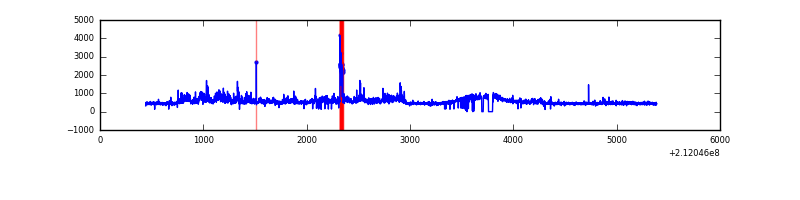 |
| C | 4946 | 4892 | 0 | 0 | 0.00% | 0.00% | 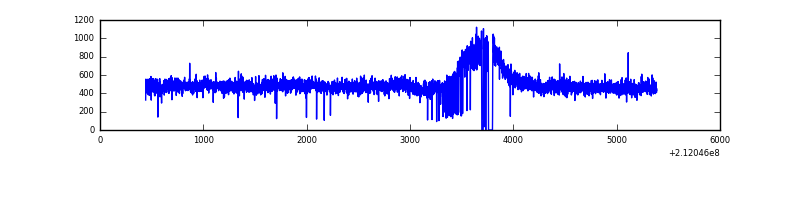 |
| D | 4946 | 4892 | 30 | 30 | 0.61% | 0.61% | 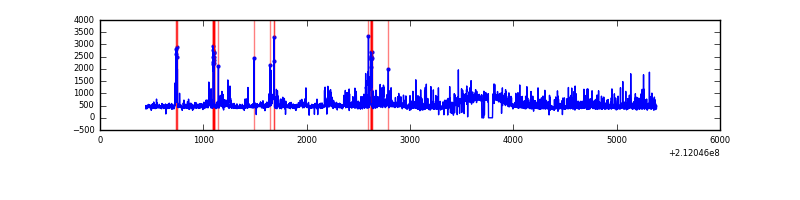 |
Top three noisy pixels from each quadrant. If the there are fewer than three noisy pixels in the level2.evt file, extra rows are filled as -1
| Pixel properties | Quadrant properties | ||||||
|---|---|---|---|---|---|---|---|
| Quadrant | DetID | PixID | Counts | Sigma | Mean | Median | Sigma |
| A | 0 | 50 | 87190 | 698.73 | 593 | 576 | 124.0 |
| A | 12 | 194 | 6000 | 43.75 | 593 | 576 | 124.0 |
| A | 13 | 251 | 5991 | 43.68 | 593 | 576 | 124.0 |
| B | 4 | 48 | 391592 | 3350.26 | 595 | 579 | 116.7 |
| B | 10 | 16 | 60495 | 513.37 | 595 | 579 | 116.7 |
| B | 12 | 111 | 10615 | 85.99 | 595 | 579 | 116.7 |
| C | 1 | 16 | 175138 | 1285.55 | 577 | 577 | 135.8 |
| C | 13 | 61 | 4725 | 30.55 | 577 | 577 | 135.8 |
| C | 14 | 67 | 2462 | 13.88 | 577 | 577 | 135.8 |
| D | 1 | 239 | 200130 | 1388.9 | 577 | 557 | 143.7 |
| D | 8 | 195 | 105144 | 727.86 | 577 | 557 | 143.7 |
| D | 2 | 136 | 52577 | 362.03 | 577 | 557 | 143.7 |
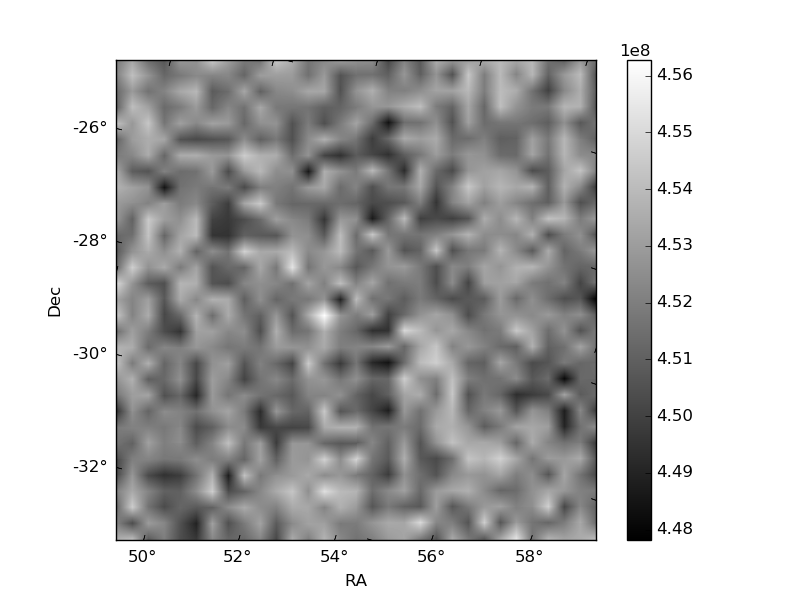
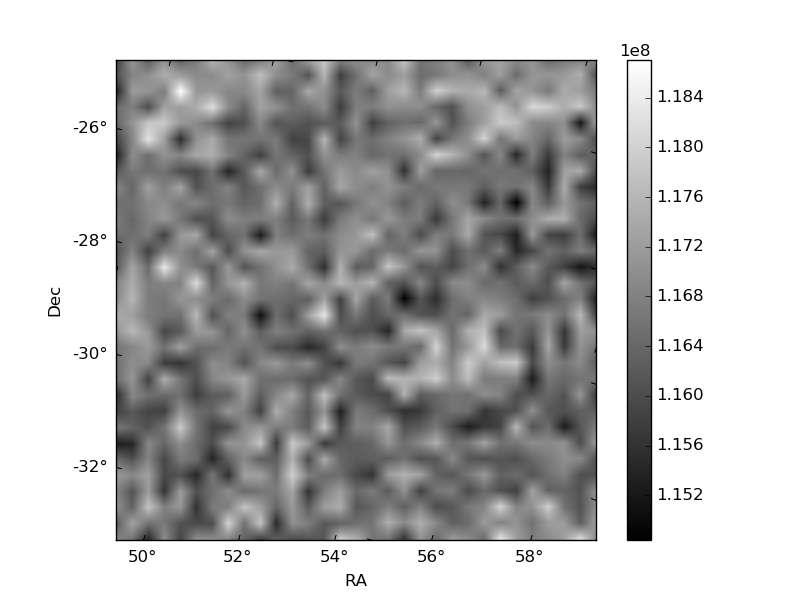
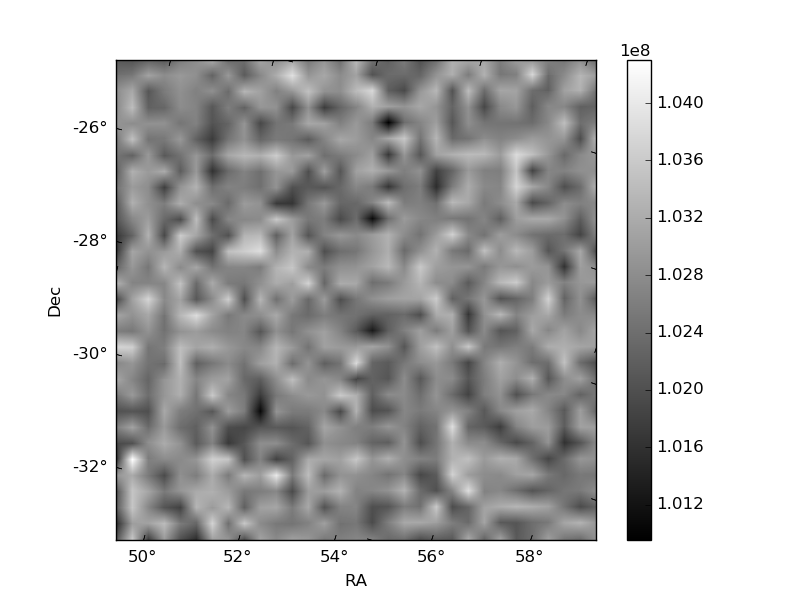
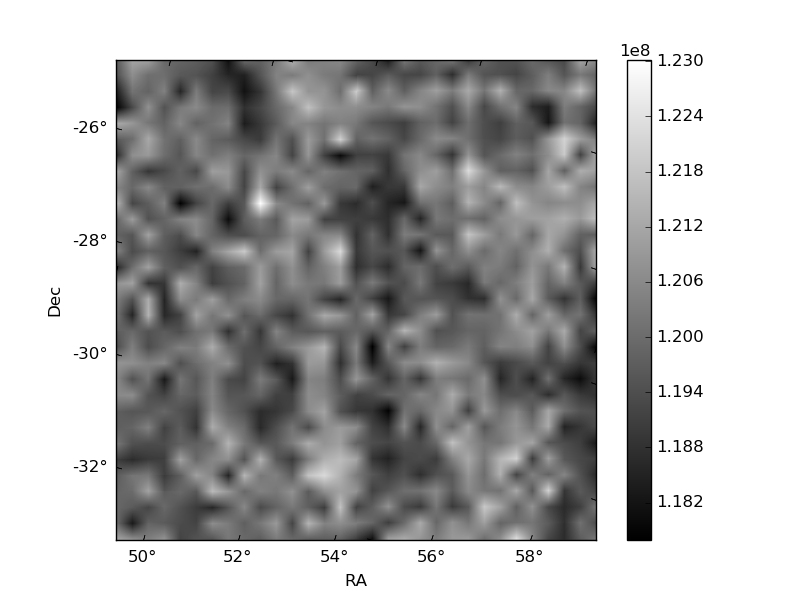
Histogram calculated using DETX and DETY for each event in the final _common_clean file
| Quadrant A | 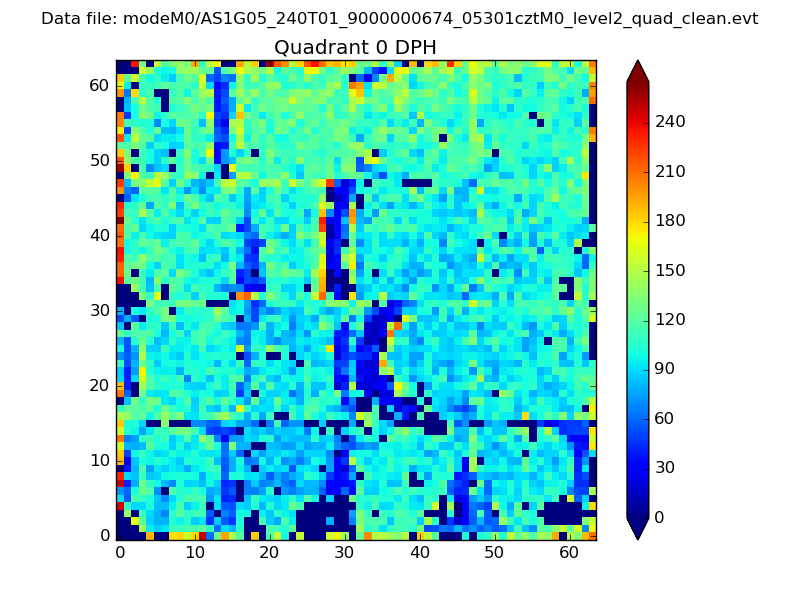 |
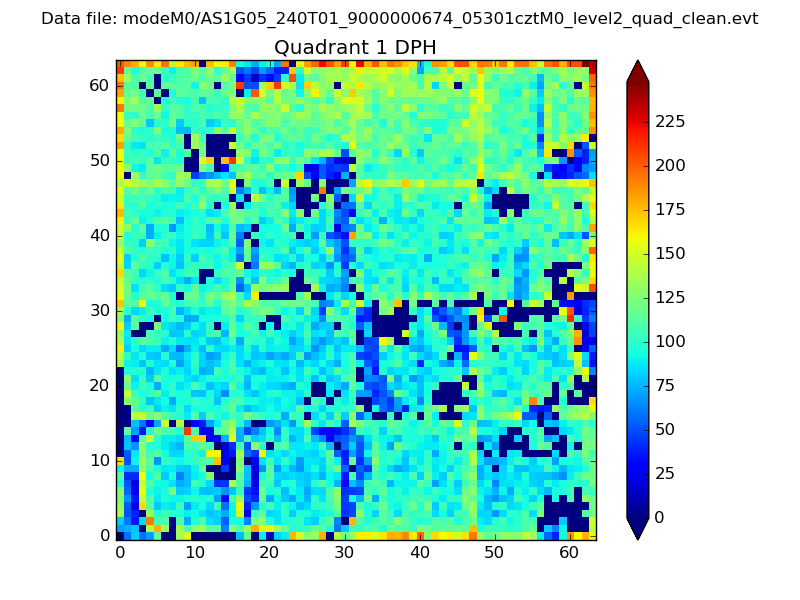 |
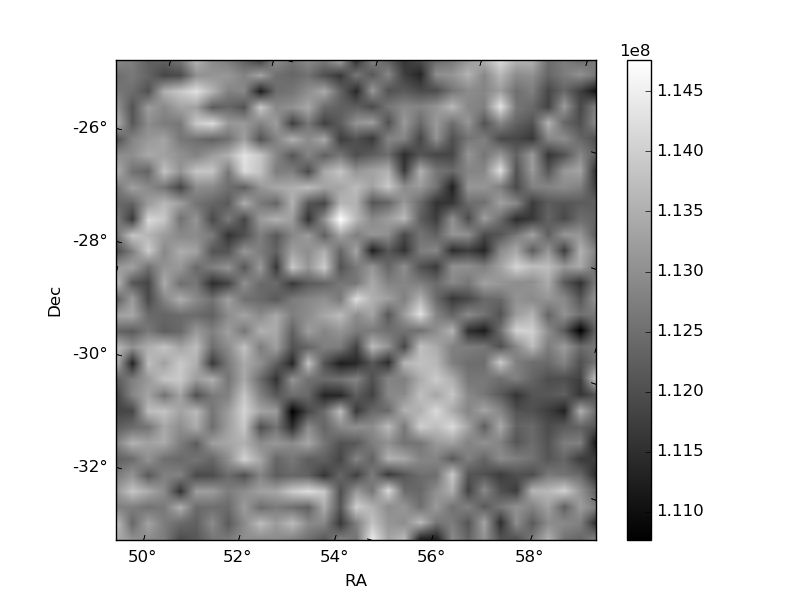
Quadrant B |
|---|---|---|---|
| Quadrant D | 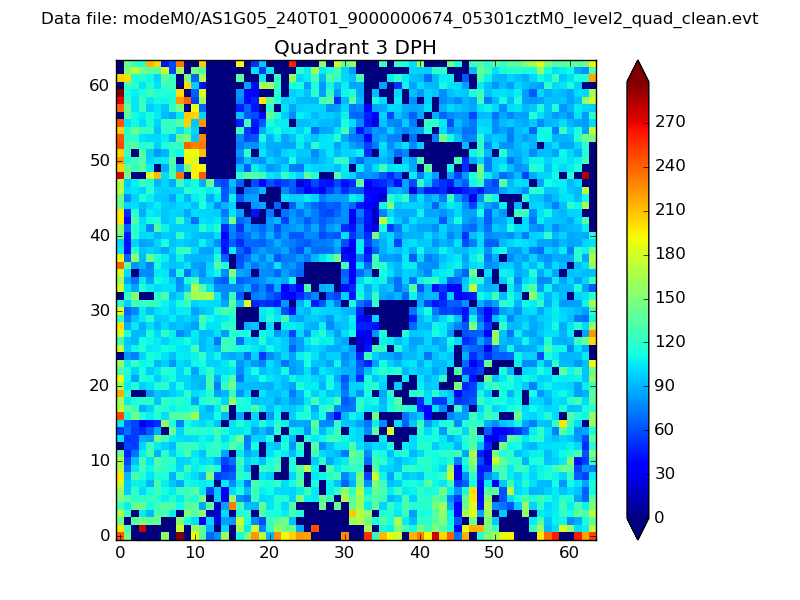 |
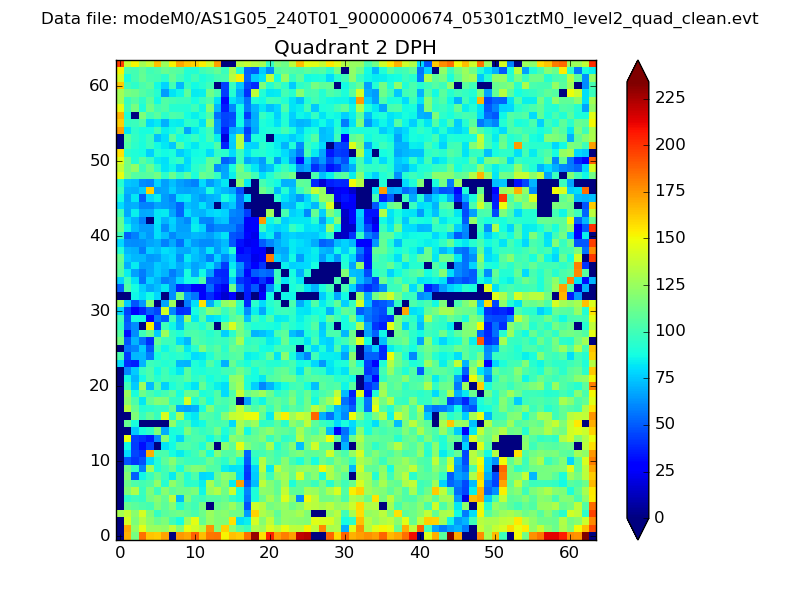 |
Quadrant C |
| Plot type | Count rate plots | Images |
|---|---|---|
| Comparison with Poisson distribution Blue bars denote a histogram of data divided into 1 sec bins. Red curve is a Poisson curve with rate = median count rate of data. |
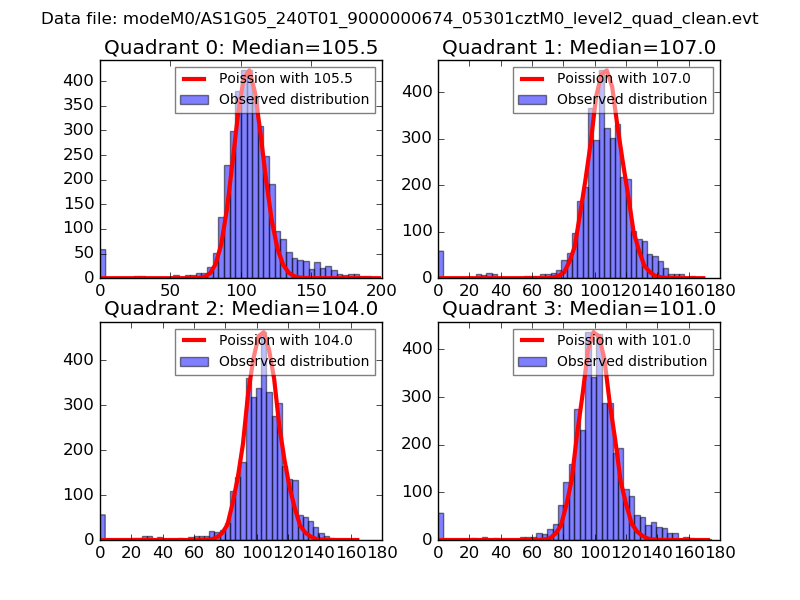 |
 |
| Quadrant-wise count rates Data is divided into 100 sec bins |
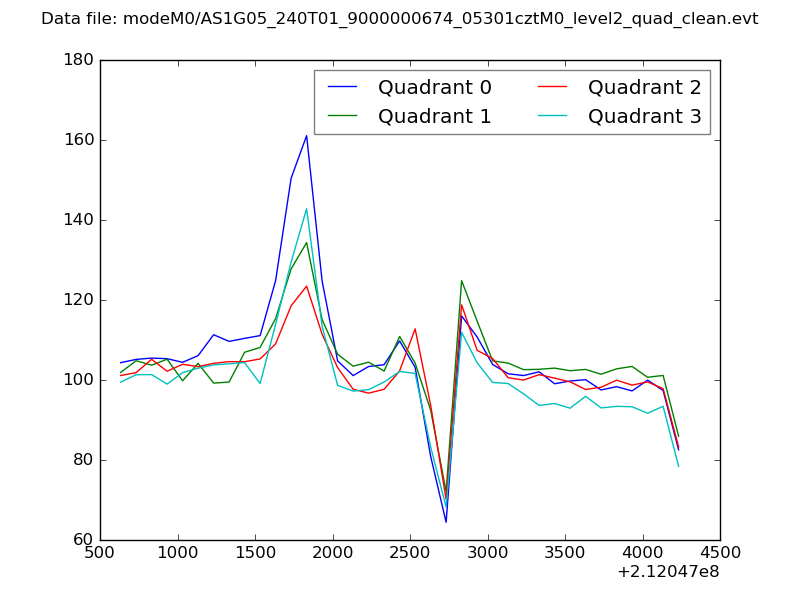 |
|
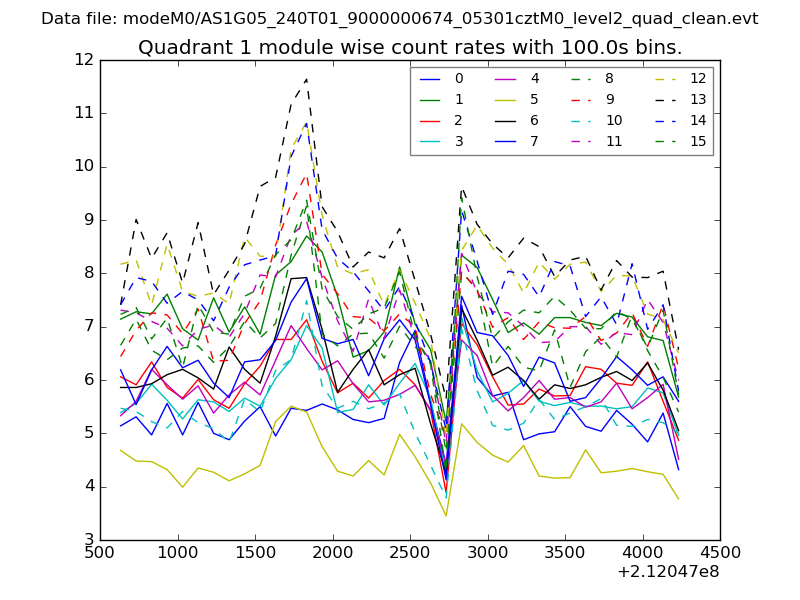
| Module-wise count rates for Quadrant A Data is divided into 100 sec bins |
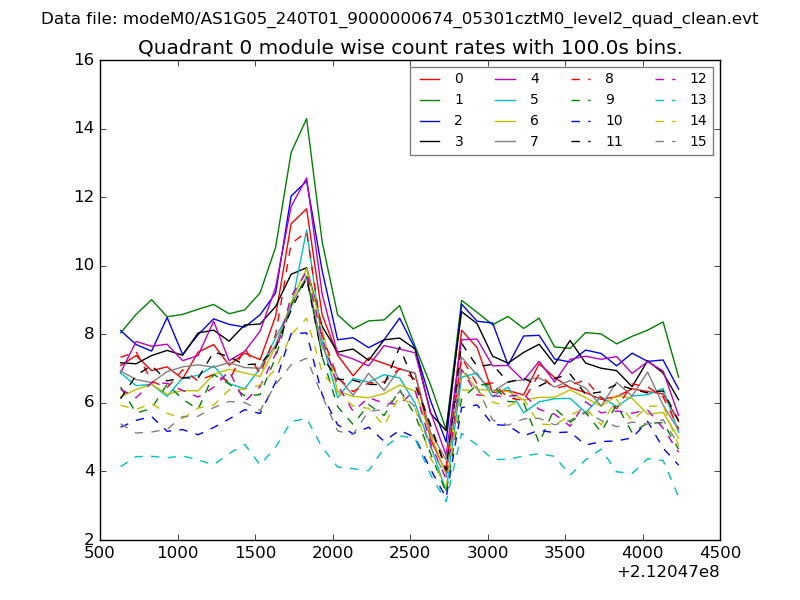 |
 |
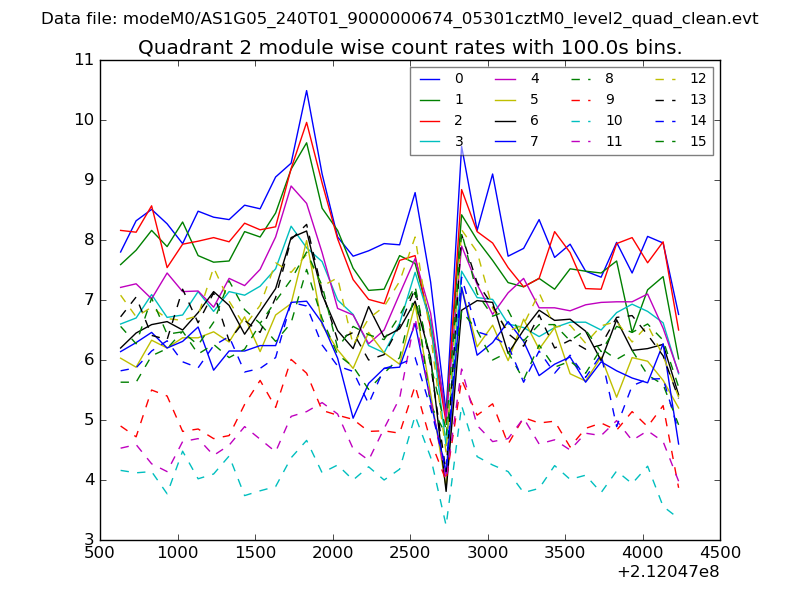
| Module-wise count rates for Quadrant B Data is divided into 100 sec bins |
 |
 |
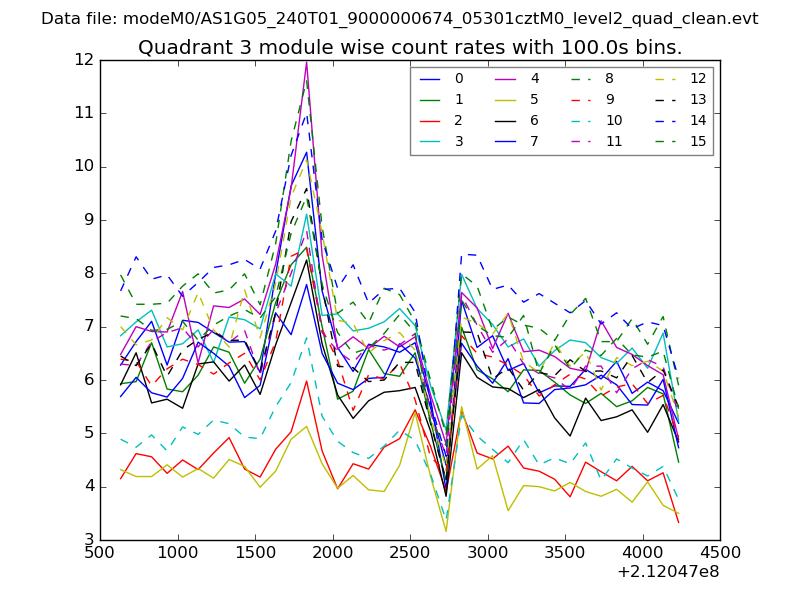
| Module-wise count rates for Quadrant C Data is divided into 100 sec bins |
 |
 |
| Module-wise count rates for Quadrant D Data is divided into 100 sec bins |
 |
 |
| Parameter | Plot |
|---|---|
| CZT HV Monitor | 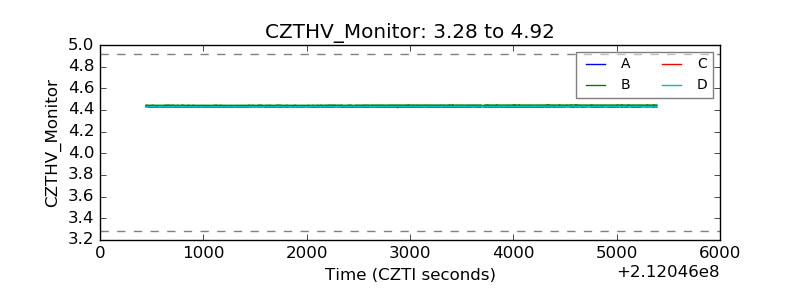 |
| D_VDD | 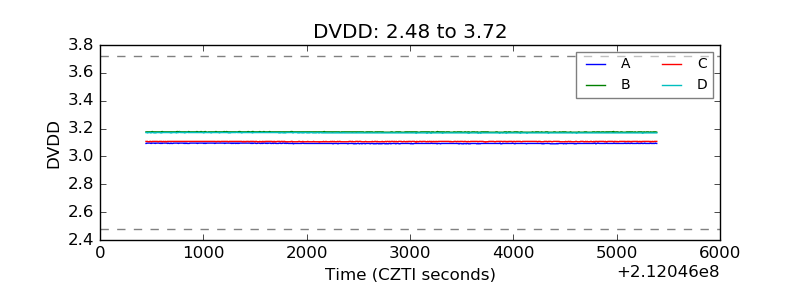 |
| Temperature 1 | 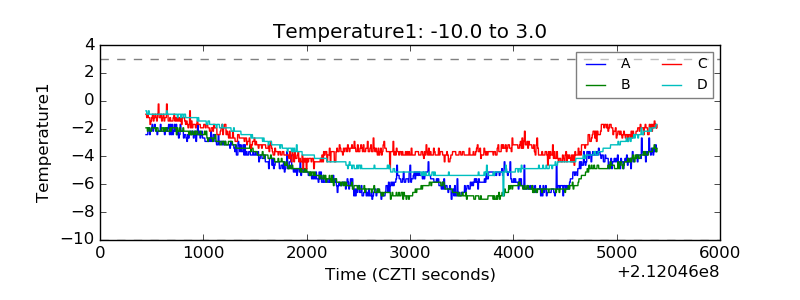 |
| Veto HV Monitor | 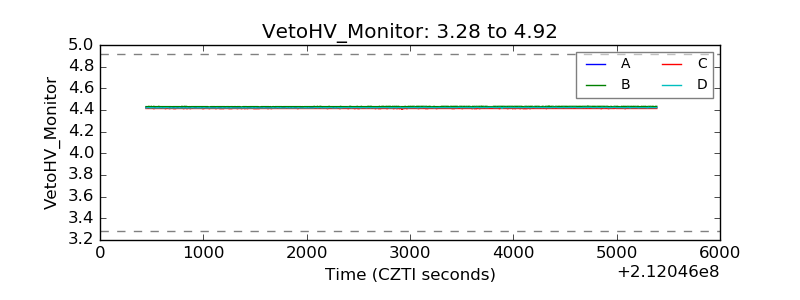 |
| Veto LLD | 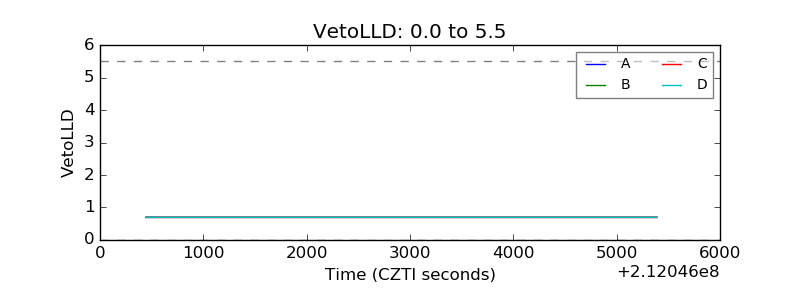 |
| Alpha Counter | 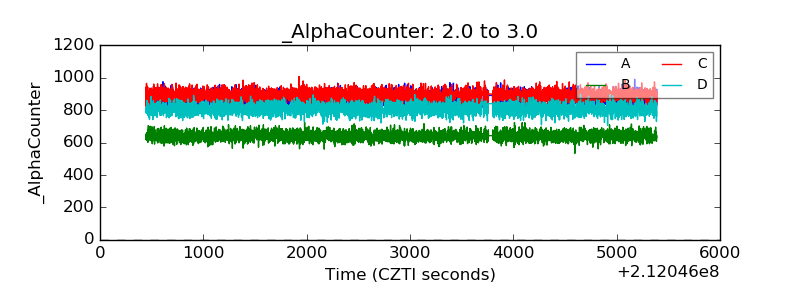 |
| _CPM_Rate | 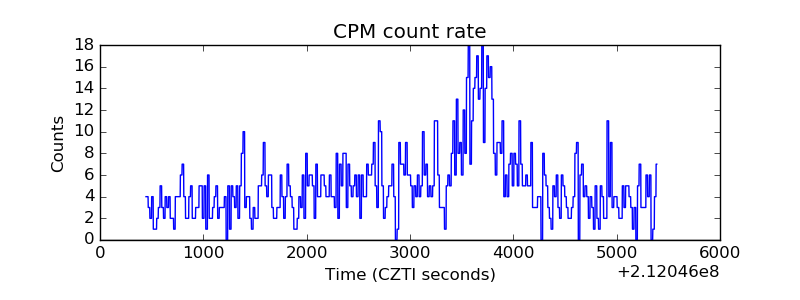 |
| CZT Counter | 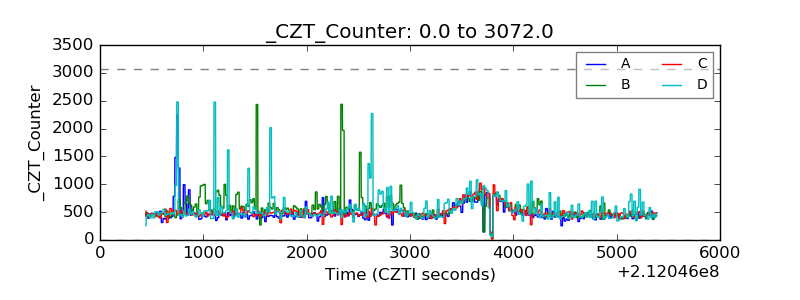 |
| +2.5 Volts monitor |  |
| +5 Volts monitor |  |
| _ROLL_ROT | 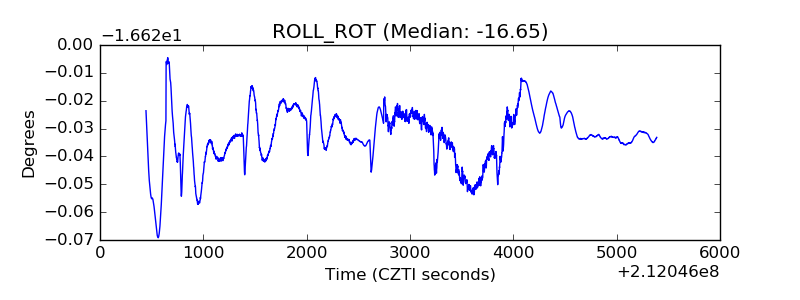 |
| _Roll_DEC | 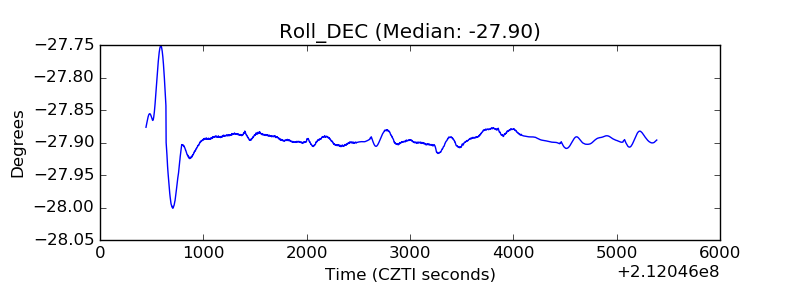 |
| _Roll_RA | 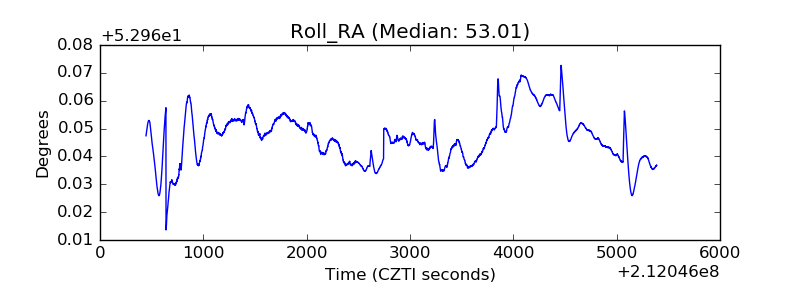 |
| Veto Counter | 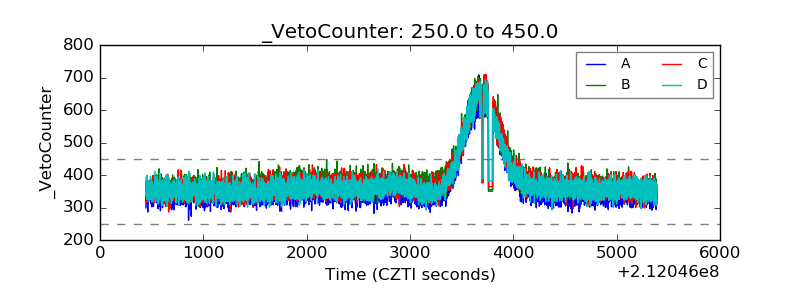 |