| Param | Original file | Final file |
|---|---|---|
| Filename | modeM0/AS1G05_240T01_9000000674_05306cztM0_level2.evt | modeM0/AS1G05_240T01_9000000674_05306cztM0_level2_quad_clean.evt |
| Size (bytes) | 1,962,086,400 | 310,737,600 |
| Size | 1.8 GB | 296.3 MB |
| Events in quadrant A | 14,150,656 | 1,867,529 |
| Events in quadrant B | 14,115,006 | 1,889,960 |
| Events in quadrant C | 13,834,271 | 1,843,257 |
| Events in quadrant D | 15,315,755 | 1,771,030 |
| Mode M0 | |||
|---|---|---|---|
| Quadrant | BADHDUFLAG | Total packets | Discarded packets |
| A | 0 | 64758 | 2393 |
| B | 0 | 64539 | 2599 |
| C | 0 | 63724 | 2517 |
| D | 0 | 68926 | 2851 |
| Mode SS | |||
|---|---|---|---|
| Quadrant | BADHDUFLAG | Total packets | Discarded packets |
| A | 0 | 628 | 24 |
| B | 0 | 628 | 14 |
| C | 0 | 628 | 36 |
| D | 0 | 628 | 22 |
| Mode M9 | |||
|---|---|---|---|
| Quadrant | BADHDUFLAG | Total packets | Discarded packets |
| A | 0 | 22 | 5 |
| B | 0 | 22 | 4 |
| C | 0 | 22 | 3 |
| D | 0 | 22 | 4 |
| Quadrant | Total seconds | Saturated seconds | Saturation percentage |
|---|---|---|---|
| A | 29687 | 600 | 2.021087% |
| B | 29594 | 501 | 1.692911% |
| C | 29612 | 321 | 1.084020% |
| D | 29587 | 590 | 1.994119% |
Noise dominated data is calculated using 1-second bins in cleaned event files. If a bin has >2000 counts, and if more than 50% of those come from <1% of pixels, then it is considered to be noise-dominated and hence unusable.
| Quadrant | # 1 sec bins | Bins with >0 counts | Bins with >2000 counts | High rate bins dominated by noise | Noise dominated (total time) | Noise dominated (detector-on time) | Marked lightcurve |
|---|---|---|---|---|---|---|---|
| A | 33126 | 30584 | 30 | 30 | 0.09% | 0.10% | 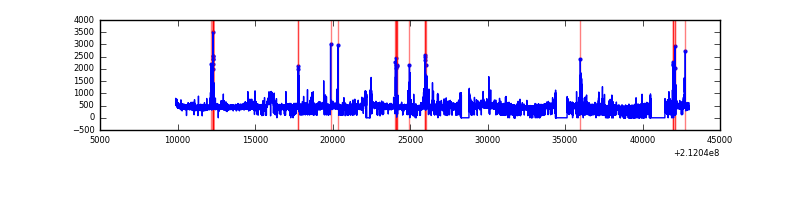 |
| B | 33126 | 30558 | 21 | 21 | 0.06% | 0.07% | 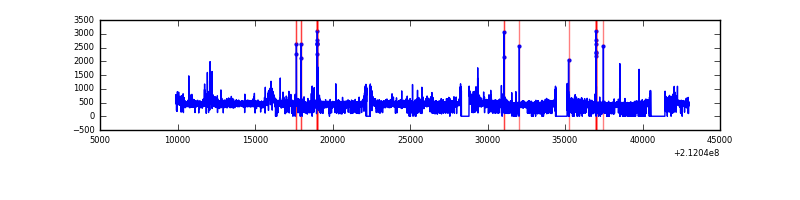 |
| C | 33126 | 30562 | 0 | 0 | 0.00% | 0.00% | 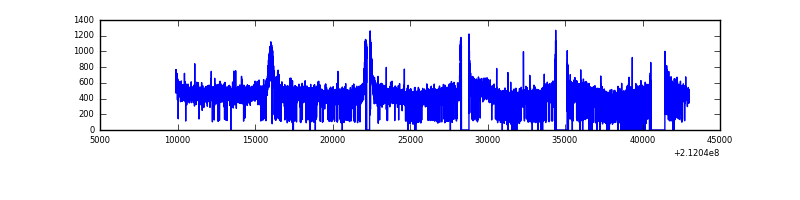 |
| D | 33126 | 30546 | 166 | 166 | 0.50% | 0.54% | 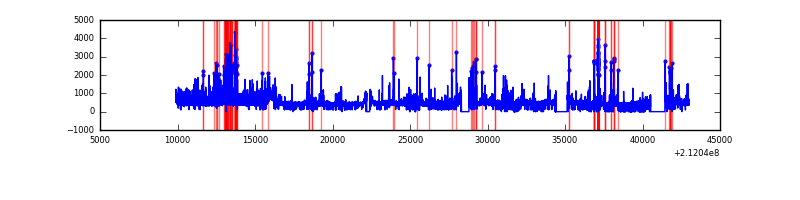 |
Top three noisy pixels from each quadrant. If the there are fewer than three noisy pixels in the level2.evt file, extra rows are filled as -1
| Pixel properties | Quadrant properties | ||||||
|---|---|---|---|---|---|---|---|
| Quadrant | DetID | PixID | Counts | Sigma | Mean | Median | Sigma |
| A | 13 | 251 | 349243 | 494.26 | 3433 | 3353 | 699.8 |
| A | 0 | 50 | 307346 | 434.39 | 3433 | 3353 | 699.8 |
| A | 14 | 111 | 262137 | 369.79 | 3433 | 3353 | 699.8 |
| B | 4 | 48 | 253091 | 374.77 | 3471 | 3387 | 666.3 |
| B | 15 | 204 | 196419 | 289.71 | 3471 | 3387 | 666.3 |
| B | 12 | 111 | 61262 | 86.86 | 3471 | 3387 | 666.3 |
| C | 1 | 16 | 738407 | 946.17 | 3348 | 3363 | 776.9 |
| C | 13 | 61 | 27323 | 30.84 | 3348 | 3363 | 776.9 |
| C | 7 | 234 | 14810 | 14.73 | 3348 | 3363 | 776.9 |
| D | 12 | 233 | 721001 | 876.86 | 3341 | 3237 | 818.6 |
| D | 8 | 195 | 586491 | 712.54 | 3341 | 3237 | 818.6 |
| D | 1 | 239 | 517080 | 627.74 | 3341 | 3237 | 818.6 |
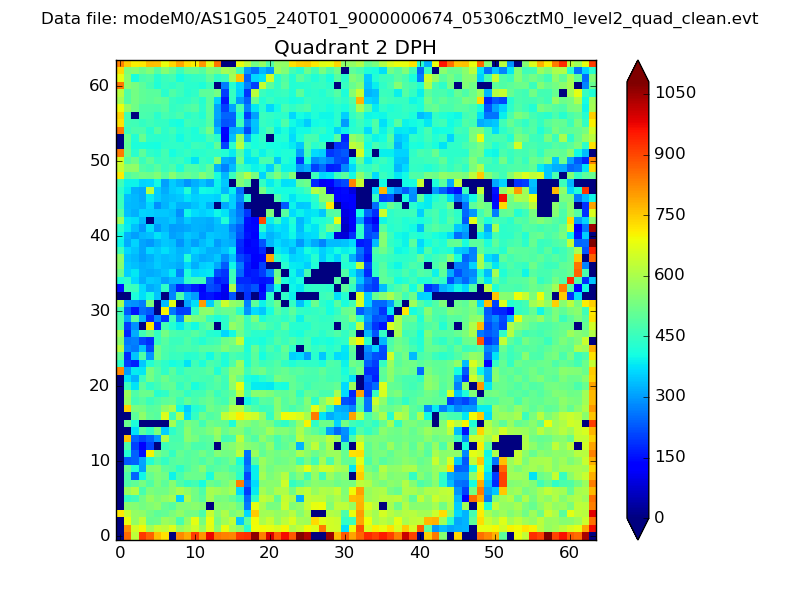
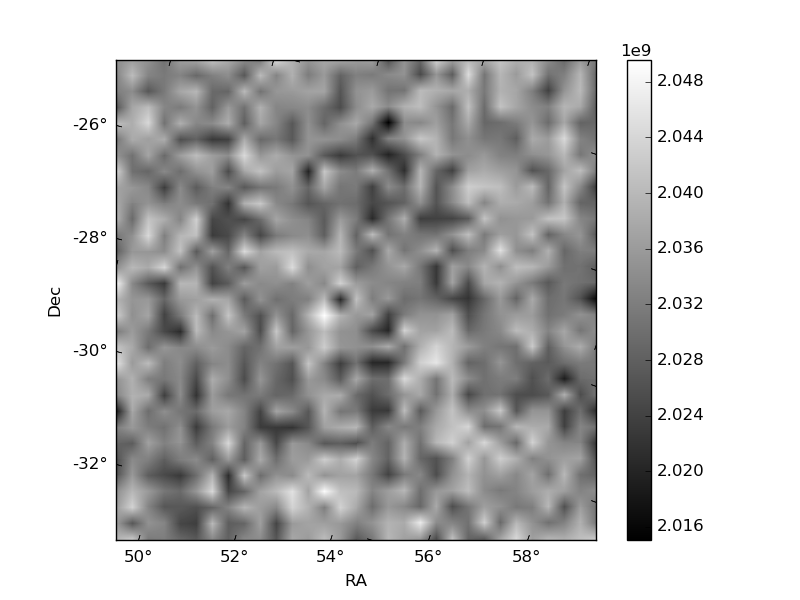
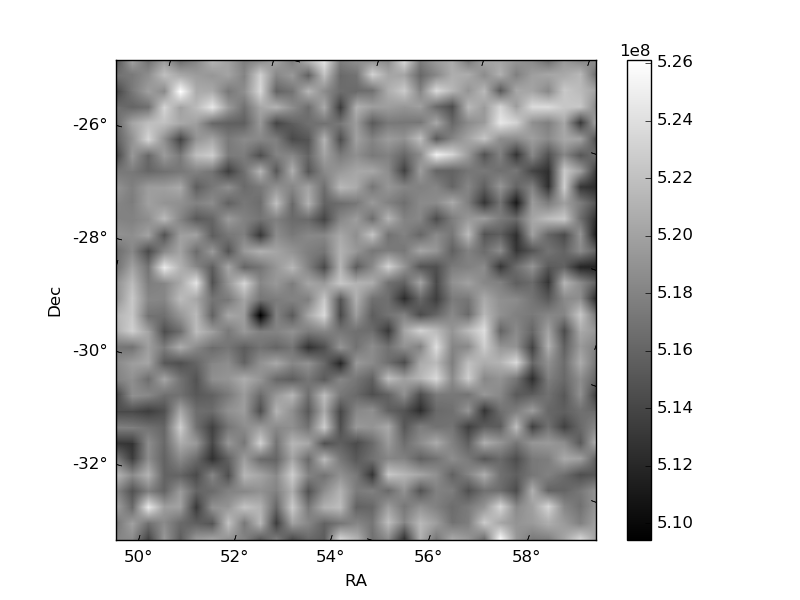
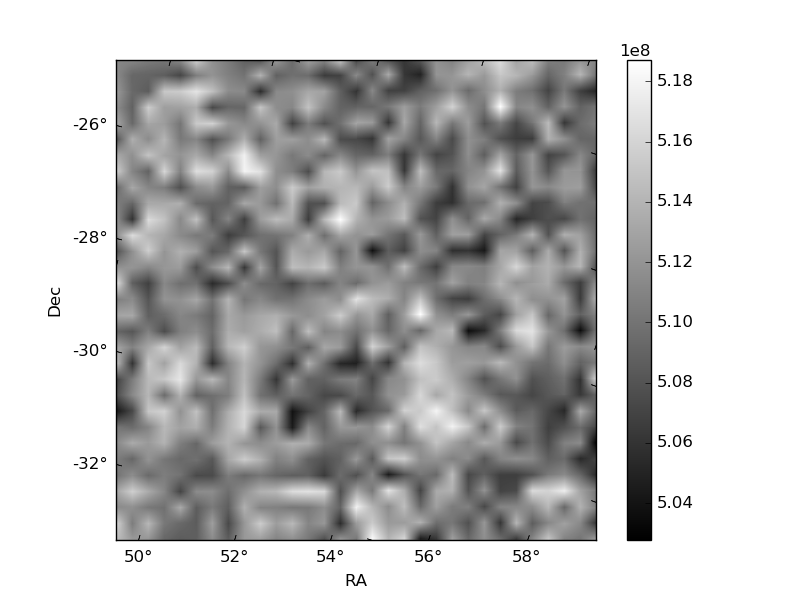
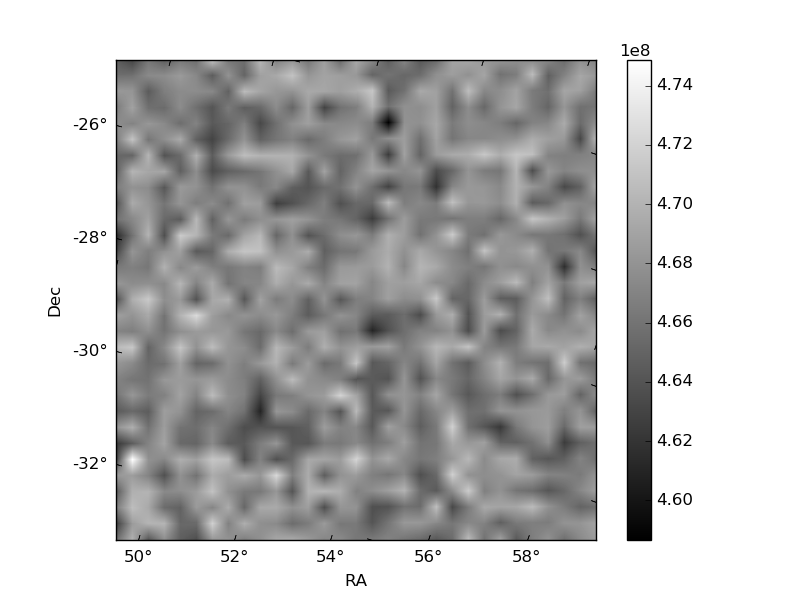
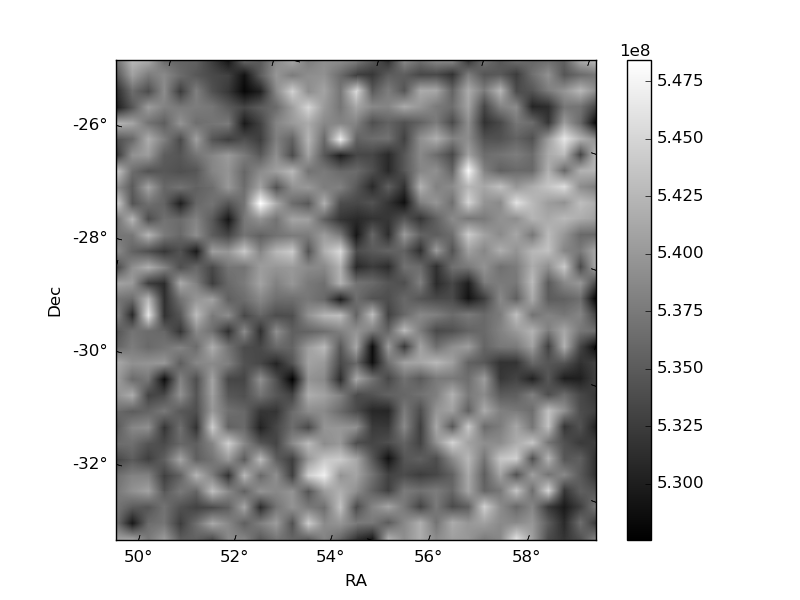
Histogram calculated using DETX and DETY for each event in the final _common_clean file
| Quadrant A | 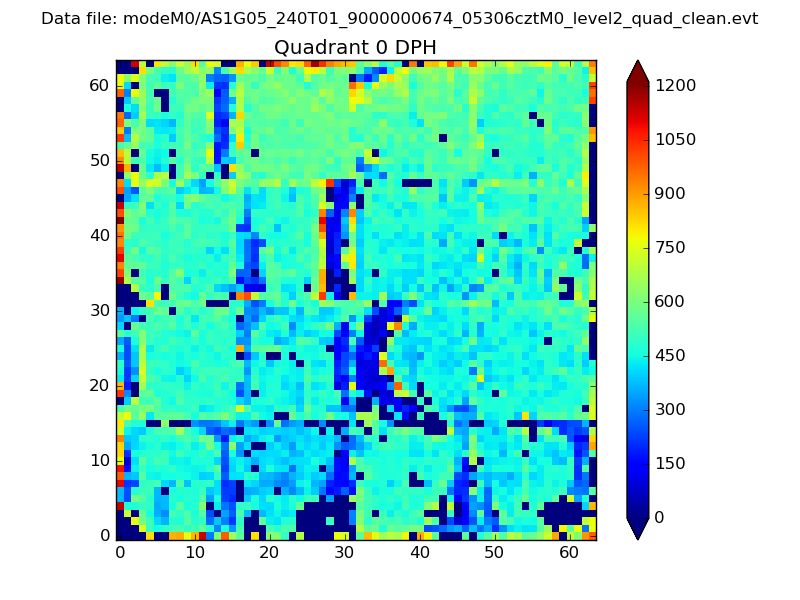 |
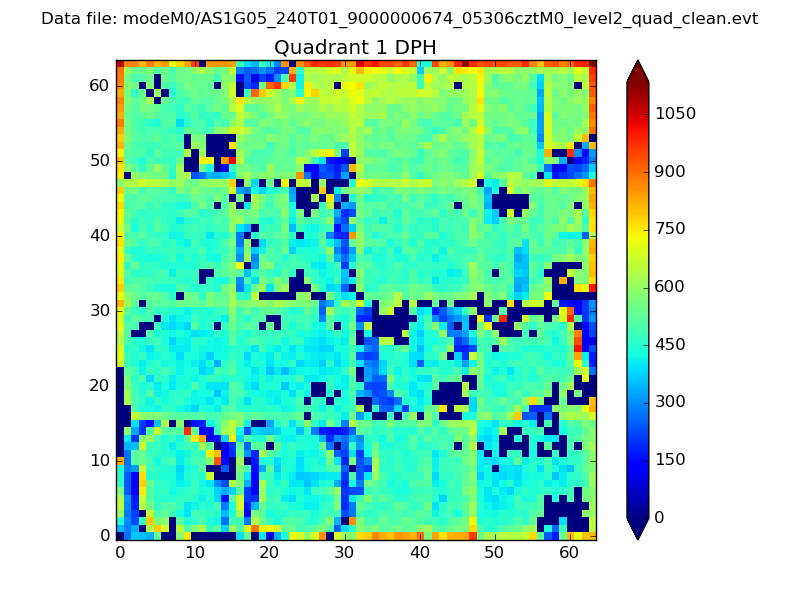 |
Quadrant B |
|---|---|---|---|
| Quadrant D | 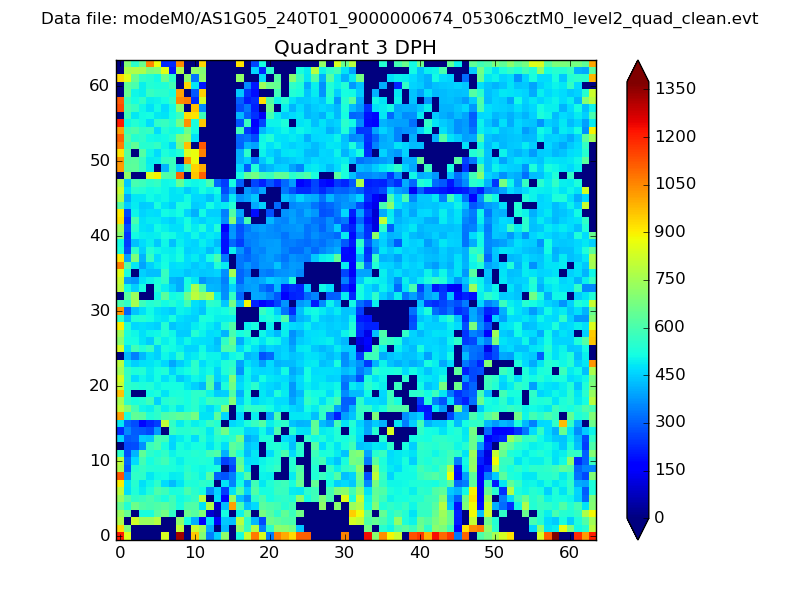 |
 |
Quadrant C |
| Plot type | Count rate plots | Images |
|---|---|---|
| Comparison with Poisson distribution Blue bars denote a histogram of data divided into 1 sec bins. Red curve is a Poisson curve with rate = median count rate of data. |
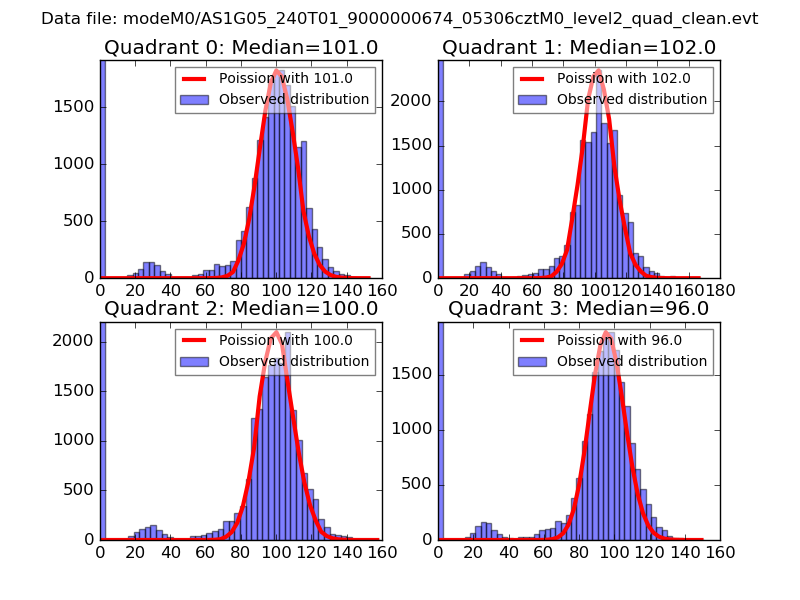 |
 |
| Quadrant-wise count rates Data is divided into 100 sec bins |
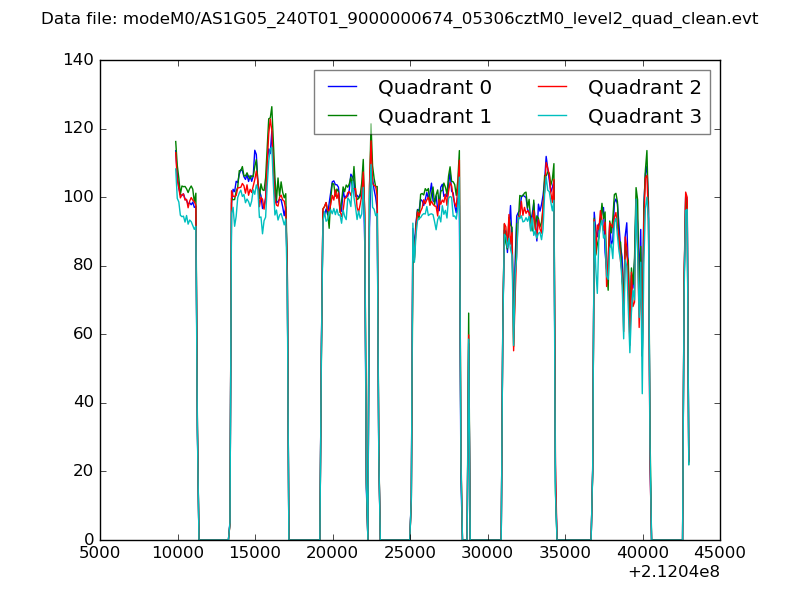 |
|
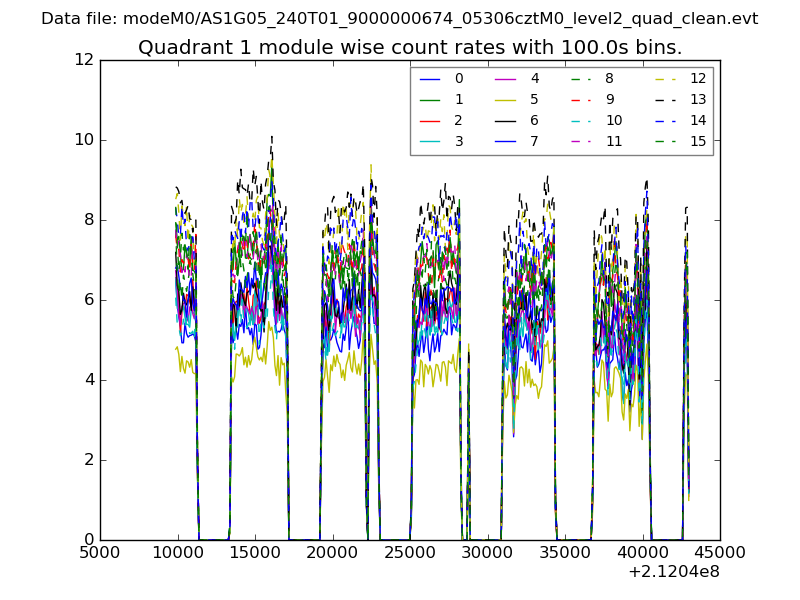
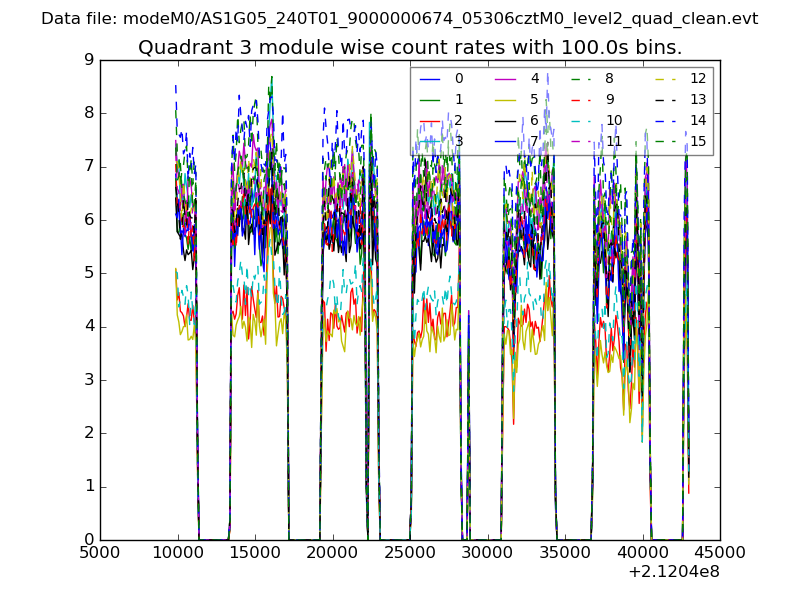
| Module-wise count rates for Quadrant A Data is divided into 100 sec bins |
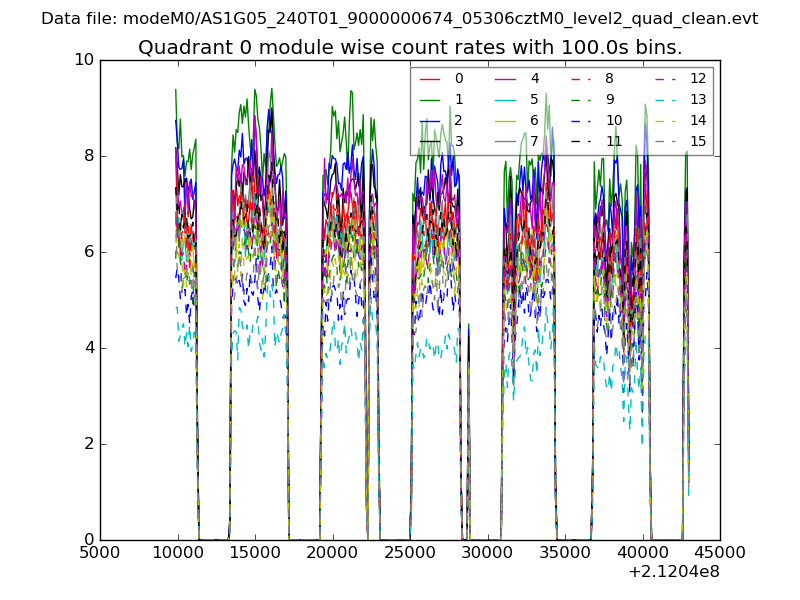 |
 |
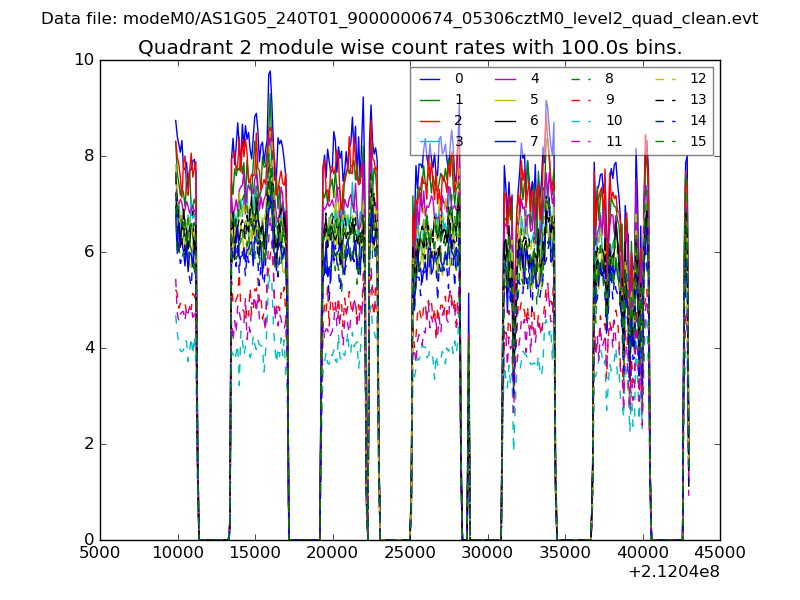
| Module-wise count rates for Quadrant B Data is divided into 100 sec bins |
 |
 |
| Module-wise count rates for Quadrant C Data is divided into 100 sec bins |
 |
 |
| Module-wise count rates for Quadrant D Data is divided into 100 sec bins |
 |
 |
| Parameter | Plot |
|---|---|
| CZT HV Monitor | 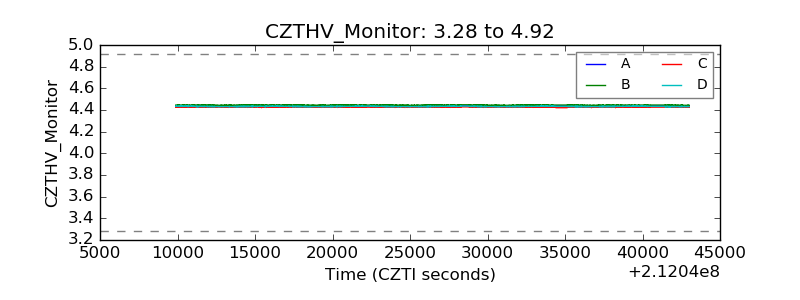 |
| D_VDD | 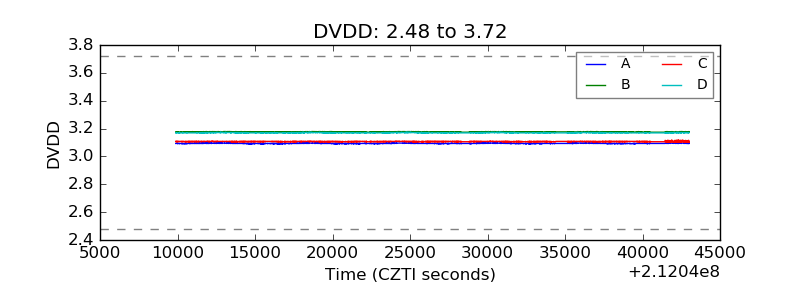 |
| Temperature 1 | 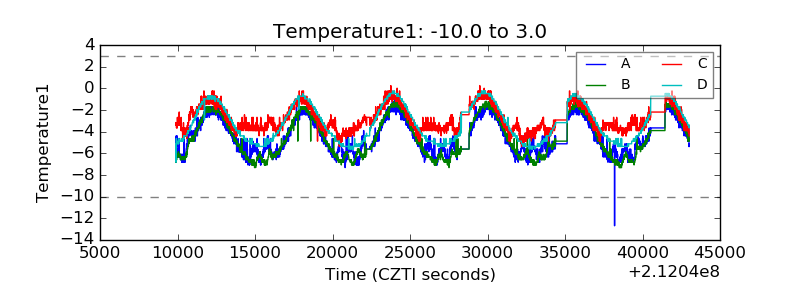 |
| Veto HV Monitor | 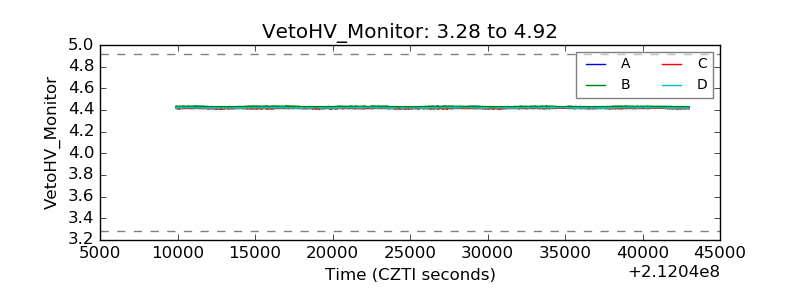 |
| Veto LLD | 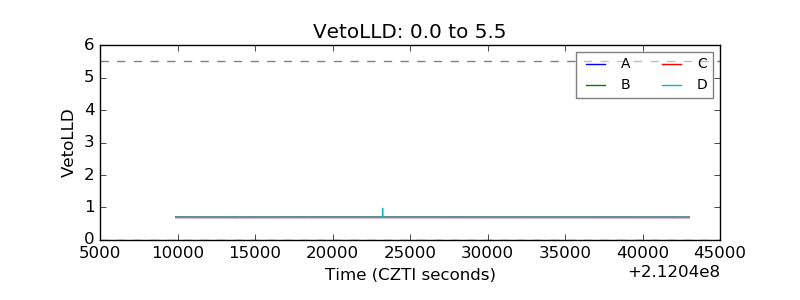 |
| Alpha Counter | 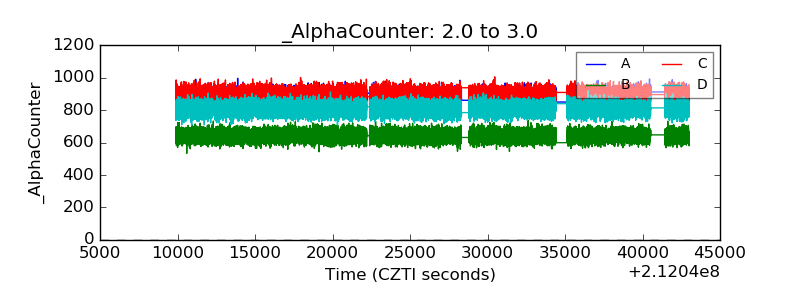 |
| _CPM_Rate | 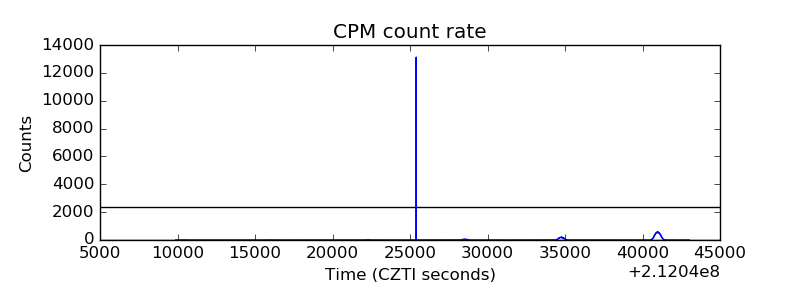 |
| CZT Counter | 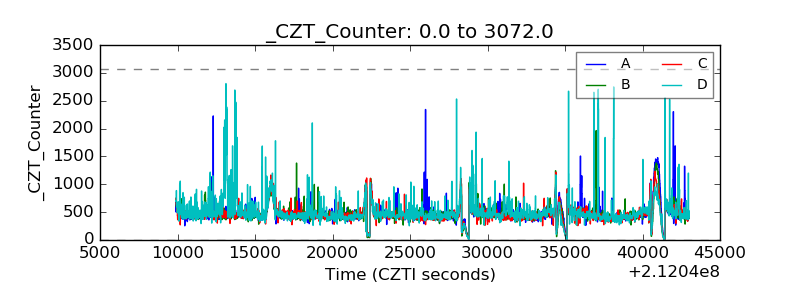 |
| +2.5 Volts monitor |  |
| +5 Volts monitor |  |
| _ROLL_ROT | 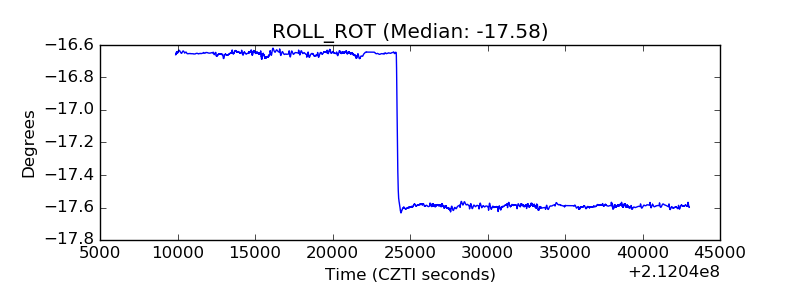 |
| _Roll_DEC | 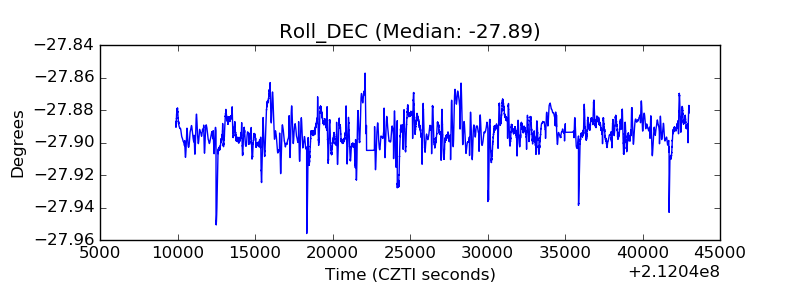 |
| _Roll_RA | 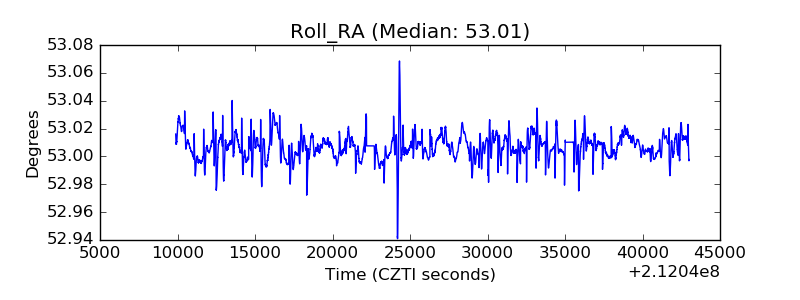 |
| Veto Counter | 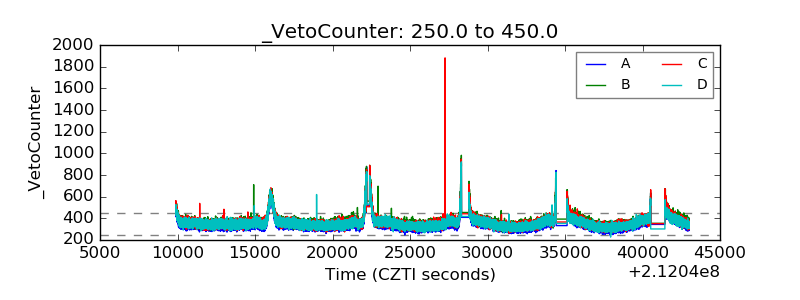 |