| Param | Original file | Final file |
|---|---|---|
| Filename | modeM0/AS1G05_240T01_9000000674_05307cztM0_level2.evt | modeM0/AS1G05_240T01_9000000674_05307cztM0_level2_quad_clean.evt |
| Size (bytes) | 464,472,000 | 75,329,280 |
| Size | 443.0 MB | 71.8 MB |
| Events in quadrant A | 3,271,941 | 458,191 |
| Events in quadrant B | 3,393,691 | 462,449 |
| Events in quadrant C | 3,356,045 | 449,460 |
| Events in quadrant D | 3,580,938 | 435,019 |
| Mode M0 | |||
|---|---|---|---|
| Quadrant | BADHDUFLAG | Total packets | Discarded packets |
| A | 0 | 14379 | 7 |
| B | 0 | 14670 | 4 |
| C | 0 | 14805 | 15 |
| D | 0 | 15523 | 12 |
| Mode SS | |||
|---|---|---|---|
| Quadrant | BADHDUFLAG | Total packets | Discarded packets |
| A | 0 | 140 | 0 |
| B | 0 | 140 | 0 |
| C | 0 | 140 | 0 |
| D | 0 | 140 | 2 |
| Mode M9 | |||
|---|---|---|---|
| Quadrant | BADHDUFLAG | Total packets | Discarded packets |
| A | 0 | 20 | 0 |
| B | 0 | 20 | 0 |
| C | 0 | 20 | 0 |
| D | 0 | 20 | 0 |
| Quadrant | Total seconds | Saturated seconds | Saturation percentage |
|---|---|---|---|
| A | 6833 | 69 | 1.009805% |
| B | 6834 | 69 | 1.009658% |
| C | 6829 | 27 | 0.395373% |
| D | 6831 | 130 | 1.903089% |
Noise dominated data is calculated using 1-second bins in cleaned event files. If a bin has >2000 counts, and if more than 50% of those come from <1% of pixels, then it is considered to be noise-dominated and hence unusable.
| Quadrant | # 1 sec bins | Bins with >0 counts | Bins with >2000 counts | High rate bins dominated by noise | Noise dominated (total time) | Noise dominated (detector-on time) | Marked lightcurve |
|---|---|---|---|---|---|---|---|
| A | 8810 | 6837 | 15 | 15 | 0.17% | 0.22% | 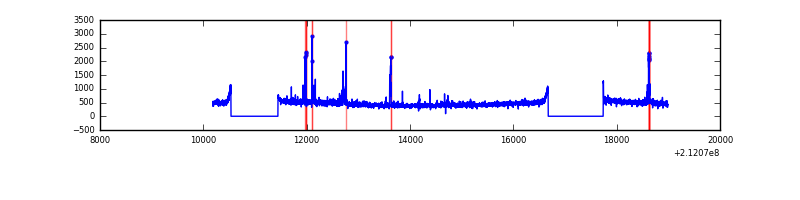 |
| B | 8810 | 6837 | 7 | 7 | 0.08% | 0.10% | 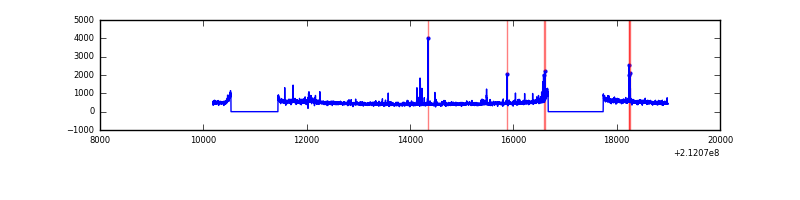 |
| C | 8810 | 6837 | 0 | 0 | 0.00% | 0.00% | 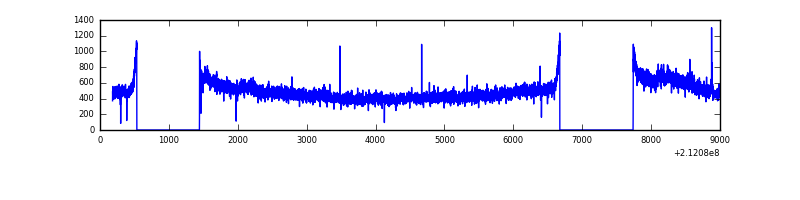 |
| D | 8810 | 6837 | 71 | 71 | 0.81% | 1.04% | 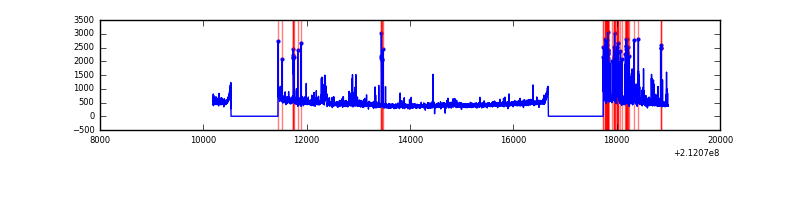 |
Top three noisy pixels from each quadrant. If the there are fewer than three noisy pixels in the level2.evt file, extra rows are filled as -1
| Pixel properties | Quadrant properties | ||||||
|---|---|---|---|---|---|---|---|
| Quadrant | DetID | PixID | Counts | Sigma | Mean | Median | Sigma |
| A | 0 | 50 | 125620 | 749.74 | 809 | 789 | 166.5 |
| A | 13 | 251 | 29276 | 171.09 | 809 | 789 | 166.5 |
| A | 12 | 194 | 8137 | 44.13 | 809 | 789 | 166.5 |
| B | 4 | 48 | 72937 | 455.17 | 819 | 800 | 158.5 |
| B | 15 | 204 | 66195 | 412.63 | 819 | 800 | 158.5 |
| B | 10 | 16 | 56545 | 351.74 | 819 | 800 | 158.5 |
| C | 1 | 16 | 279726 | 1522.36 | 784 | 787 | 183.2 |
| C | 8 | 128 | 7575 | 37.05 | 784 | 787 | 183.2 |
| C | 13 | 61 | 6422 | 30.75 | 784 | 787 | 183.2 |
| D | 2 | 234 | 308882 | 1594.68 | 778 | 753 | 193.2 |
| D | 8 | 195 | 124407 | 639.96 | 778 | 753 | 193.2 |
| D | 14 | 34 | 66561 | 340.58 | 778 | 753 | 193.2 |
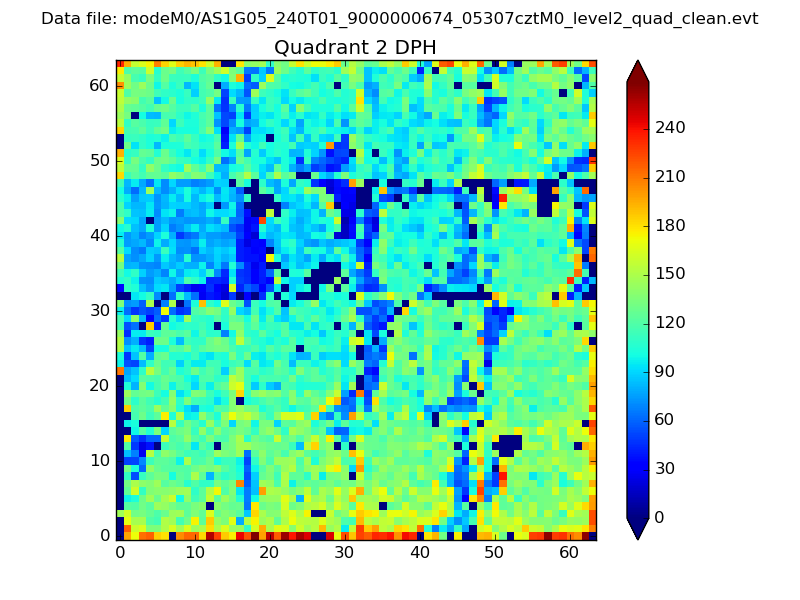
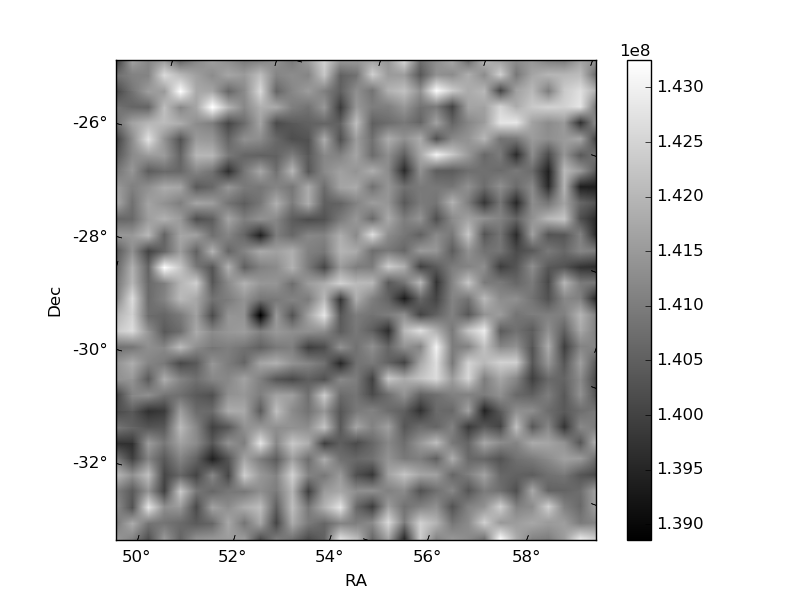
Histogram calculated using DETX and DETY for each event in the final _common_clean file
| Quadrant A |  |
 |
Quadrant B |
|---|---|---|---|
| Quadrant D | 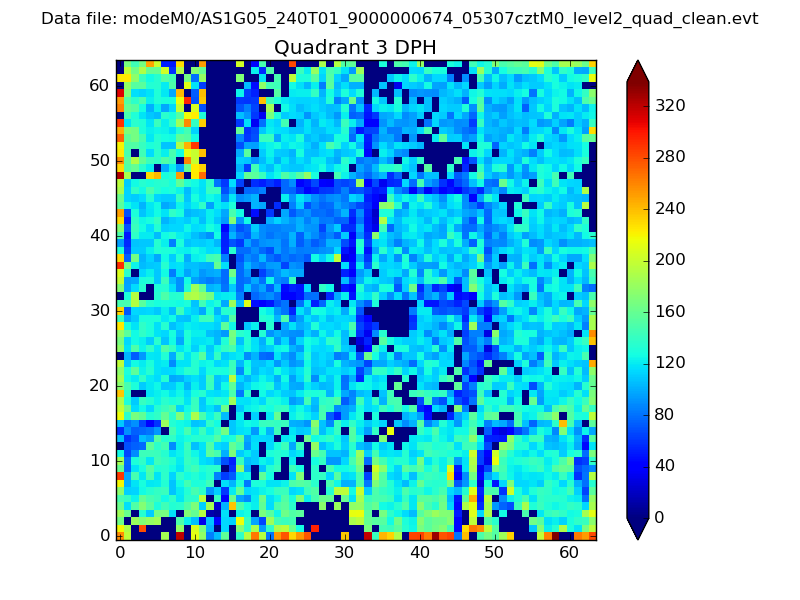 |
 |
Quadrant C |
| Plot type | Count rate plots | Images |
|---|---|---|
| Comparison with Poisson distribution Blue bars denote a histogram of data divided into 1 sec bins. Red curve is a Poisson curve with rate = median count rate of data. |
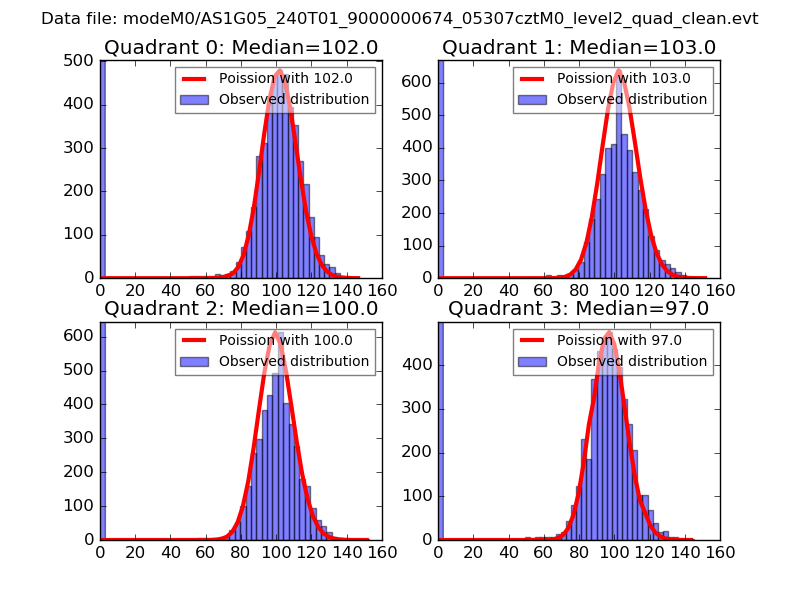 |
 |
| Quadrant-wise count rates Data is divided into 100 sec bins |
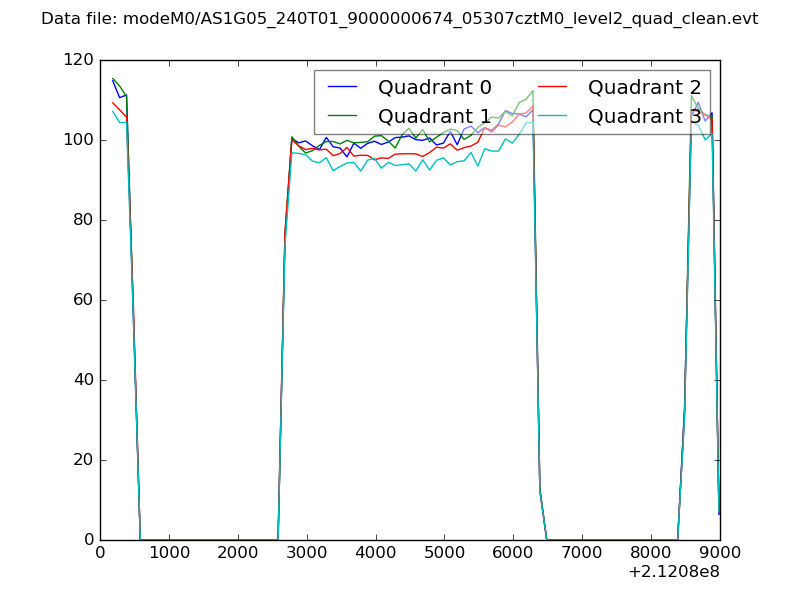 |
|
| Module-wise count rates for Quadrant A Data is divided into 100 sec bins |
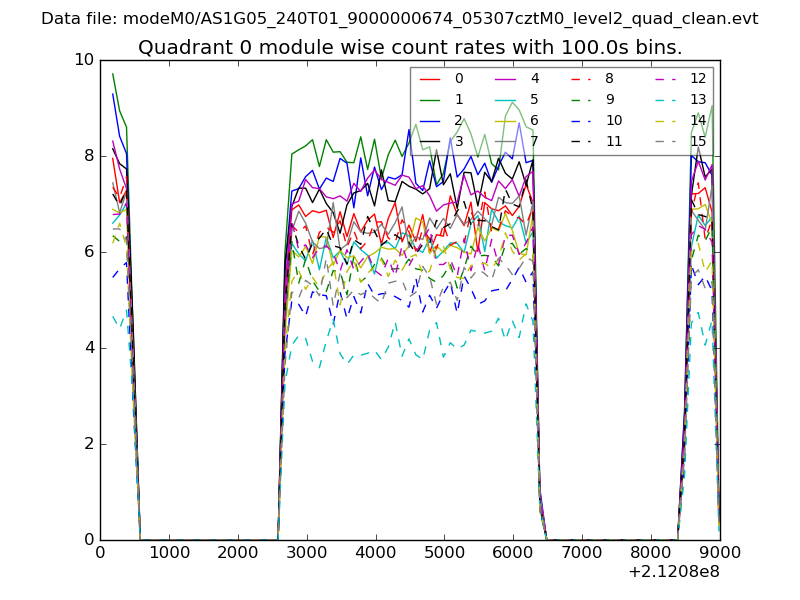 |
 |
| Module-wise count rates for Quadrant B Data is divided into 100 sec bins |
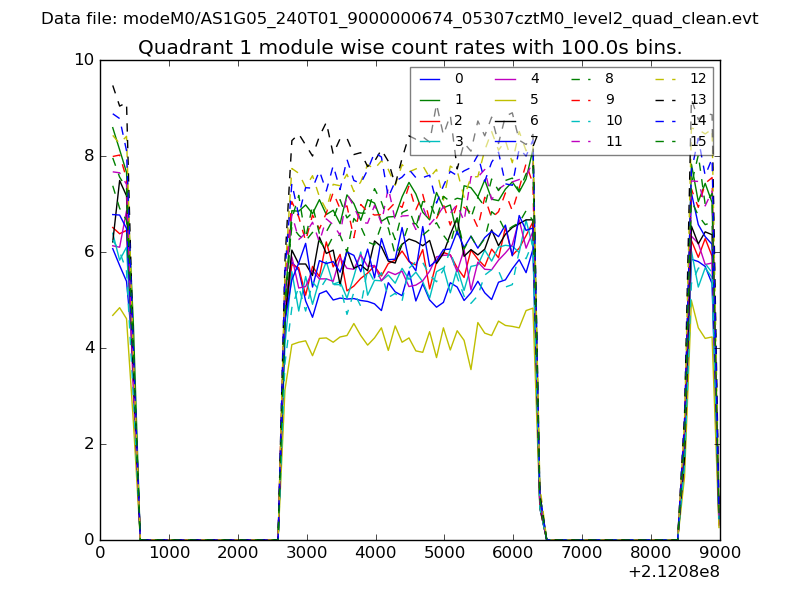 |
 |
| Module-wise count rates for Quadrant C Data is divided into 100 sec bins |
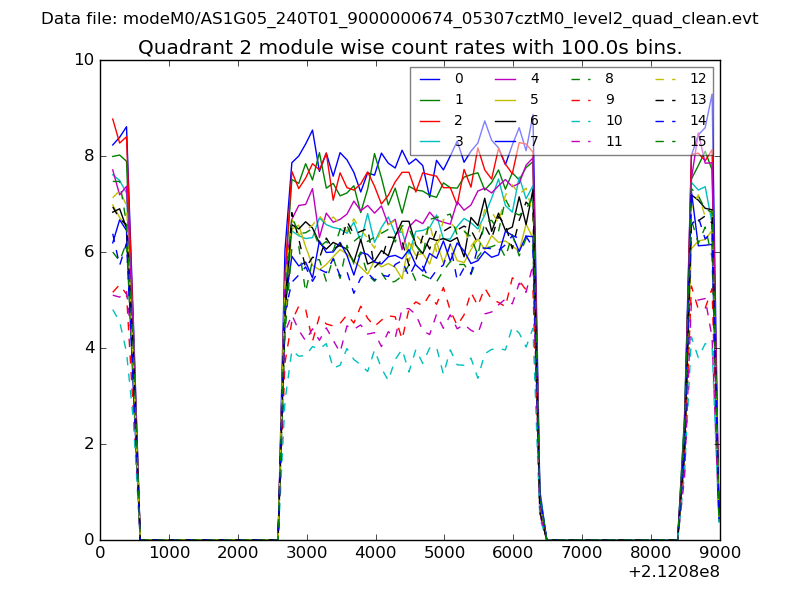 |
 |
| Module-wise count rates for Quadrant D Data is divided into 100 sec bins |
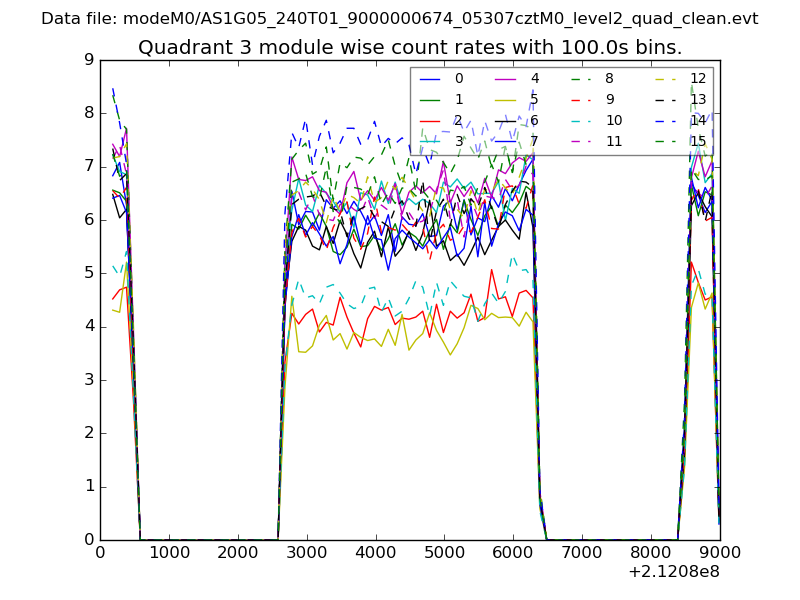 |
 |
| Parameter | Plot |
|---|---|
| CZT HV Monitor | 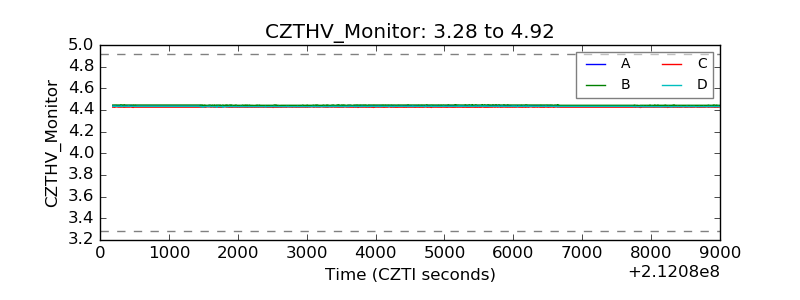 |
| D_VDD | 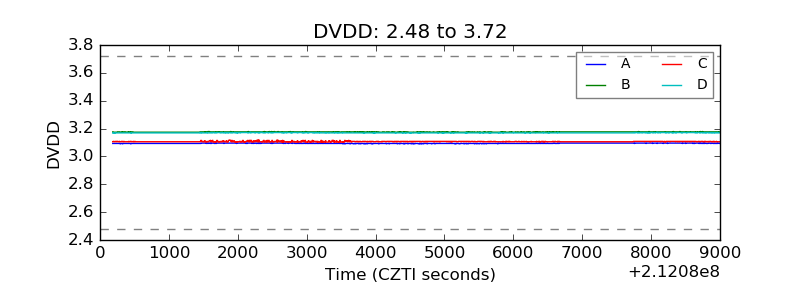 |
| Temperature 1 | 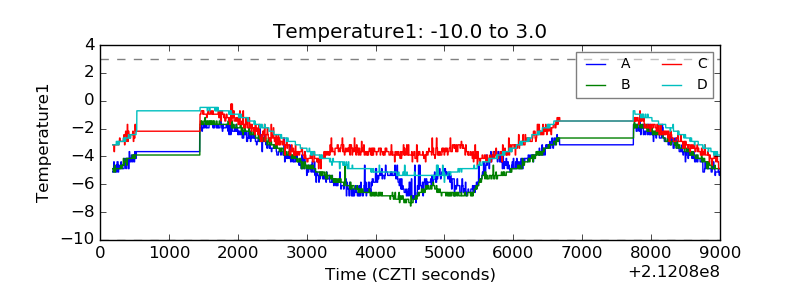 |
| Veto HV Monitor | 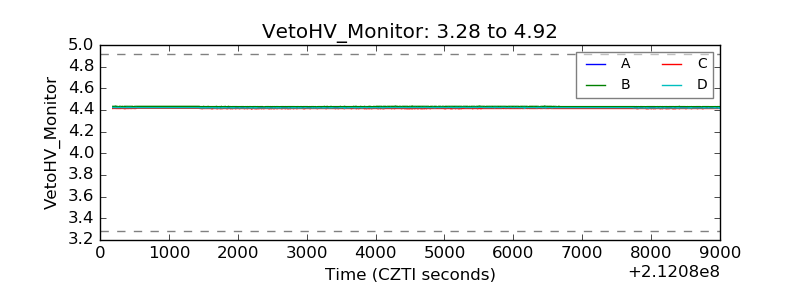 |
| Veto LLD | 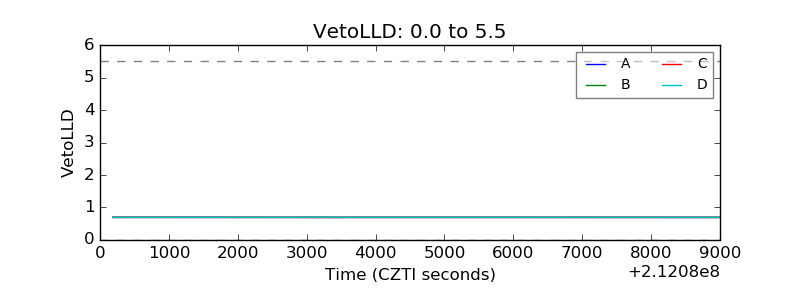 |
| Alpha Counter | 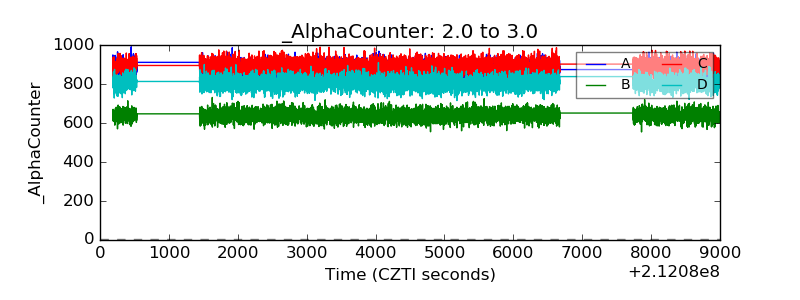 |
| _CPM_Rate | 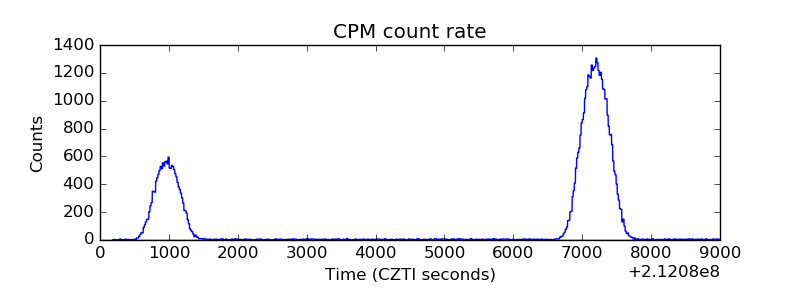 |
| CZT Counter |  |
| +2.5 Volts monitor |  |
| +5 Volts monitor |  |
| _ROLL_ROT | 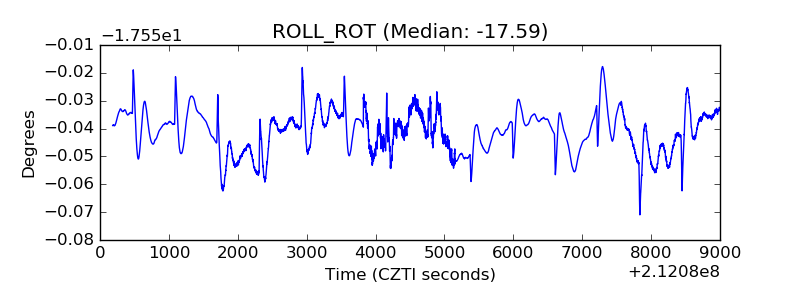 |
| _Roll_DEC | 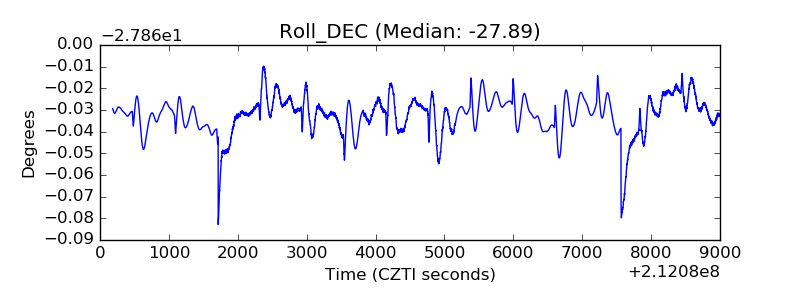 |
| _Roll_RA | 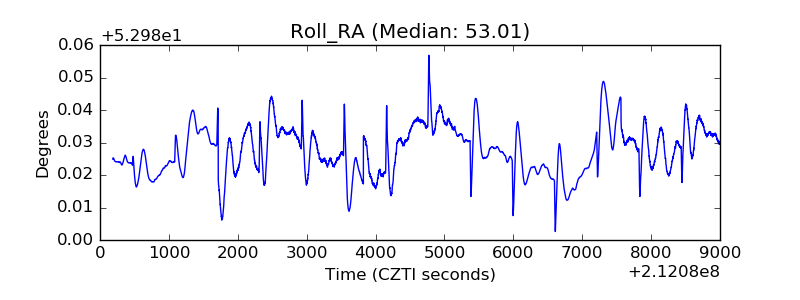 |
| Veto Counter | 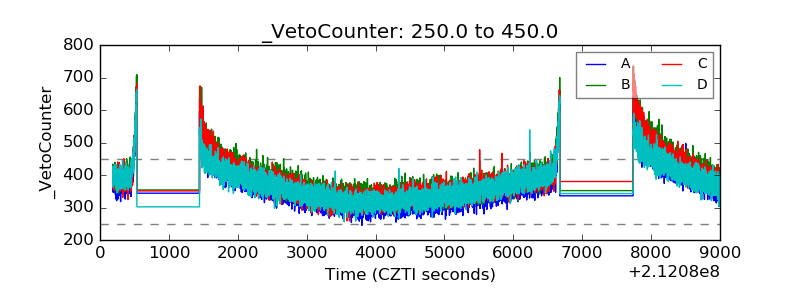 |