| Param | Original file | Final file |
|---|---|---|
| Filename | modeM0/AS1G05_240T01_9000000674_05309cztM0_level2.evt | modeM0/AS1G05_240T01_9000000674_05309cztM0_level2_quad_clean.evt |
| Size (bytes) | 464,201,280 | 79,859,520 |
| Size | 442.7 MB | 76.2 MB |
| Events in quadrant A | 3,004,510 | 499,187 |
| Events in quadrant B | 3,316,176 | 509,143 |
| Events in quadrant C | 3,335,385 | 490,756 |
| Events in quadrant D | 3,961,368 | 466,366 |
| Mode M0 | |||
|---|---|---|---|
| Quadrant | BADHDUFLAG | Total packets | Discarded packets |
| A | 0 | 13425 | 3 |
| B | 0 | 14252 | 2 |
| C | 0 | 14227 | 2 |
| D | 0 | 16206 | 2 |
| Mode SS | |||
|---|---|---|---|
| Quadrant | BADHDUFLAG | Total packets | Discarded packets |
| A | 0 | 132 | 0 |
| B | 0 | 132 | 0 |
| C | 0 | 132 | 0 |
| D | 0 | 132 | 0 |
| Mode M9 | |||
|---|---|---|---|
| Quadrant | BADHDUFLAG | Total packets | Discarded packets |
| A | 0 | 15 | 0 |
| B | 0 | 15 | 0 |
| C | 0 | 15 | 0 |
| D | 0 | 16 | 0 |
| Quadrant | Total seconds | Saturated seconds | Saturation percentage |
|---|---|---|---|
| A | 6491 | 38 | 0.585426% |
| B | 6491 | 39 | 0.600832% |
| C | 6491 | 20 | 0.308119% |
| D | 6491 | 171 | 2.634417% |
Noise dominated data is calculated using 1-second bins in cleaned event files. If a bin has >2000 counts, and if more than 50% of those come from <1% of pixels, then it is considered to be noise-dominated and hence unusable.
| Quadrant | # 1 sec bins | Bins with >0 counts | Bins with >2000 counts | High rate bins dominated by noise | Noise dominated (total time) | Noise dominated (detector-on time) | Marked lightcurve |
|---|---|---|---|---|---|---|---|
| A | 7676 | 6492 | 6 | 6 | 0.08% | 0.09% | 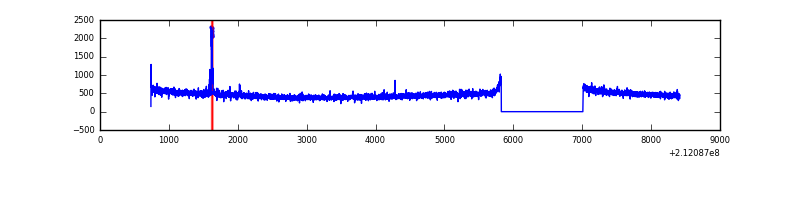 |
| B | 7676 | 6492 | 10 | 10 | 0.13% | 0.15% | 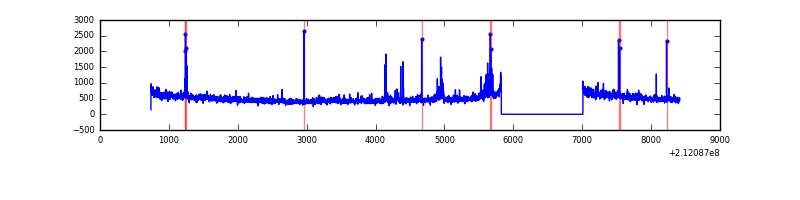 |
| C | 7676 | 6492 | 0 | 0 | 0.00% | 0.00% | 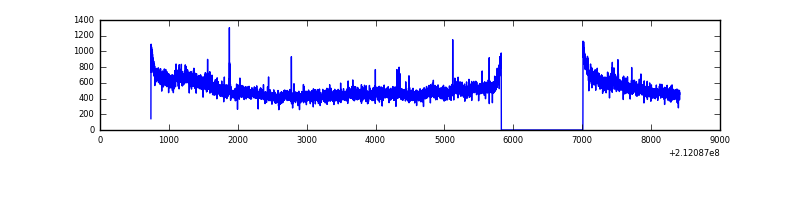 |
| D | 7676 | 6492 | 127 | 127 | 1.65% | 1.96% | 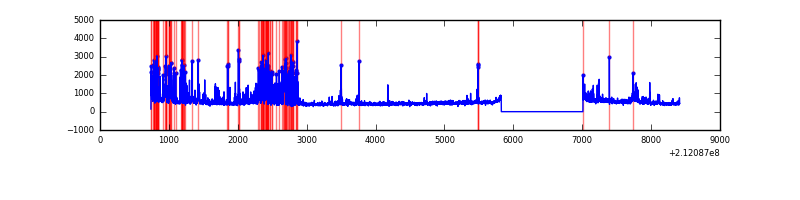 |
Top three noisy pixels from each quadrant. If the there are fewer than three noisy pixels in the level2.evt file, extra rows are filled as -1
| Pixel properties | Quadrant properties | ||||||
|---|---|---|---|---|---|---|---|
| Quadrant | DetID | PixID | Counts | Sigma | Mean | Median | Sigma |
| A | 0 | 50 | 39973 | 250.16 | 769 | 751 | 156.8 |
| A | 12 | 194 | 7676 | 44.17 | 769 | 751 | 156.8 |
| A | 0 | 226 | 7562 | 43.44 | 769 | 751 | 156.8 |
| B | 4 | 48 | 91803 | 609.54 | 784 | 767 | 149.4 |
| B | 10 | 16 | 87475 | 580.57 | 784 | 767 | 149.4 |
| B | 15 | 204 | 80142 | 531.47 | 784 | 767 | 149.4 |
| C | 1 | 16 | 401616 | 2304.94 | 748 | 754 | 173.9 |
| C | 12 | 4 | 7100 | 36.49 | 748 | 754 | 173.9 |
| C | 13 | 61 | 6123 | 30.87 | 748 | 754 | 173.9 |
| D | 2 | 234 | 886551 | 4972.84 | 733 | 710 | 178.1 |
| D | 8 | 195 | 110366 | 615.58 | 733 | 710 | 178.1 |
| D | 14 | 34 | 44506 | 245.86 | 733 | 710 | 178.1 |
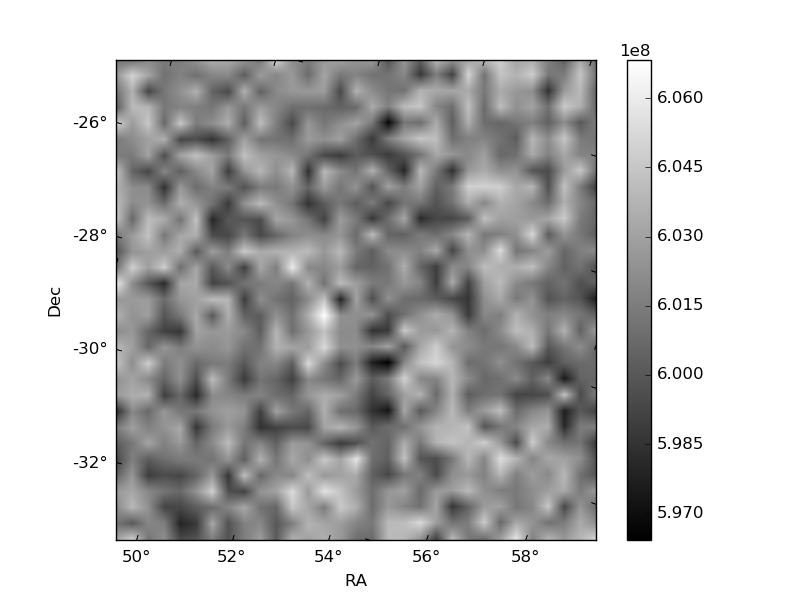
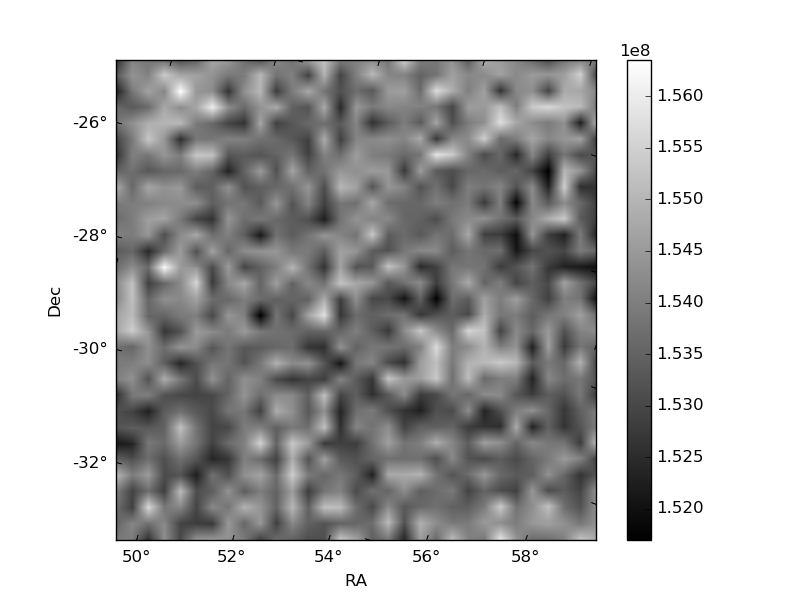
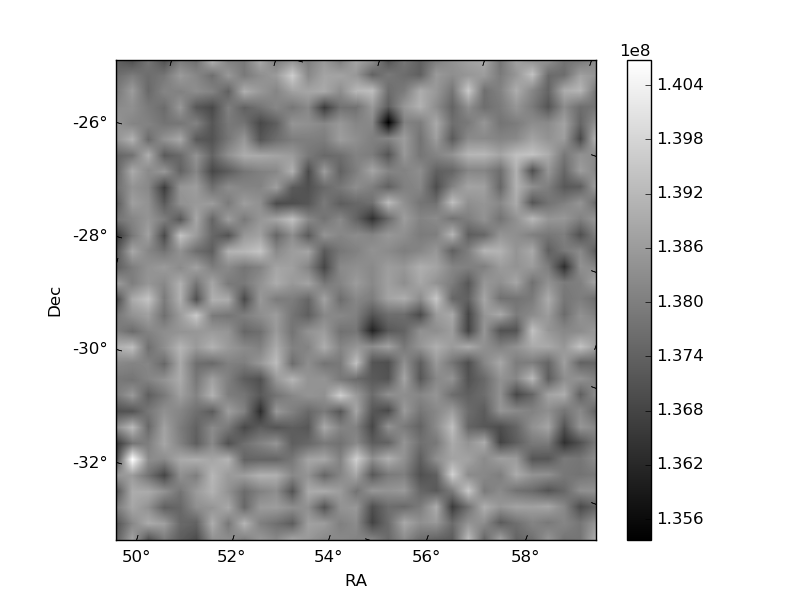
Histogram calculated using DETX and DETY for each event in the final _common_clean file
| Quadrant A | 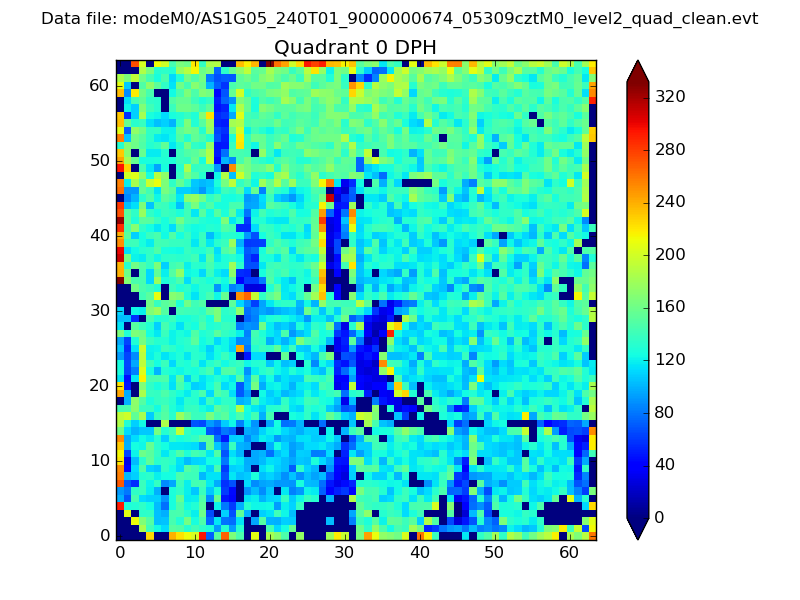 |
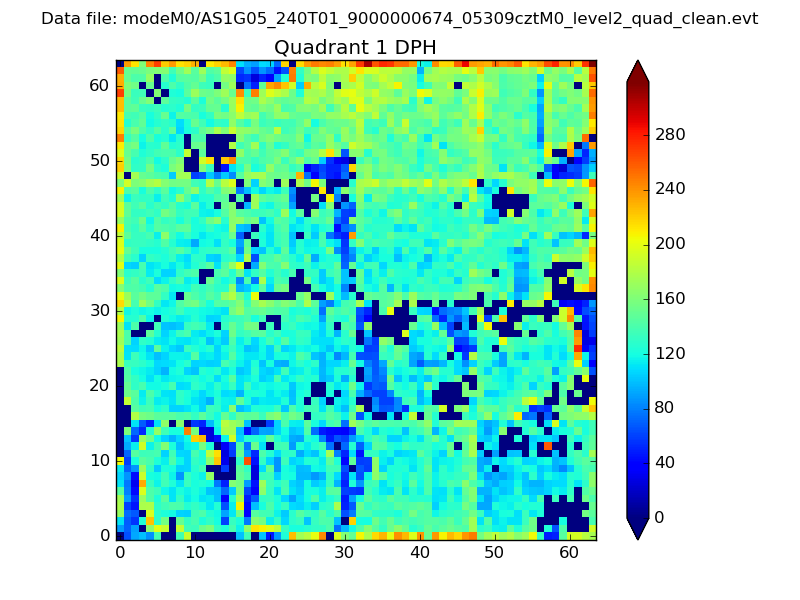 |
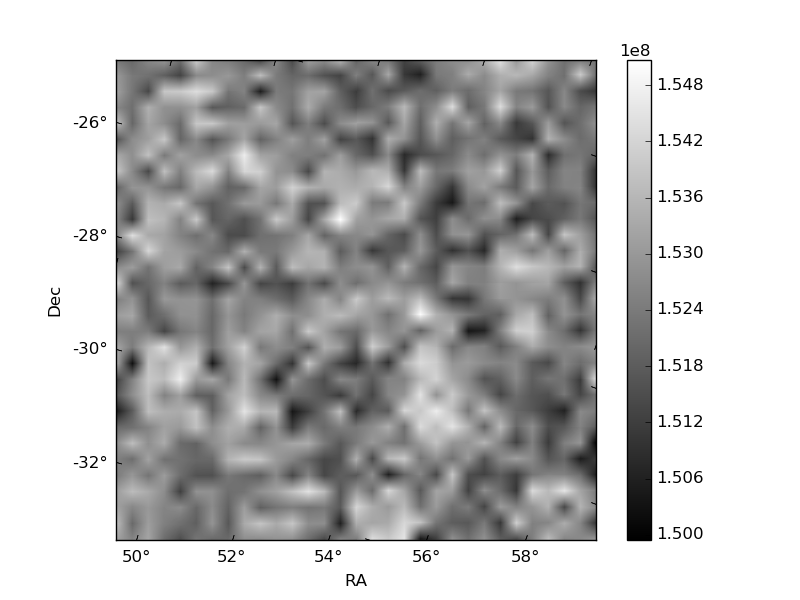
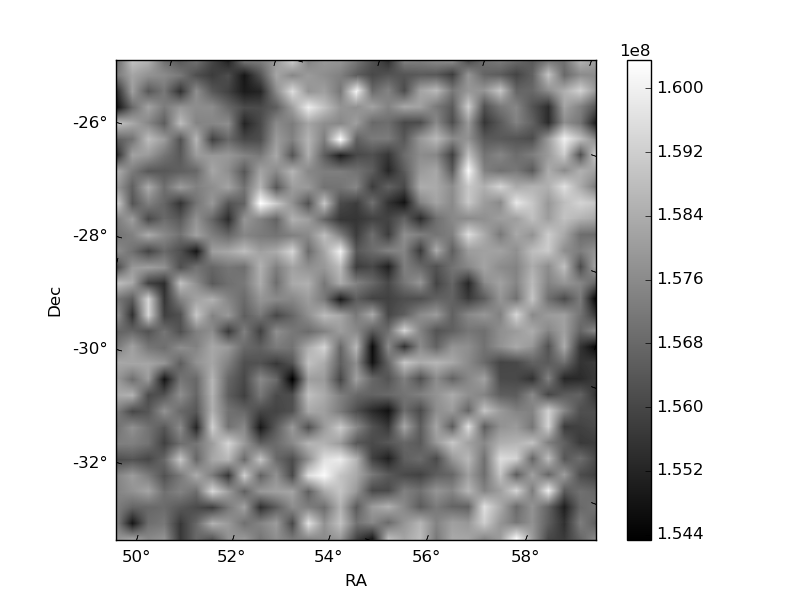
Quadrant B |
|---|---|---|---|
| Quadrant D | 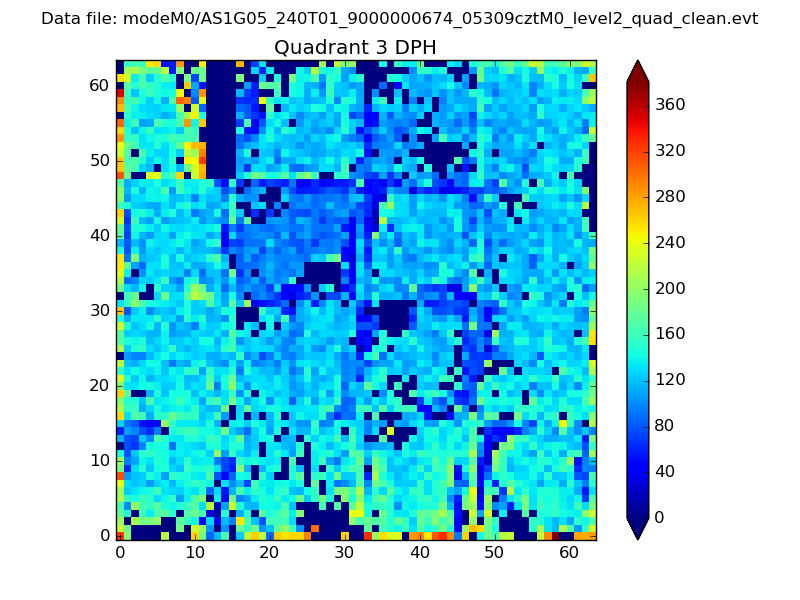 |
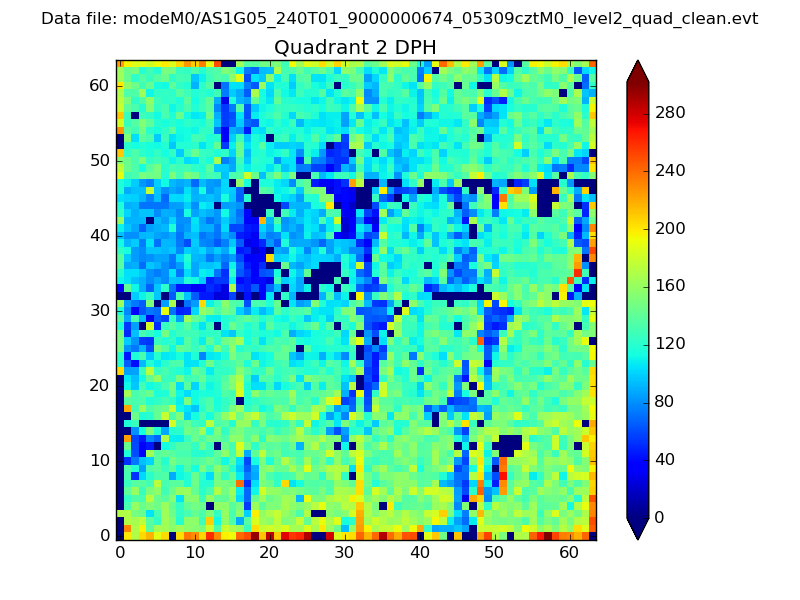 |
Quadrant C |
| Plot type | Count rate plots | Images |
|---|---|---|
| Comparison with Poisson distribution Blue bars denote a histogram of data divided into 1 sec bins. Red curve is a Poisson curve with rate = median count rate of data. |
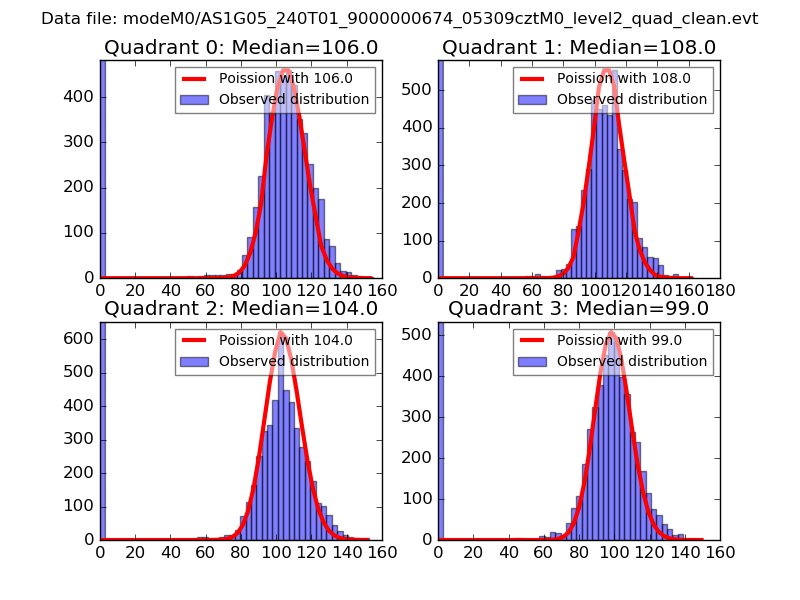 |
 |
| Quadrant-wise count rates Data is divided into 100 sec bins |
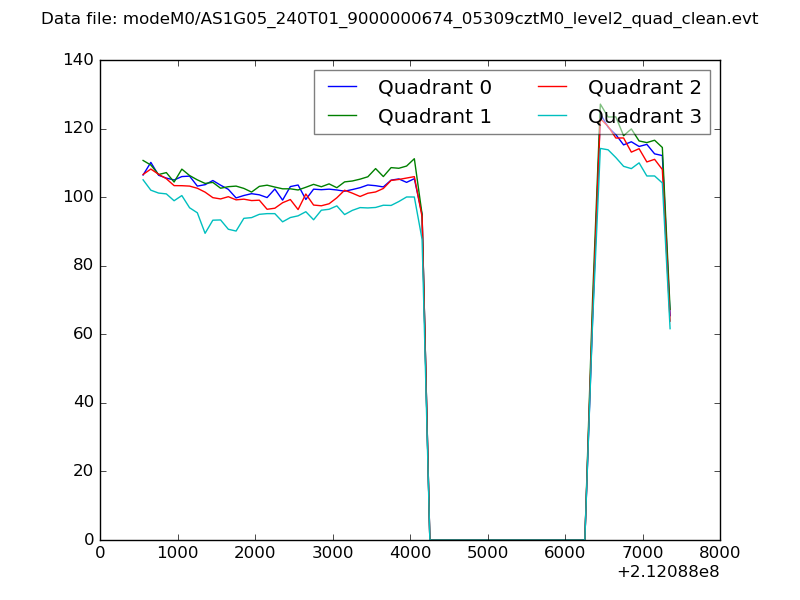 |
|
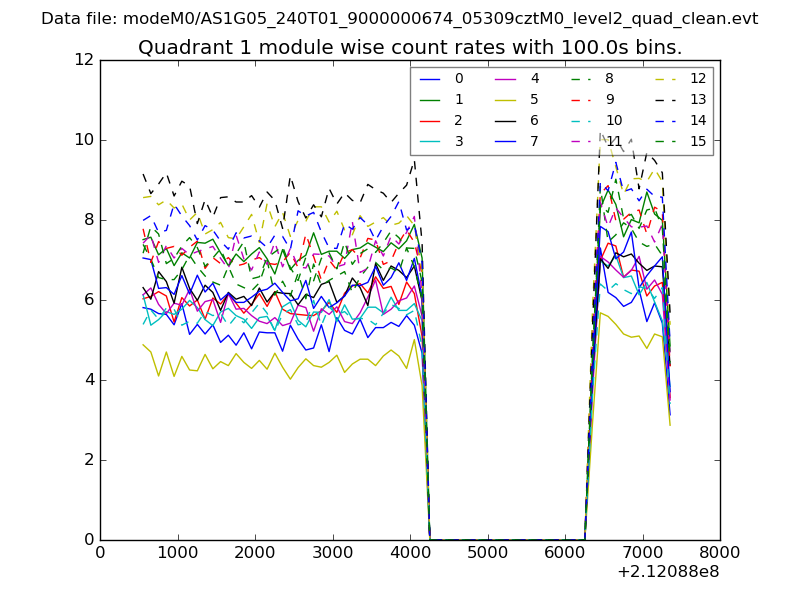
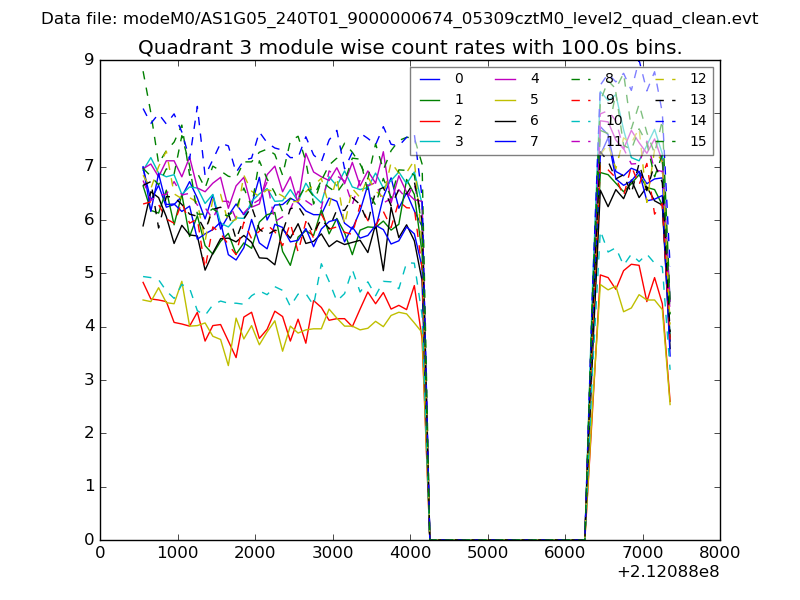
| Module-wise count rates for Quadrant A Data is divided into 100 sec bins |
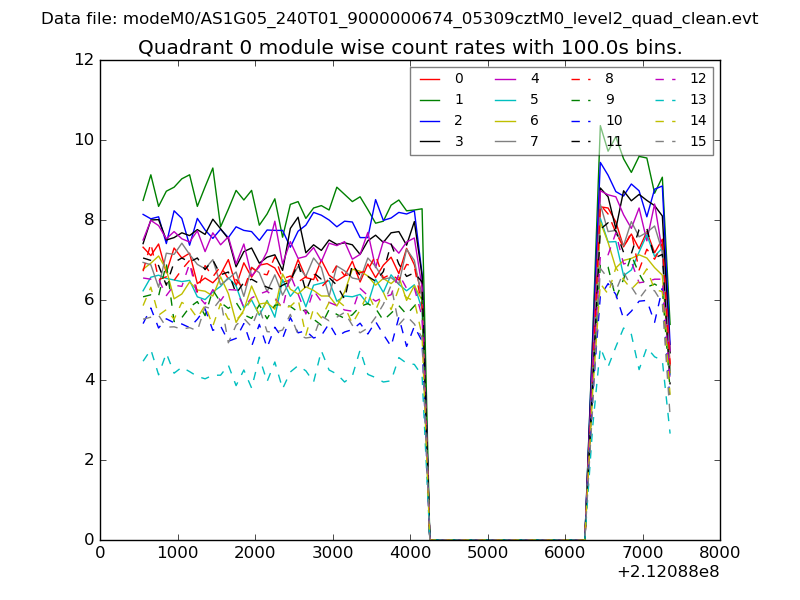 |
 |
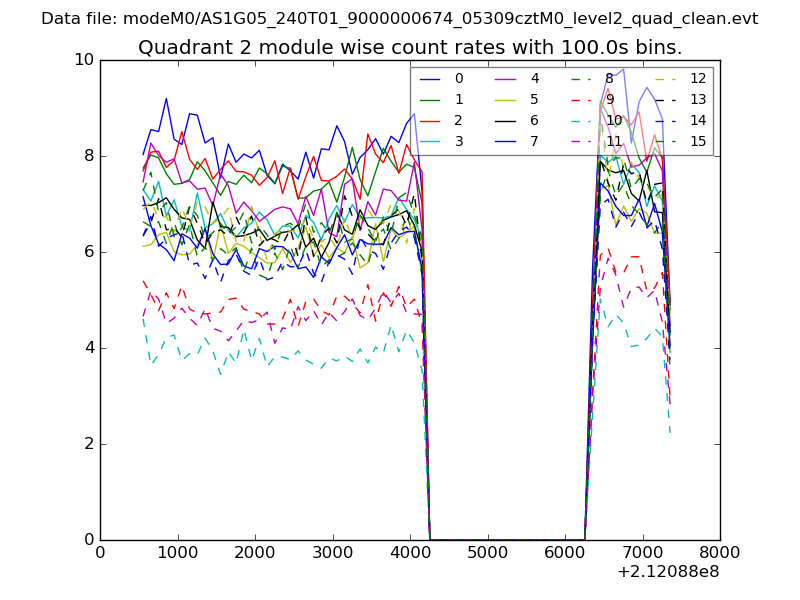
| Module-wise count rates for Quadrant B Data is divided into 100 sec bins |
 |
 |
| Module-wise count rates for Quadrant C Data is divided into 100 sec bins |
 |
 |
| Module-wise count rates for Quadrant D Data is divided into 100 sec bins |
 |
 |
| Parameter | Plot |
|---|---|
| CZT HV Monitor | 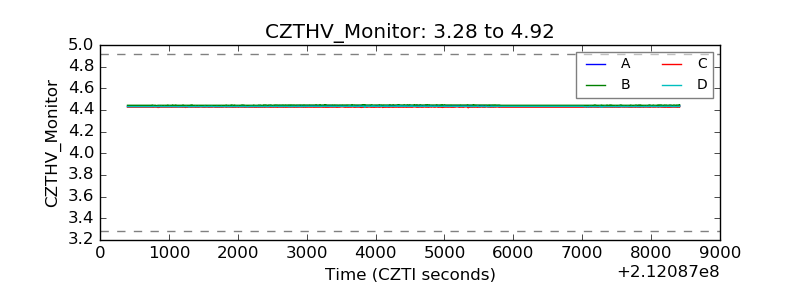 |
| D_VDD | 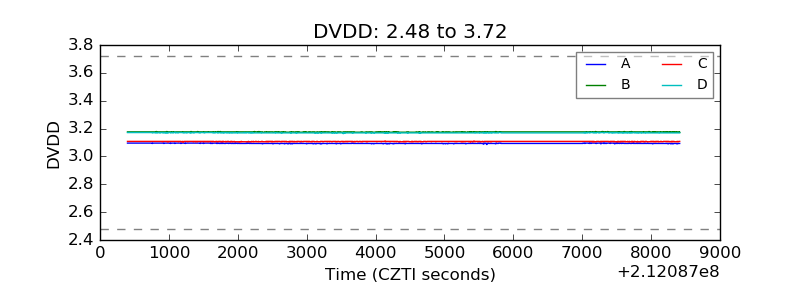 |
| Temperature 1 | 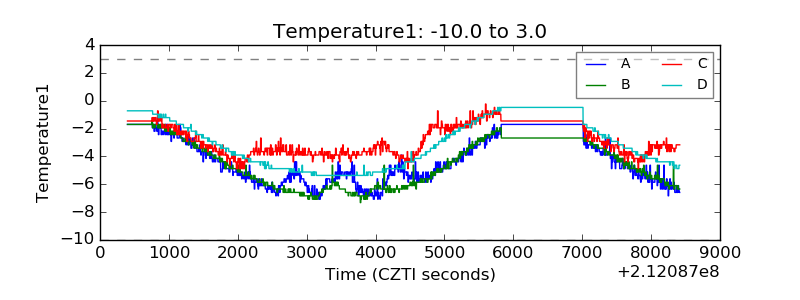 |
| Veto HV Monitor | 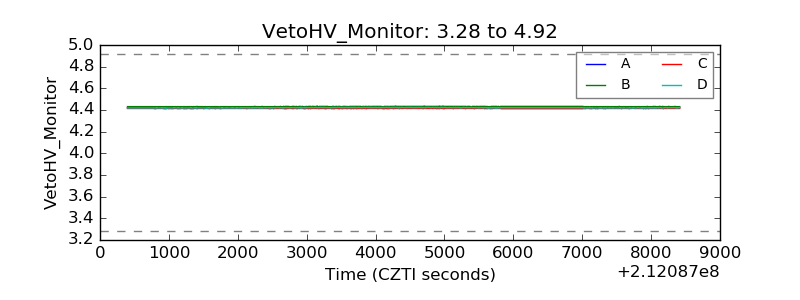 |
| Veto LLD | 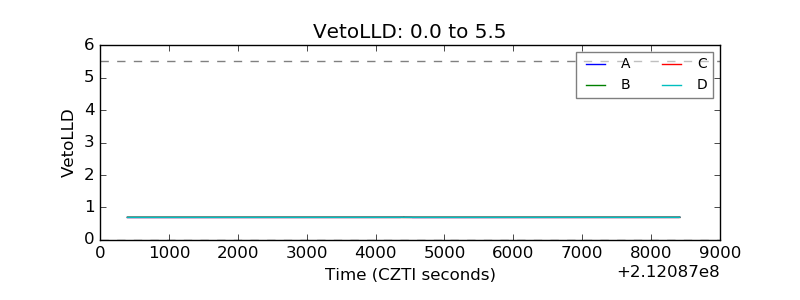 |
| Alpha Counter | 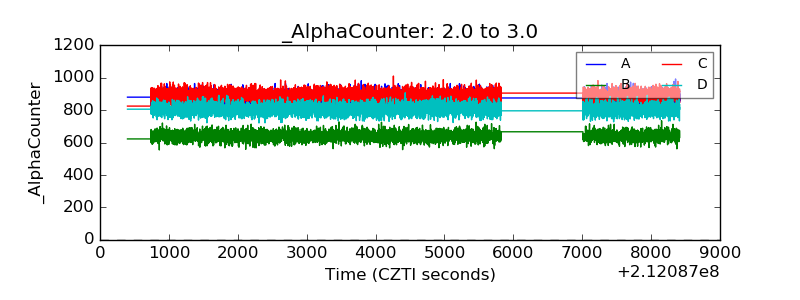 |
| _CPM_Rate | 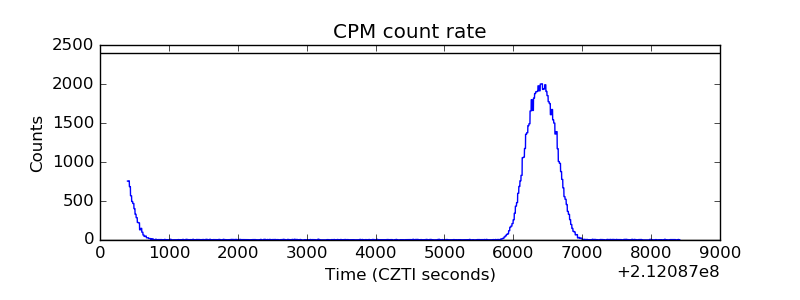 |
| CZT Counter | 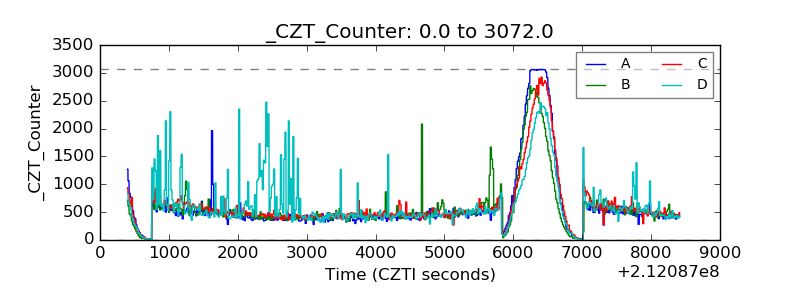 |
| +2.5 Volts monitor |  |
| +5 Volts monitor |  |
| _ROLL_ROT | 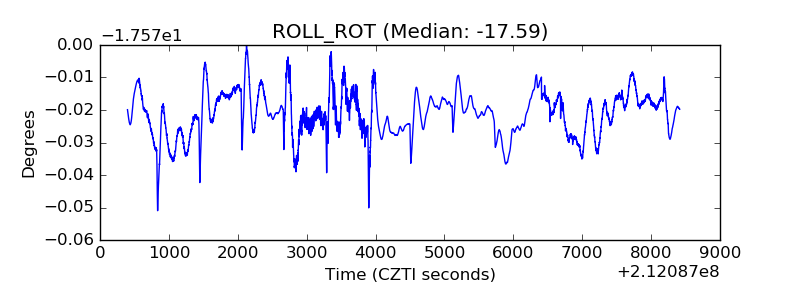 |
| _Roll_DEC | 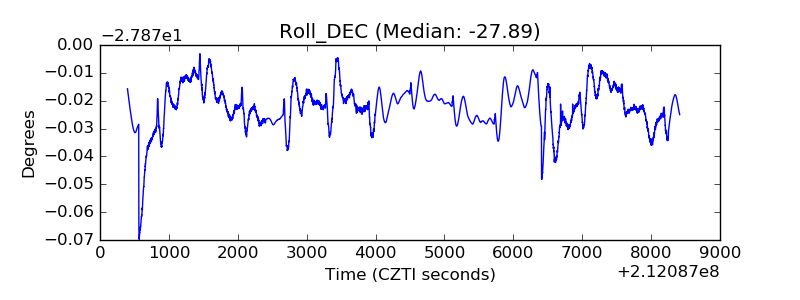 |
| _Roll_RA |  |
| Veto Counter | 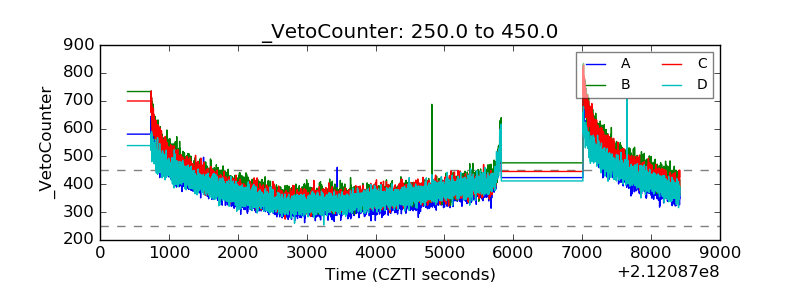 |