| Param | Original file | Final file |
|---|---|---|
| Filename | modeM0/AS1G05_240T01_9000000674_05311cztM0_level2.evt | modeM0/AS1G05_240T01_9000000674_05311cztM0_level2_quad_clean.evt |
| Size (bytes) | 493,223,040 | 92,191,680 |
| Size | 470.4 MB | 87.9 MB |
| Events in quadrant A | 3,466,988 | 577,052 |
| Events in quadrant B | 3,755,197 | 600,909 |
| Events in quadrant C | 3,518,410 | 577,881 |
| Events in quadrant D | 3,715,333 | 542,278 |
| Mode M0 | |||
|---|---|---|---|
| Quadrant | BADHDUFLAG | Total packets | Discarded packets |
| A | 0 | 14898 | 3 |
| B | 0 | 15693 | 2 |
| C | 0 | 15025 | 2 |
| D | 0 | 15716 | 2 |
| Mode SS | |||
|---|---|---|---|
| Quadrant | BADHDUFLAG | Total packets | Discarded packets |
| A | 0 | 146 | 0 |
| B | 0 | 146 | 0 |
| C | 0 | 146 | 0 |
| D | 0 | 146 | 0 |
| Mode M9 | |||
|---|---|---|---|
| Quadrant | BADHDUFLAG | Total packets | Discarded packets |
| A | 0 | 26 | 0 |
| B | 0 | 26 | 0 |
| C | 0 | 26 | 0 |
| D | 0 | 26 | 0 |
| Quadrant | Total seconds | Saturated seconds | Saturation percentage |
|---|---|---|---|
| A | 7089 | 45 | 0.634786% |
| B | 7089 | 87 | 1.227253% |
| C | 7089 | 15 | 0.211595% |
| D | 7089 | 39 | 0.550148% |
Noise dominated data is calculated using 1-second bins in cleaned event files. If a bin has >2000 counts, and if more than 50% of those come from <1% of pixels, then it is considered to be noise-dominated and hence unusable.
| Quadrant | # 1 sec bins | Bins with >0 counts | Bins with >2000 counts | High rate bins dominated by noise | Noise dominated (total time) | Noise dominated (detector-on time) | Marked lightcurve |
|---|---|---|---|---|---|---|---|
| A | 9664 | 7091 | 7 | 7 | 0.07% | 0.10% | 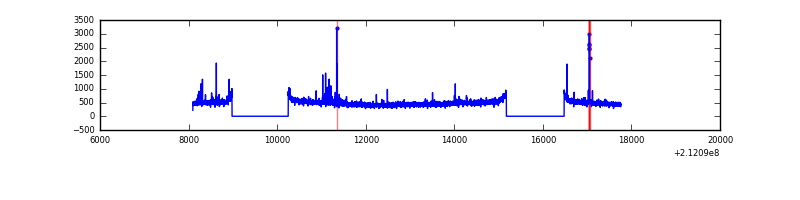 |
| B | 9664 | 7091 | 22 | 22 | 0.23% | 0.31% | 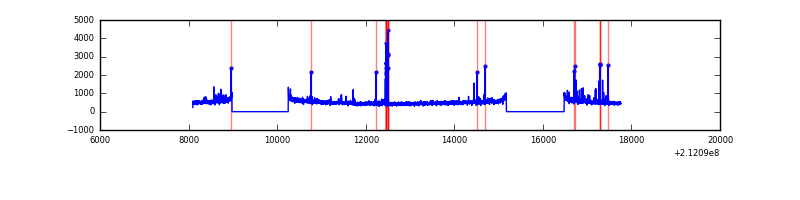 |
| C | 9664 | 7091 | 1 | 1 | 0.01% | 0.01% | 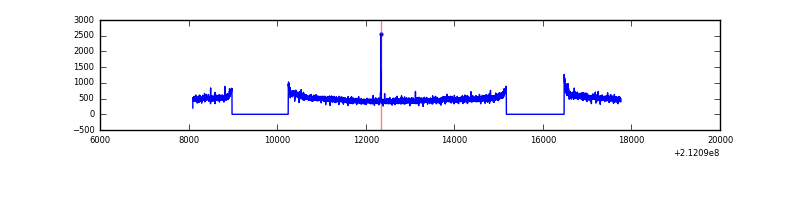 |
| D | 9664 | 7091 | 15 | 15 | 0.16% | 0.21% | 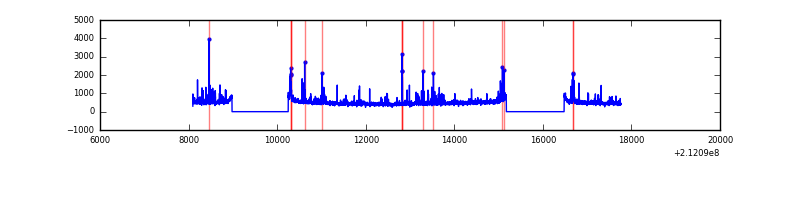 |
Top three noisy pixels from each quadrant. If the there are fewer than three noisy pixels in the level2.evt file, extra rows are filled as -1
| Pixel properties | Quadrant properties | ||||||
|---|---|---|---|---|---|---|---|
| Quadrant | DetID | PixID | Counts | Sigma | Mean | Median | Sigma |
| A | 13 | 251 | 78438 | 437.96 | 871 | 853 | 177.2 |
| A | 0 | 50 | 24332 | 132.54 | 871 | 853 | 177.2 |
| A | 0 | 247 | 13257 | 70.02 | 871 | 853 | 177.2 |
| B | 10 | 16 | 120974 | 717.67 | 888 | 866 | 167.4 |
| B | 4 | 48 | 75808 | 447.79 | 888 | 866 | 167.4 |
| B | 15 | 204 | 74433 | 439.58 | 888 | 866 | 167.4 |
| C | 1 | 16 | 168289 | 848.65 | 856 | 862 | 197.3 |
| C | 1 | 3 | 10075 | 46.7 | 856 | 862 | 197.3 |
| C | 13 | 61 | 6846 | 30.33 | 856 | 862 | 197.3 |
| D | 8 | 195 | 135887 | 653.77 | 844 | 820 | 206.6 |
| D | 2 | 234 | 106820 | 513.08 | 844 | 820 | 206.6 |
| D | 12 | 233 | 72741 | 348.12 | 844 | 820 | 206.6 |
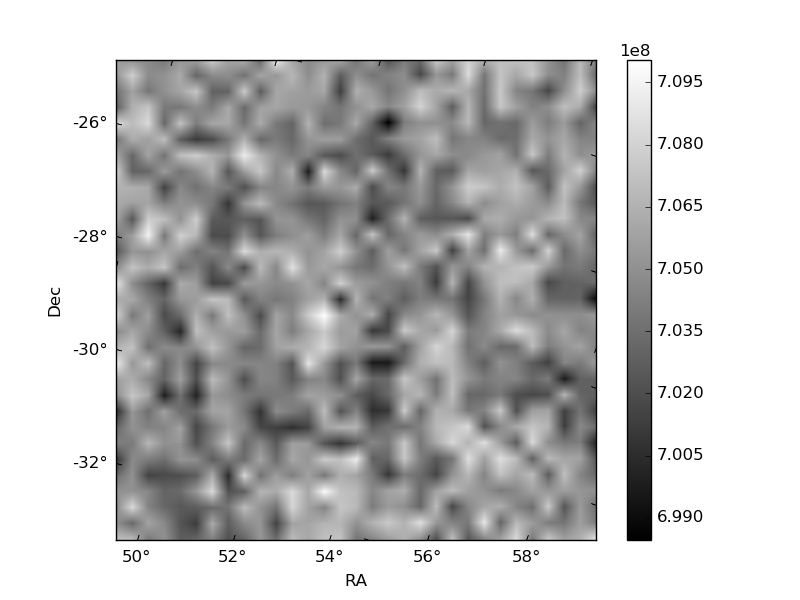
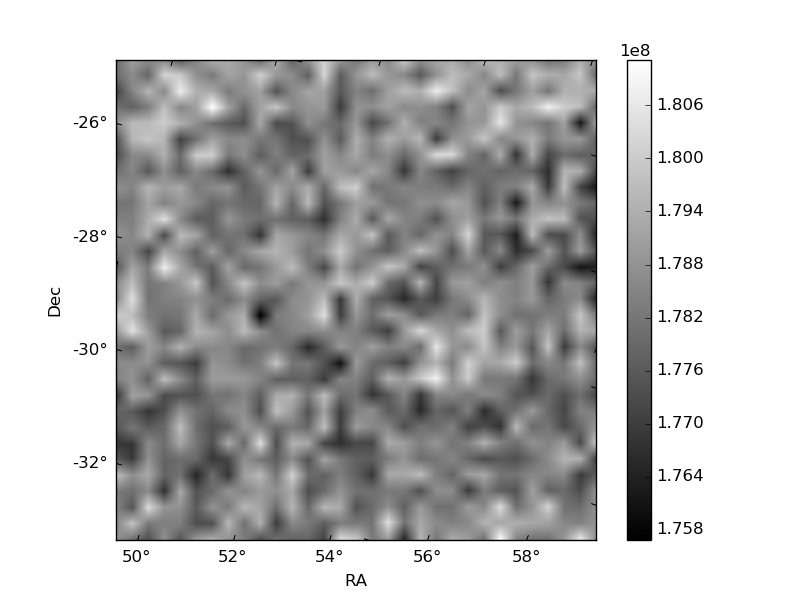
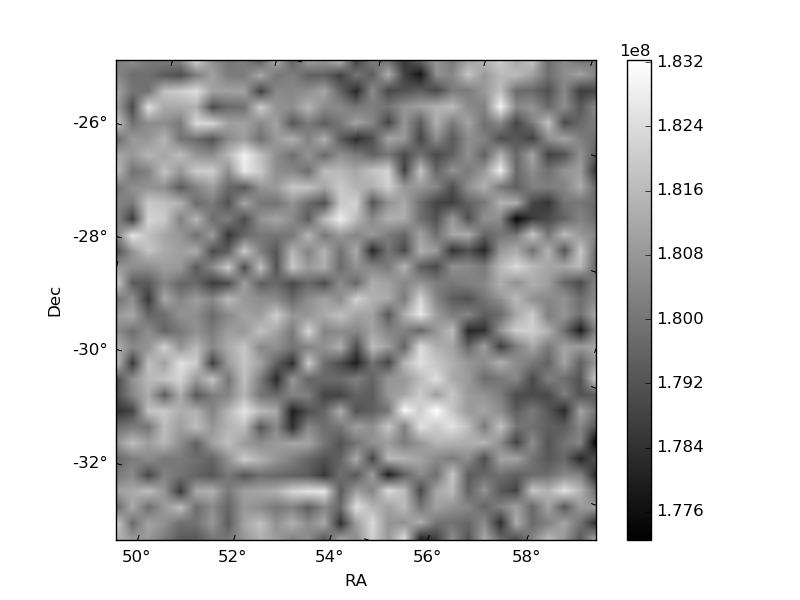
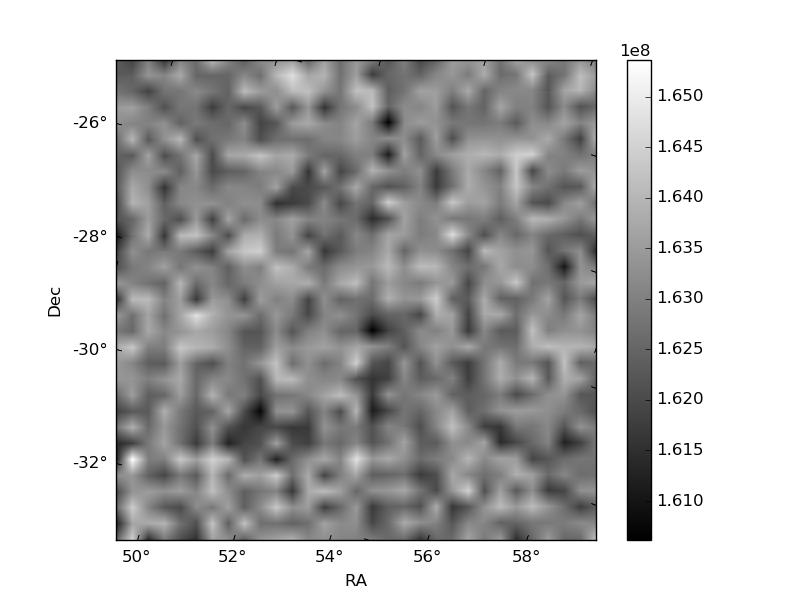
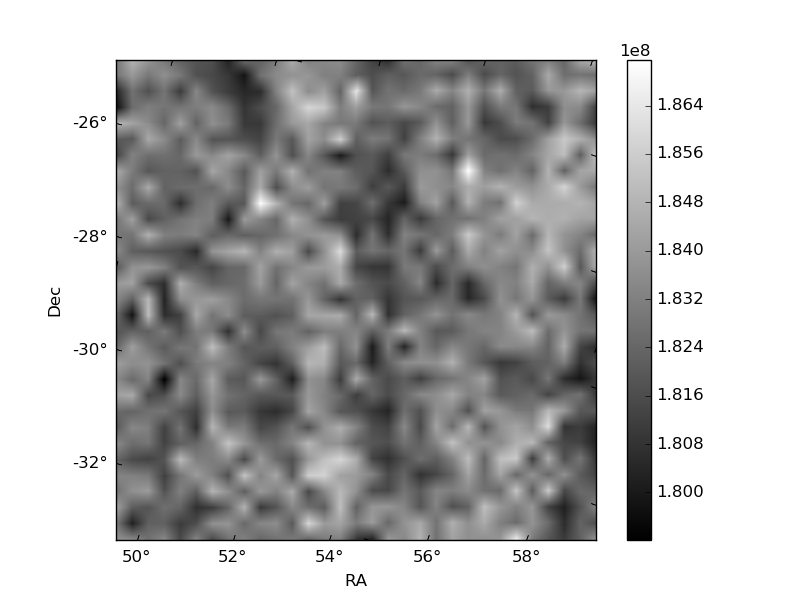
Histogram calculated using DETX and DETY for each event in the final _common_clean file
| Quadrant A | 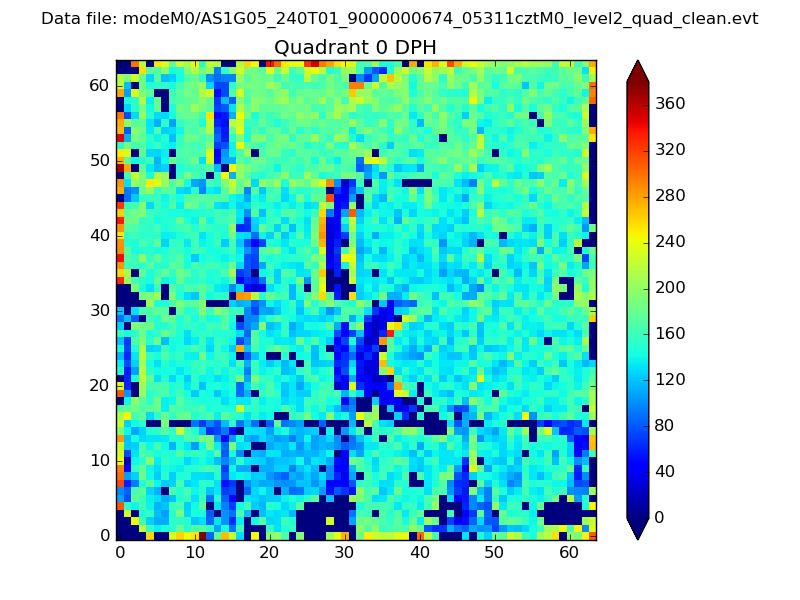 |
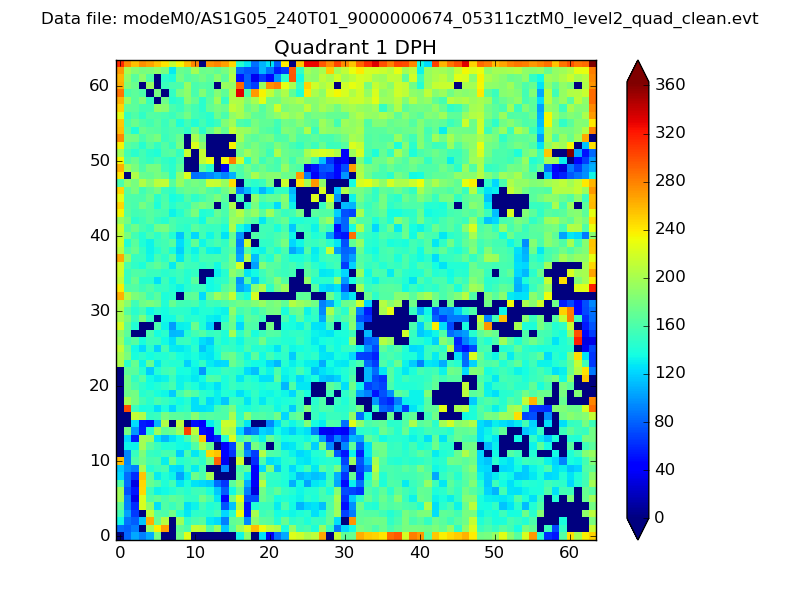 |
Quadrant B |
|---|---|---|---|
| Quadrant D | 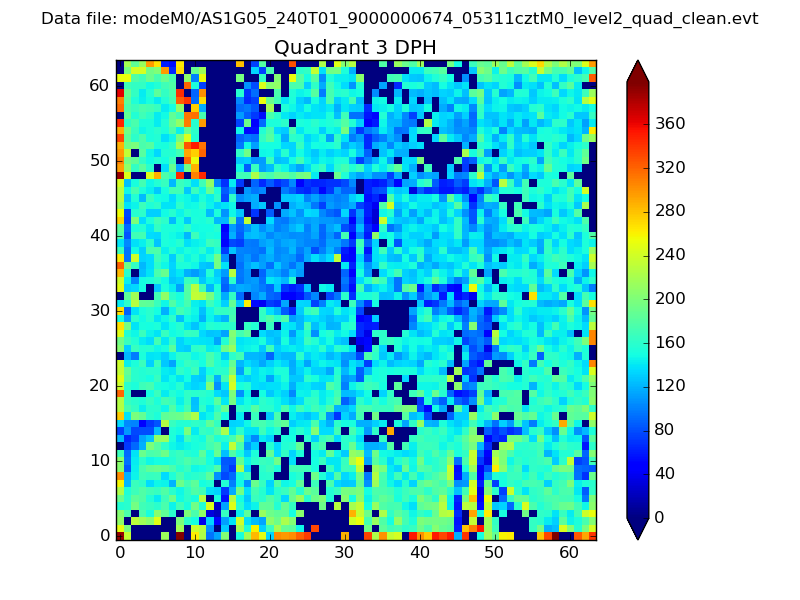 |
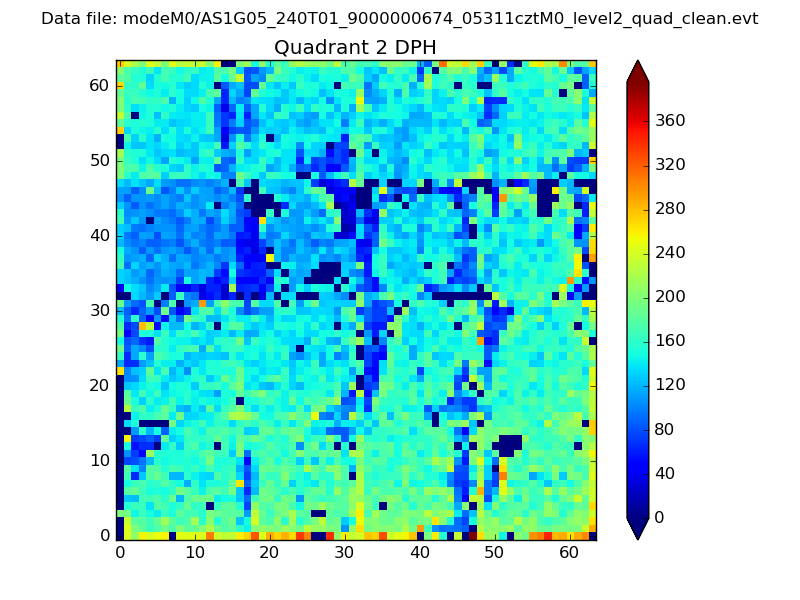 |
Quadrant C |
| Plot type | Count rate plots | Images |
|---|---|---|
| Comparison with Poisson distribution Blue bars denote a histogram of data divided into 1 sec bins. Red curve is a Poisson curve with rate = median count rate of data. |
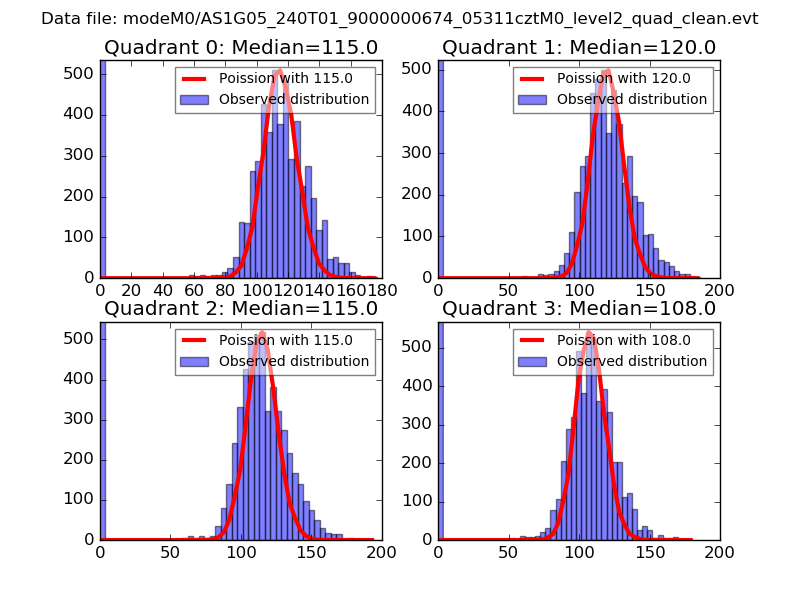 |
 |
| Quadrant-wise count rates Data is divided into 100 sec bins |
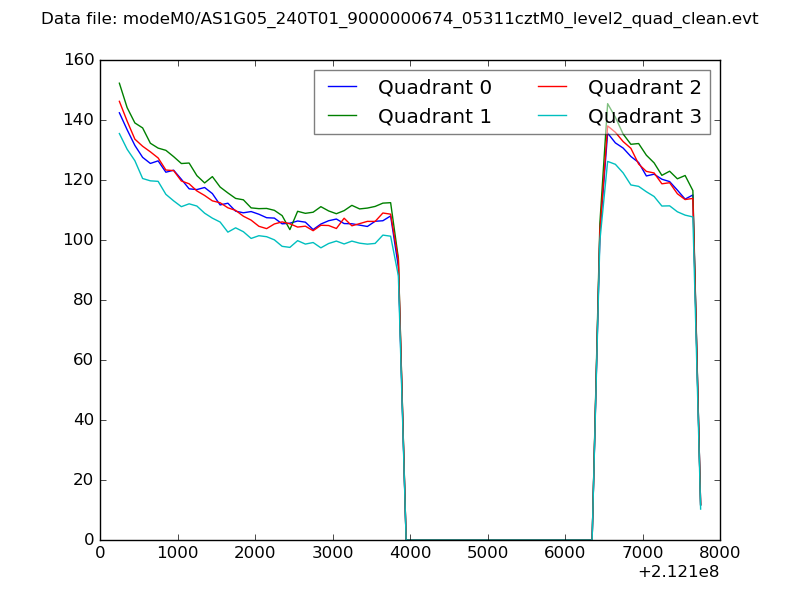 |
|
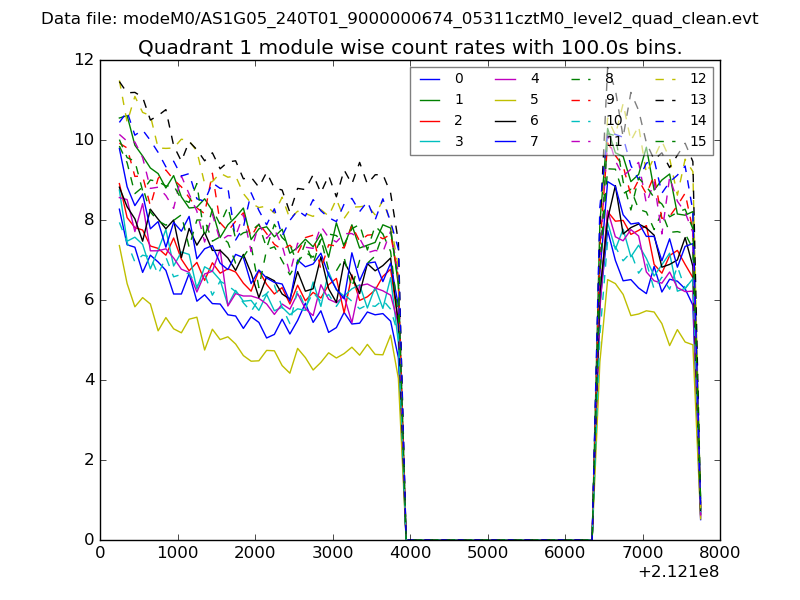
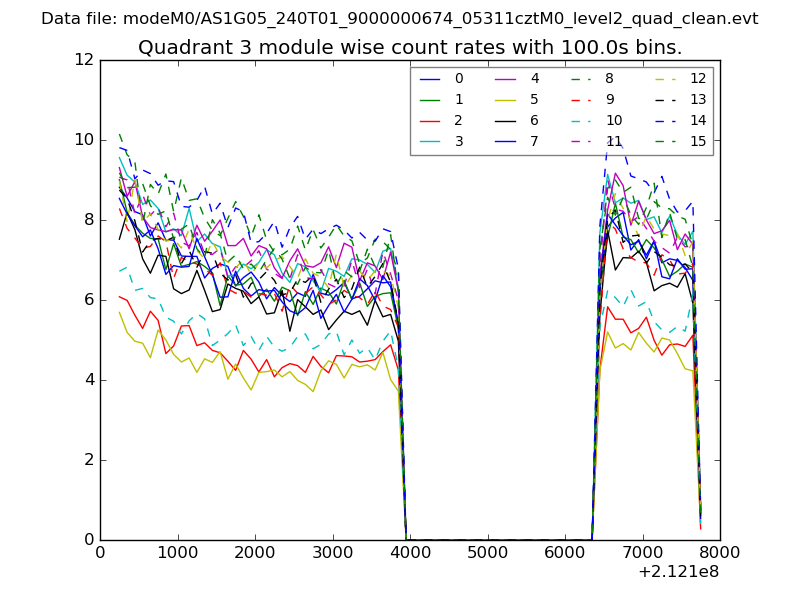
| Module-wise count rates for Quadrant A Data is divided into 100 sec bins |
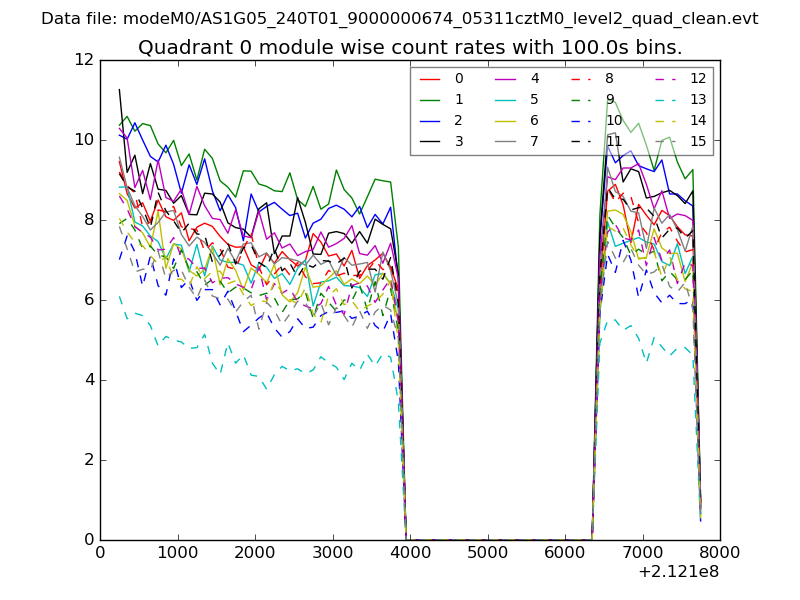 |
 |
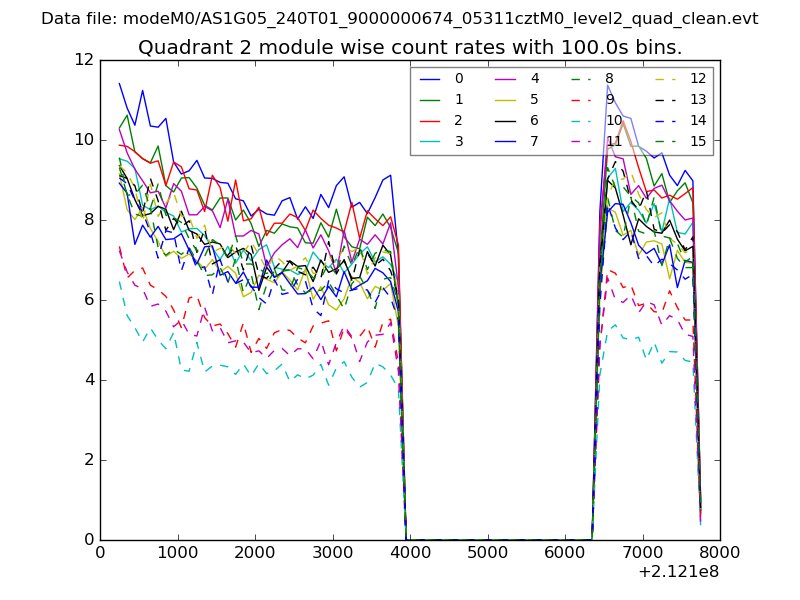
| Module-wise count rates for Quadrant B Data is divided into 100 sec bins |
 |
 |
| Module-wise count rates for Quadrant C Data is divided into 100 sec bins |
 |
 |
| Module-wise count rates for Quadrant D Data is divided into 100 sec bins |
 |
 |
| Parameter | Plot |
|---|---|
| CZT HV Monitor | 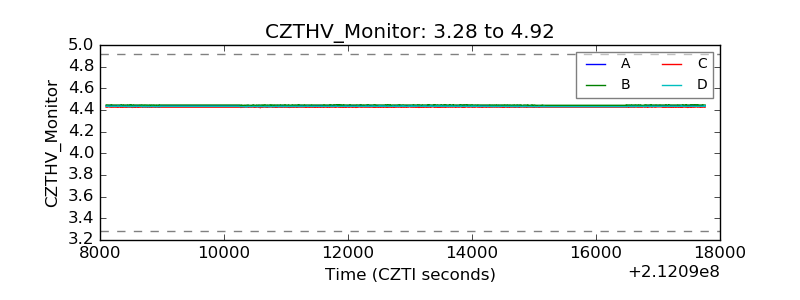 |
| D_VDD | 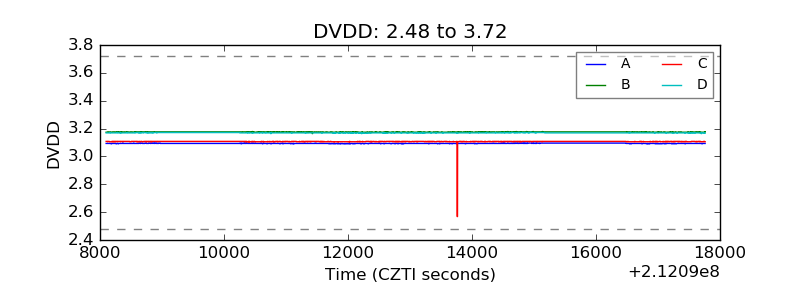 |
| Temperature 1 | 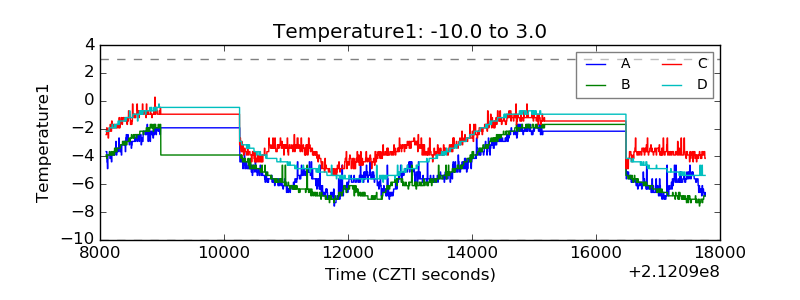 |
| Veto HV Monitor | 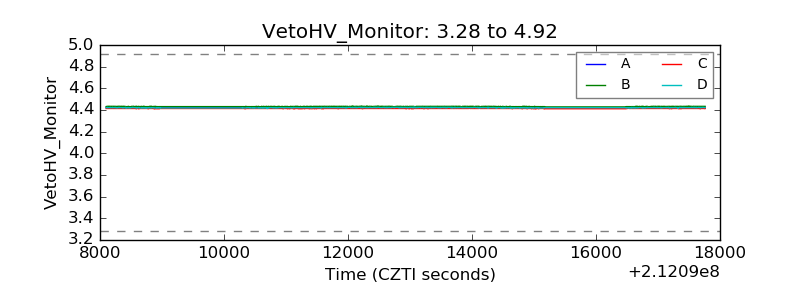 |
| Veto LLD | 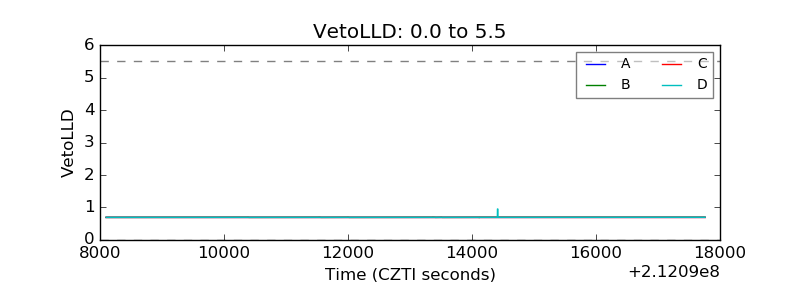 |
| Alpha Counter | 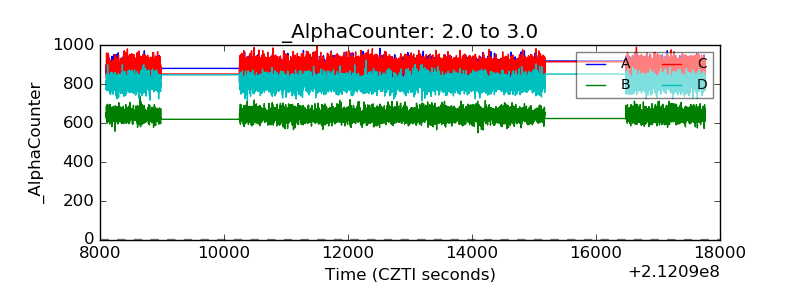 |
| _CPM_Rate | 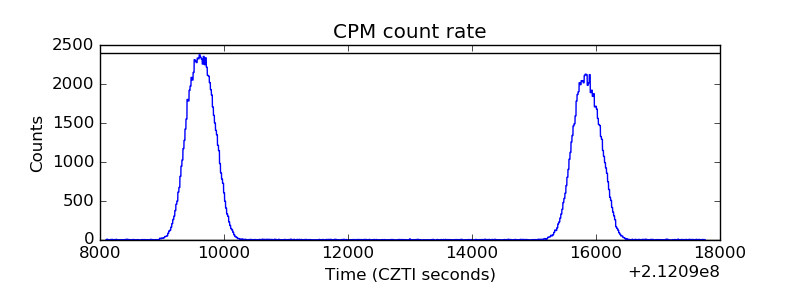 |
| CZT Counter | 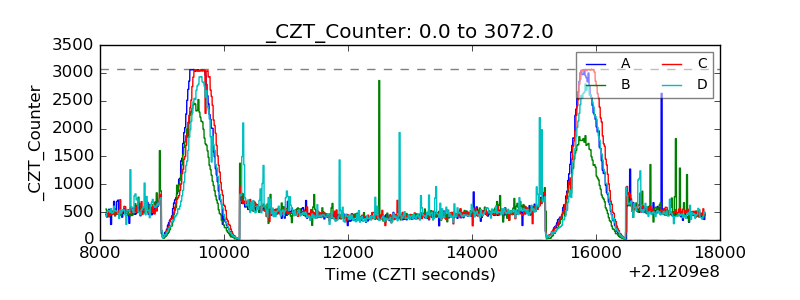 |
| +2.5 Volts monitor | 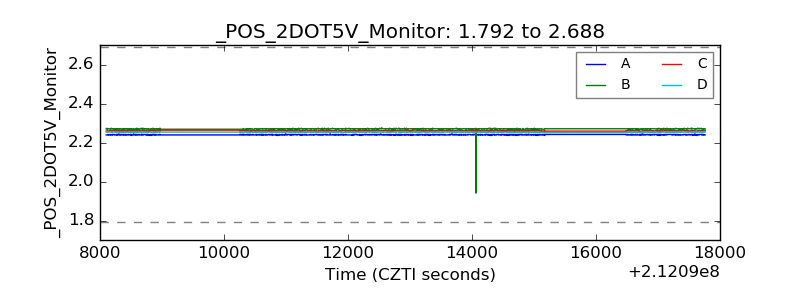 |
| +5 Volts monitor | 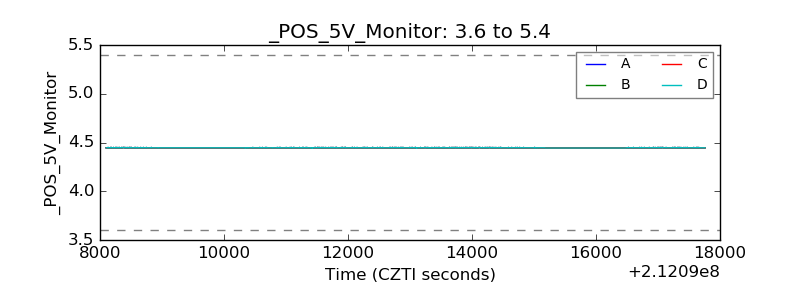 |
| _ROLL_ROT | 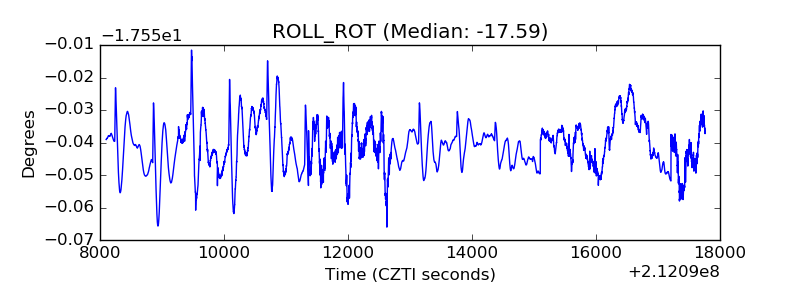 |
| _Roll_DEC | 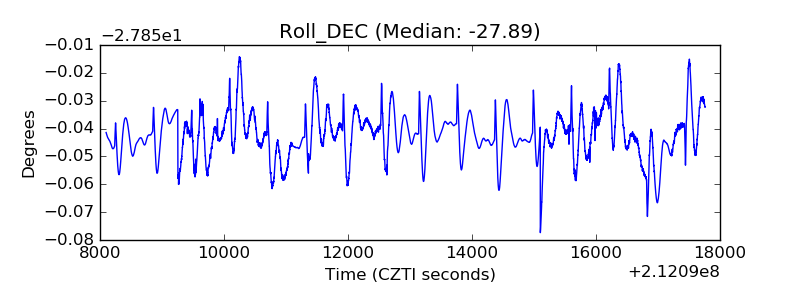 |
| _Roll_RA | 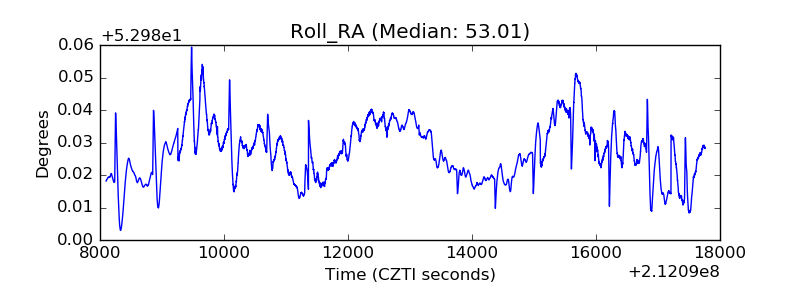 |
| Veto Counter | 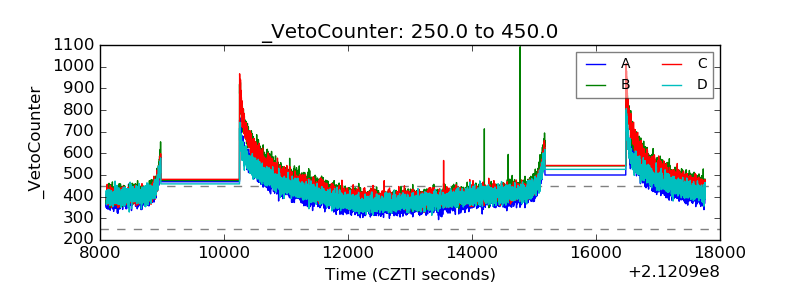 |