| Param | Original file | Final file |
|---|---|---|
| Filename | modeM0/AS1G05_240T01_9000000674_05312cztM0_level2.evt | modeM0/AS1G05_240T01_9000000674_05312cztM0_level2_quad_clean.evt |
| Size (bytes) | 463,680,000 | 90,469,440 |
| Size | 442.2 MB | 86.3 MB |
| Events in quadrant A | 3,110,278 | 573,058 |
| Events in quadrant B | 3,733,359 | 592,005 |
| Events in quadrant C | 3,305,067 | 572,735 |
| Events in quadrant D | 3,440,599 | 536,821 |
| Mode M0 | |||
|---|---|---|---|
| Quadrant | BADHDUFLAG | Total packets | Discarded packets |
| A | 0 | 13809 | 3 |
| B | 0 | 15617 | 2 |
| C | 0 | 14046 | 2 |
| D | 0 | 14835 | 2 |
| Mode SS | |||
|---|---|---|---|
| Quadrant | BADHDUFLAG | Total packets | Discarded packets |
| A | 0 | 136 | 0 |
| B | 0 | 136 | 0 |
| C | 0 | 136 | 0 |
| D | 0 | 136 | 0 |
| Mode M9 | |||
|---|---|---|---|
| Quadrant | BADHDUFLAG | Total packets | Discarded packets |
| A | 0 | 21 | 0 |
| B | 0 | 21 | 0 |
| C | 0 | 21 | 0 |
| D | 0 | 22 | 0 |
| Quadrant | Total seconds | Saturated seconds | Saturation percentage |
|---|---|---|---|
| A | 6668 | 42 | 0.629874% |
| B | 6668 | 152 | 2.279544% |
| C | 6668 | 25 | 0.374925% |
| D | 6668 | 105 | 1.574685% |
Noise dominated data is calculated using 1-second bins in cleaned event files. If a bin has >2000 counts, and if more than 50% of those come from <1% of pixels, then it is considered to be noise-dominated and hence unusable.
| Quadrant | # 1 sec bins | Bins with >0 counts | Bins with >2000 counts | High rate bins dominated by noise | Noise dominated (total time) | Noise dominated (detector-on time) | Marked lightcurve |
|---|---|---|---|---|---|---|---|
| A | 7978 | 6670 | 6 | 6 | 0.08% | 0.09% | 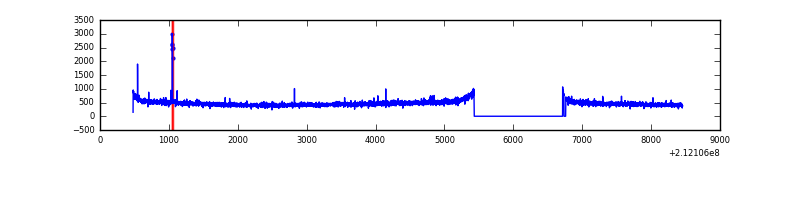 |
| B | 7978 | 6670 | 44 | 44 | 0.55% | 0.66% | 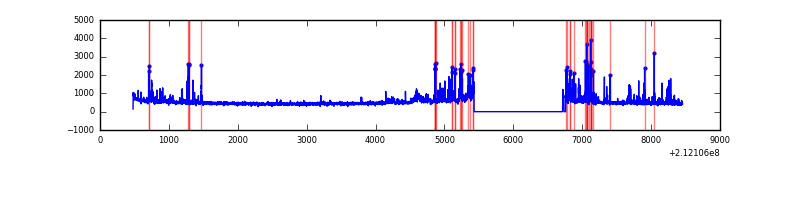 |
| C | 7978 | 6670 | 1 | 1 | 0.01% | 0.01% | 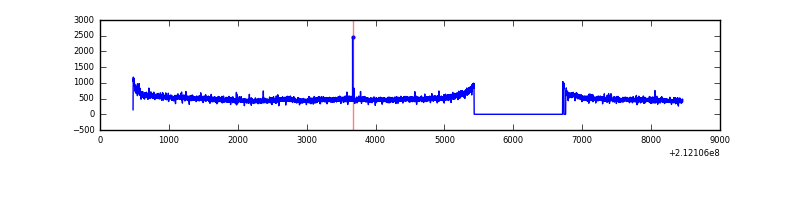 |
| D | 7978 | 6670 | 63 | 63 | 0.79% | 0.94% | 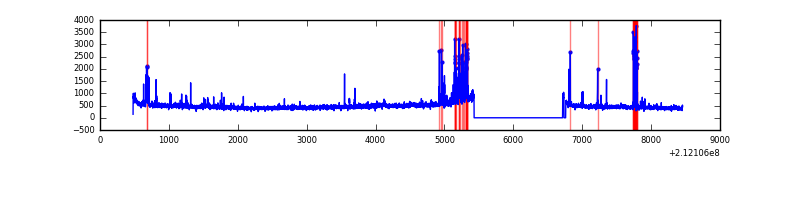 |
Top three noisy pixels from each quadrant. If the there are fewer than three noisy pixels in the level2.evt file, extra rows are filled as -1
| Pixel properties | Quadrant properties | ||||||
|---|---|---|---|---|---|---|---|
| Quadrant | DetID | PixID | Counts | Sigma | Mean | Median | Sigma |
| A | 0 | 50 | 22366 | 134.14 | 795 | 780 | 160.9 |
| A | 13 | 251 | 10861 | 62.65 | 795 | 780 | 160.9 |
| A | 0 | 247 | 9887 | 56.59 | 795 | 780 | 160.9 |
| B | 10 | 16 | 433059 | 2846.47 | 812 | 793 | 151.9 |
| B | 4 | 48 | 92107 | 601.3 | 812 | 793 | 151.9 |
| B | 4 | 80 | 30468 | 195.41 | 812 | 793 | 151.9 |
| C | 1 | 16 | 209796 | 1143.73 | 791 | 796 | 182.7 |
| C | 1 | 3 | 8028 | 39.58 | 791 | 796 | 182.7 |
| C | 13 | 61 | 6473 | 31.07 | 791 | 796 | 182.7 |
| D | 8 | 195 | 150939 | 791.57 | 772 | 748 | 189.7 |
| D | 12 | 233 | 145617 | 763.52 | 772 | 748 | 189.7 |
| D | 2 | 14 | 128359 | 672.57 | 772 | 748 | 189.7 |
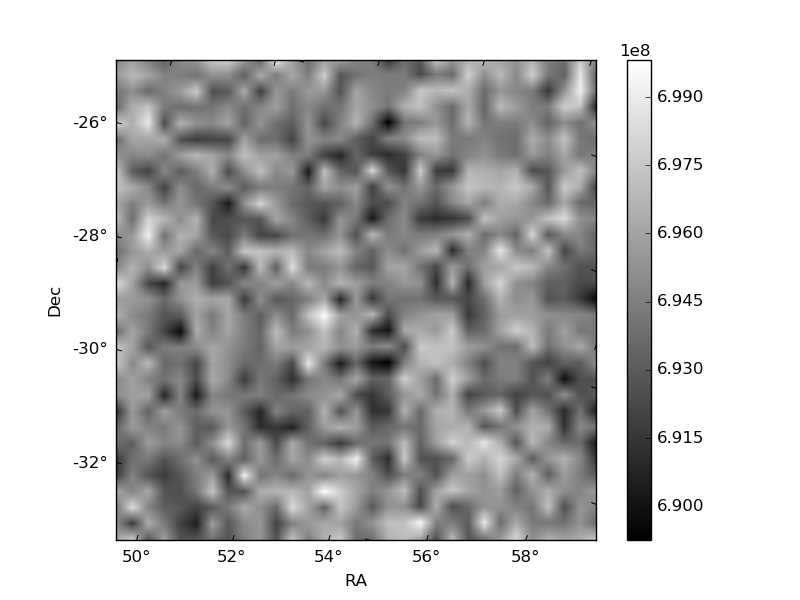
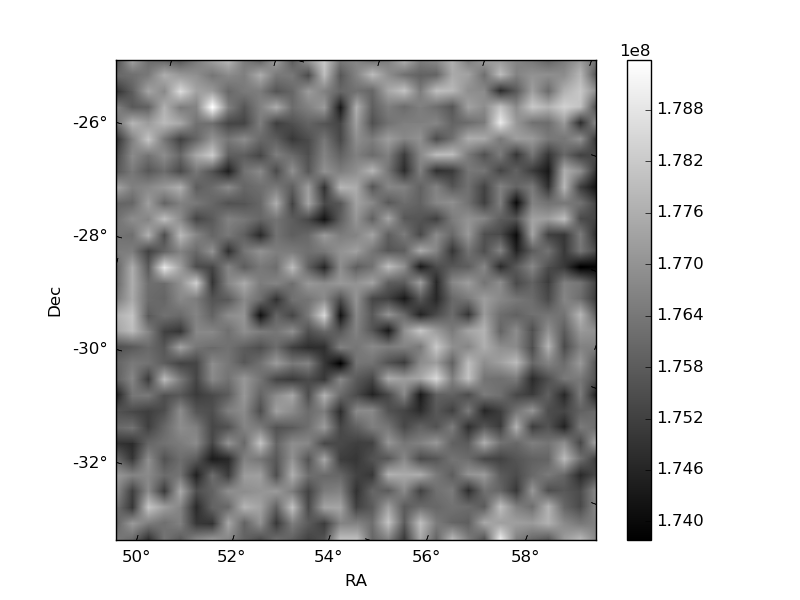
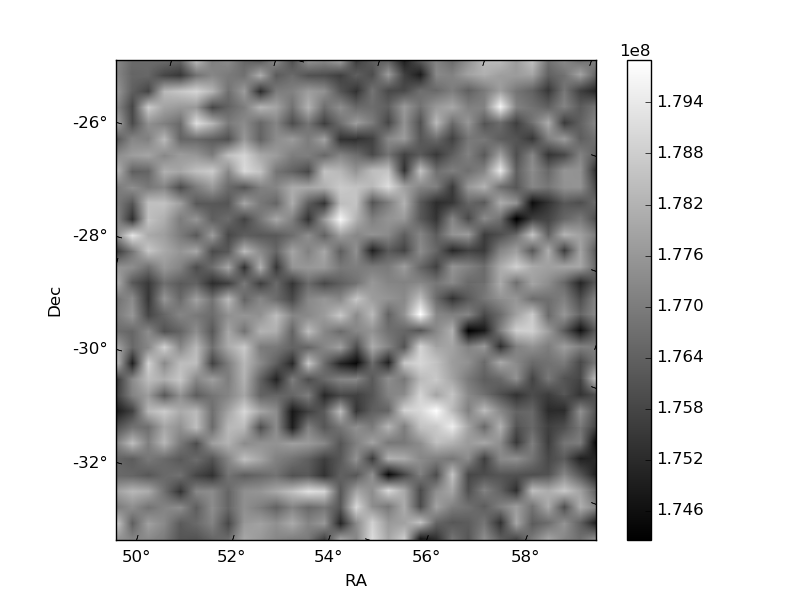
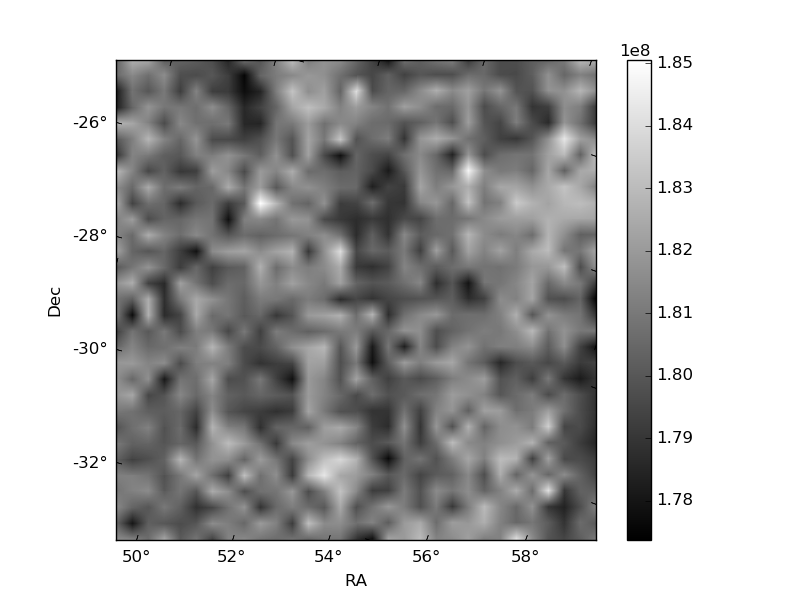
Histogram calculated using DETX and DETY for each event in the final _common_clean file
| Quadrant A | 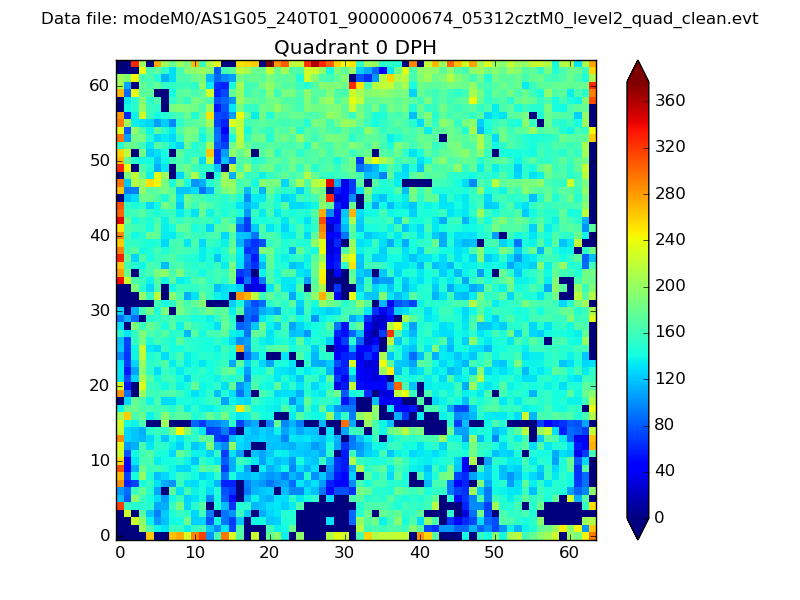 |
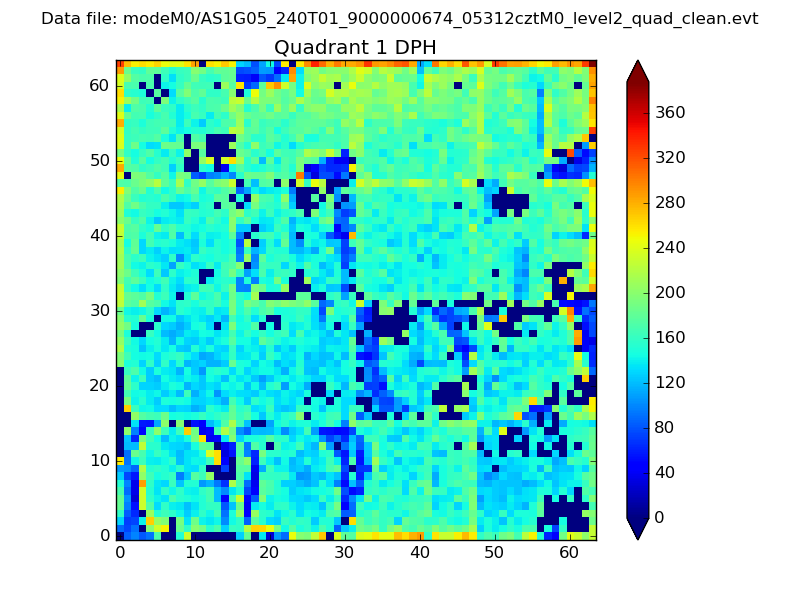 |
Quadrant B |
|---|---|---|---|
| Quadrant D | 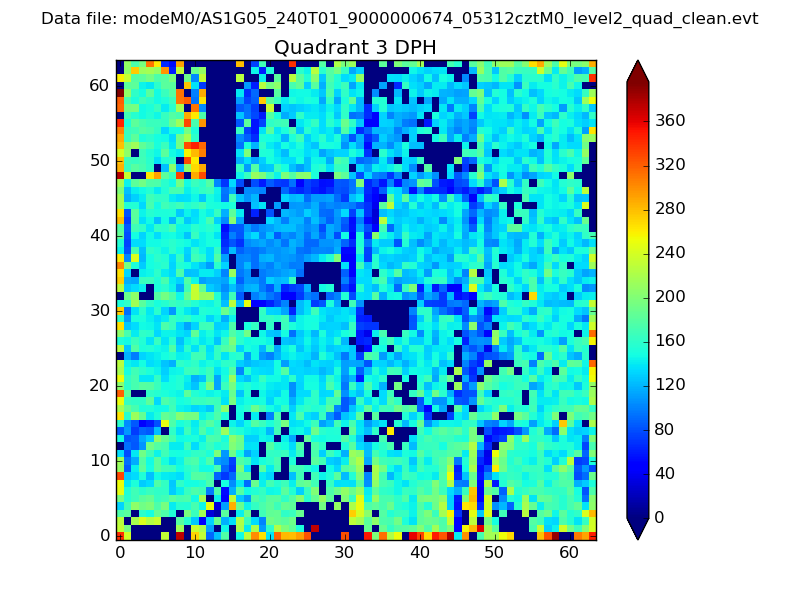 |
 |
Quadrant C |
| Plot type | Count rate plots | Images |
|---|---|---|
| Comparison with Poisson distribution Blue bars denote a histogram of data divided into 1 sec bins. Red curve is a Poisson curve with rate = median count rate of data. |
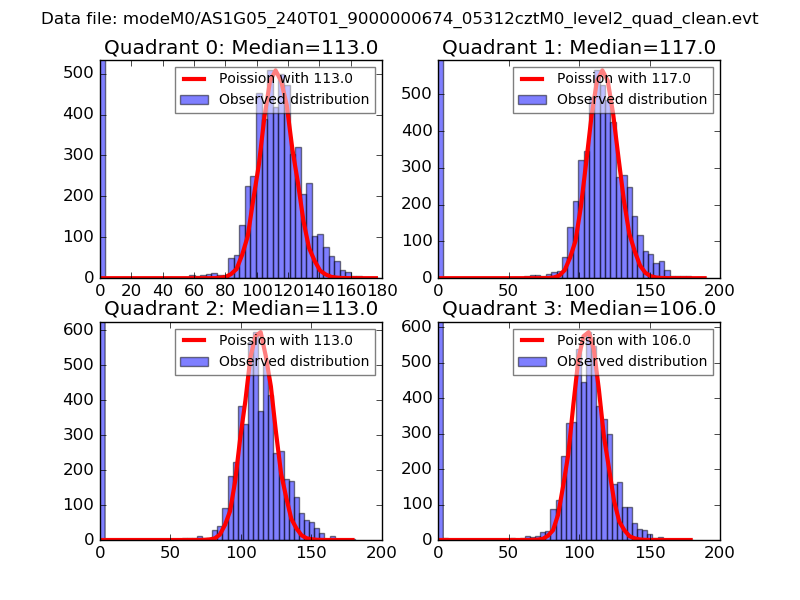 |
 |
| Quadrant-wise count rates Data is divided into 100 sec bins |
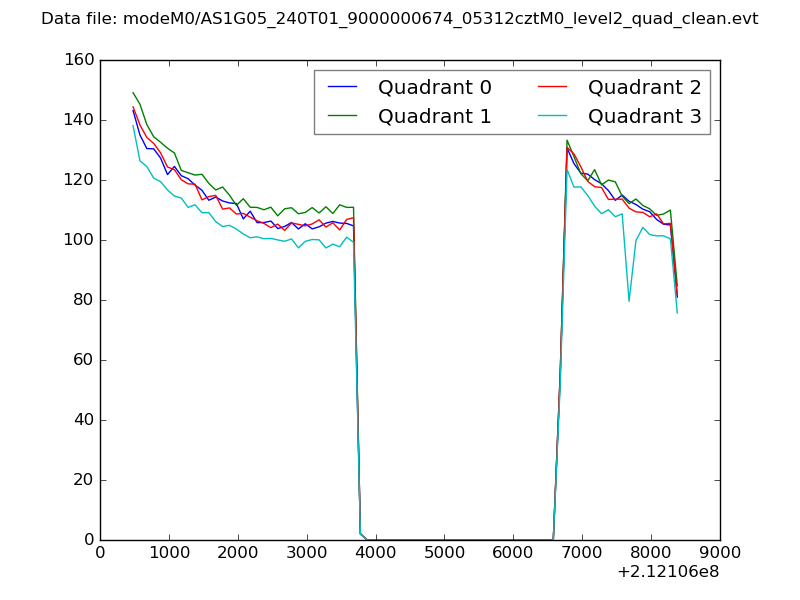 |
|
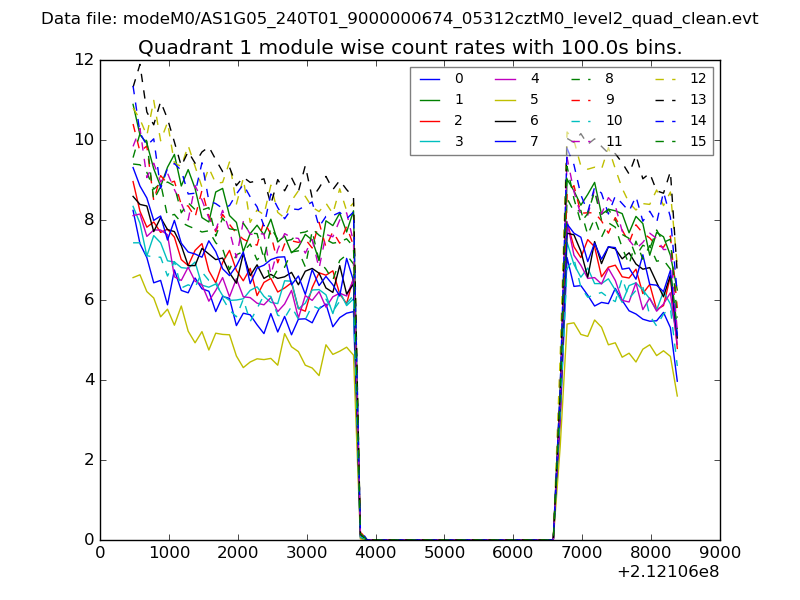
| Module-wise count rates for Quadrant A Data is divided into 100 sec bins |
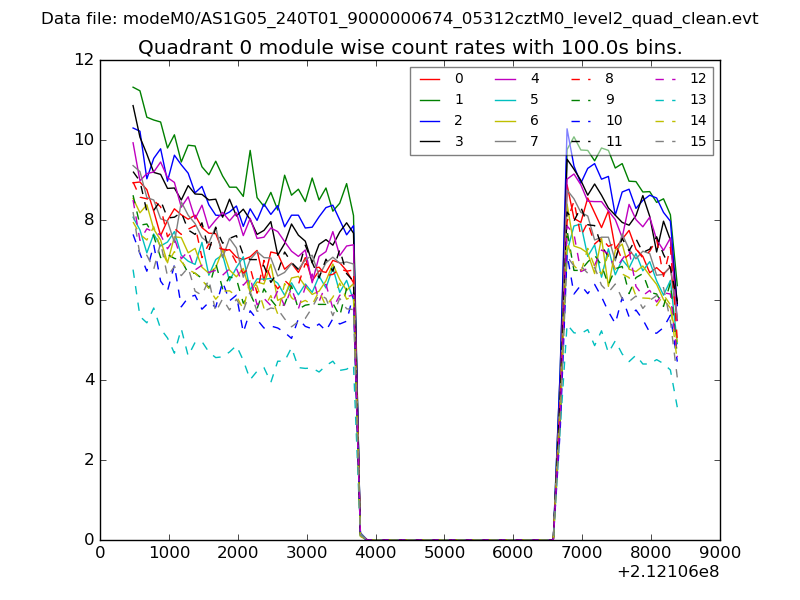 |
 |
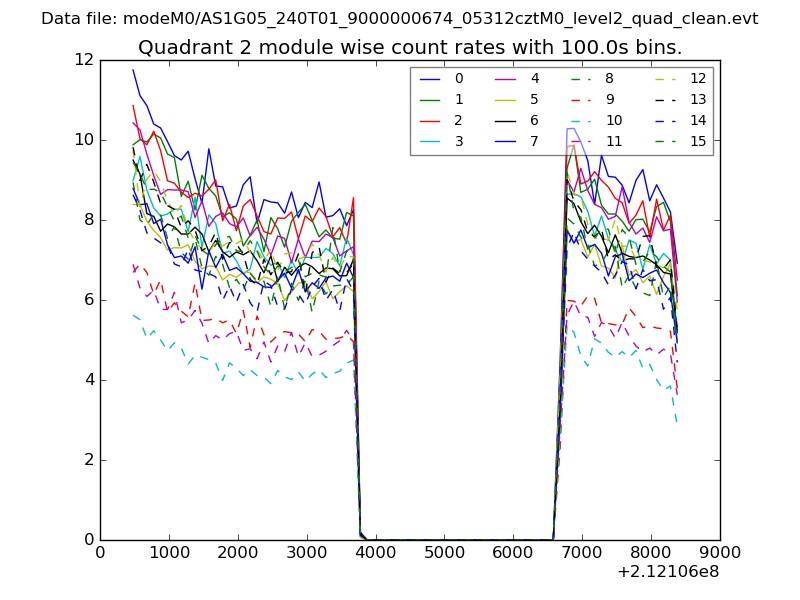
| Module-wise count rates for Quadrant B Data is divided into 100 sec bins |
 |
 |
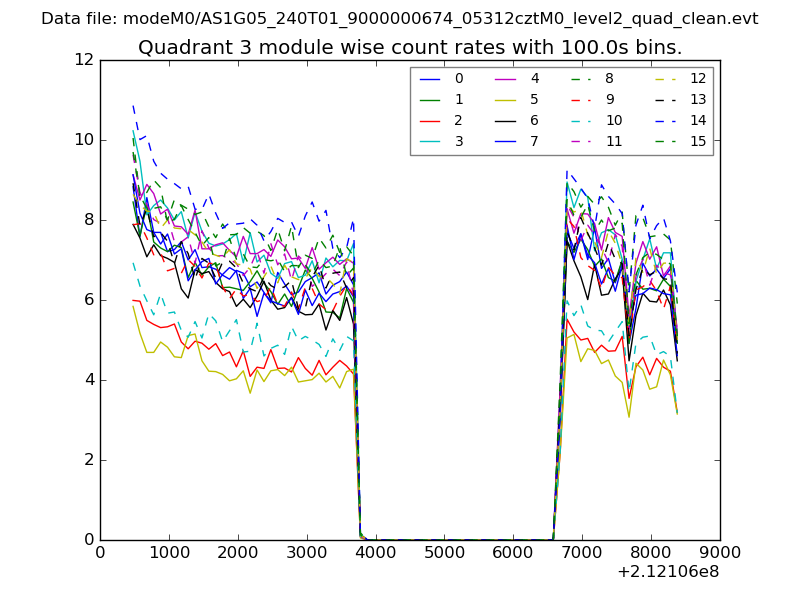
| Module-wise count rates for Quadrant C Data is divided into 100 sec bins |
 |
 |
| Module-wise count rates for Quadrant D Data is divided into 100 sec bins |
 |
 |
| Parameter | Plot |
|---|---|
| CZT HV Monitor | 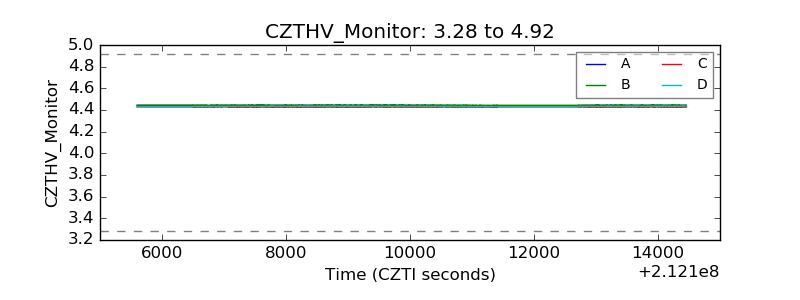 |
| D_VDD | 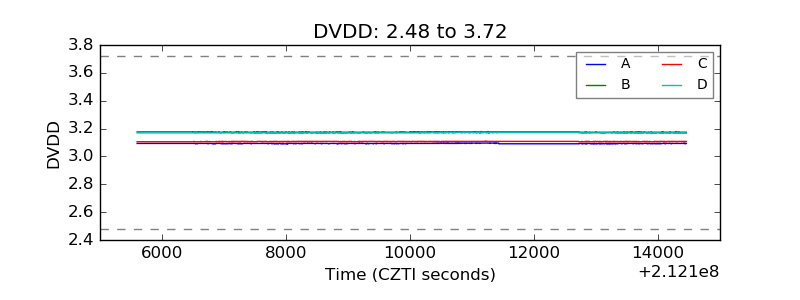 |
| Temperature 1 | 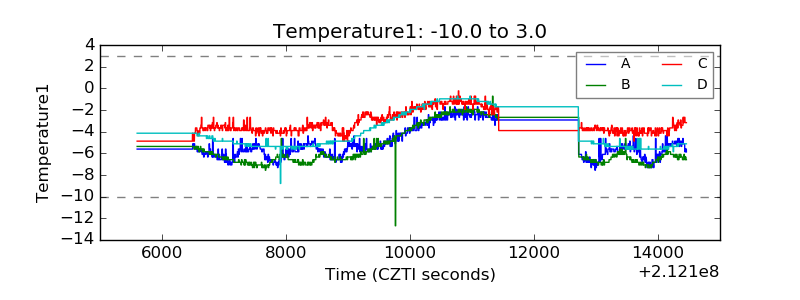 |
| Veto HV Monitor | 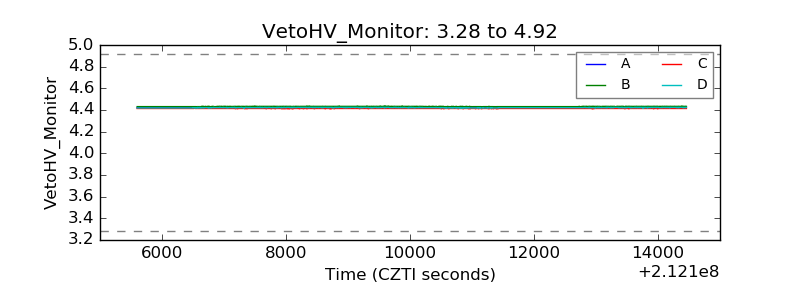 |
| Veto LLD | 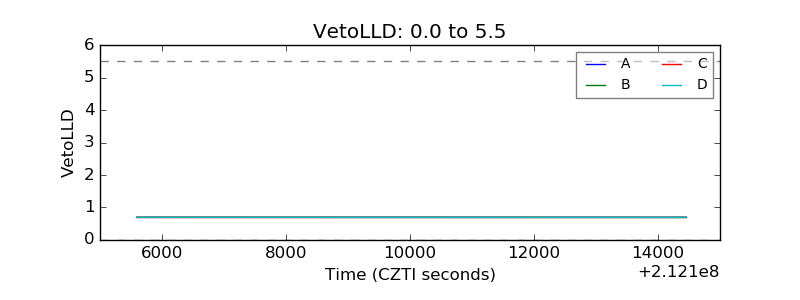 |
| Alpha Counter | 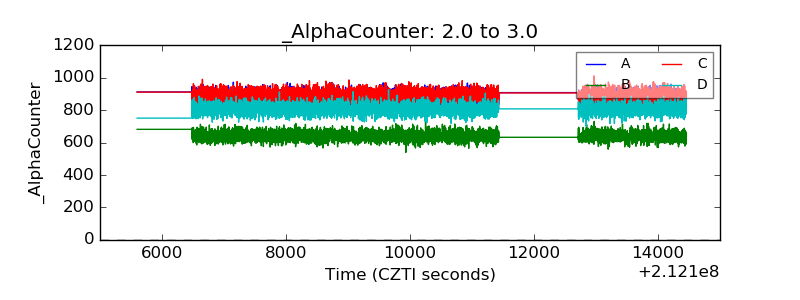 |
| _CPM_Rate | 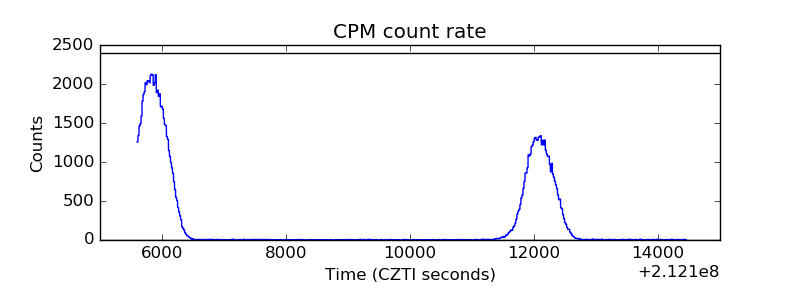 |
| CZT Counter | 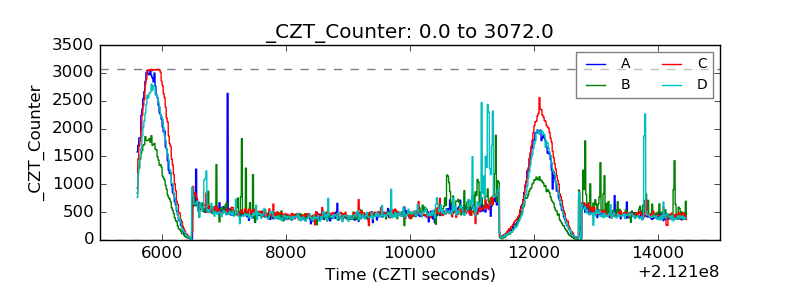 |
| +2.5 Volts monitor | 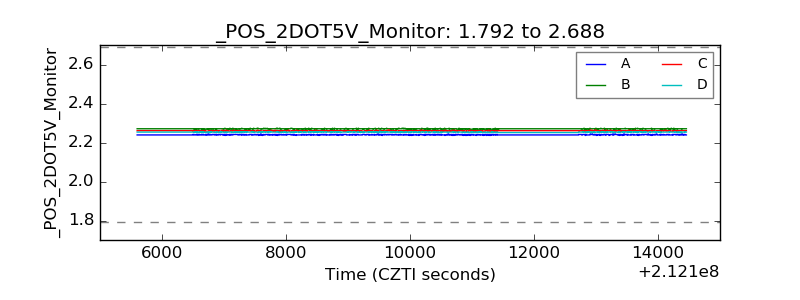 |
| +5 Volts monitor |  |
| _ROLL_ROT | 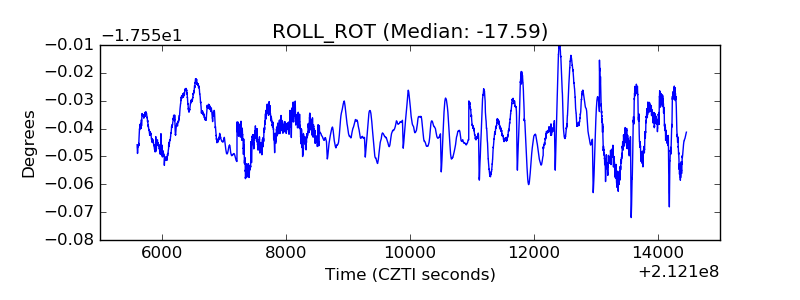 |
| _Roll_DEC | 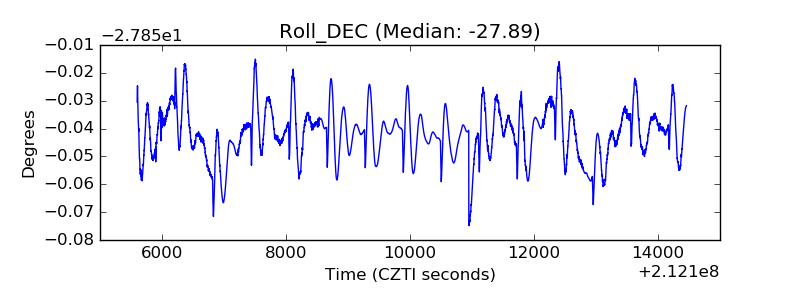 |
| _Roll_RA | 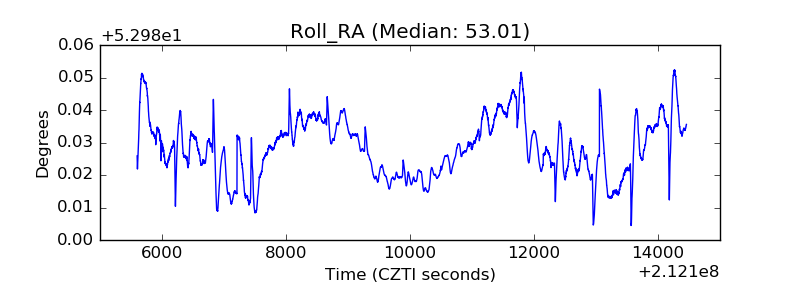 |
| Veto Counter | 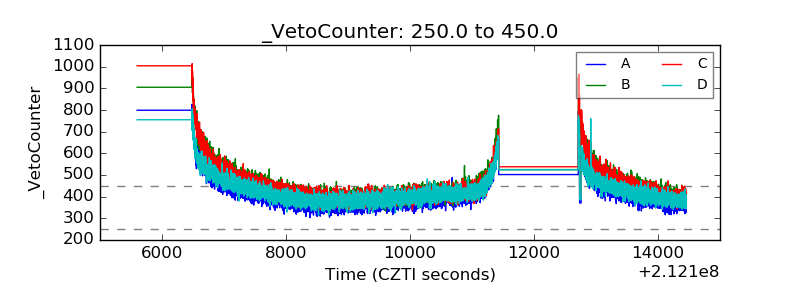 |