| Param | Original file | Final file |
|---|---|---|
| Filename | modeM0/AS1G05_240T01_9000000674_05313cztM0_level2.evt | modeM0/AS1G05_240T01_9000000674_05313cztM0_level2_quad_clean.evt |
| Size (bytes) | 458,729,280 | 81,659,520 |
| Size | 437.5 MB | 77.9 MB |
| Events in quadrant A | 3,111,126 | 505,666 |
| Events in quadrant B | 3,662,636 | 518,489 |
| Events in quadrant C | 3,228,474 | 504,312 |
| Events in quadrant D | 3,431,748 | 473,878 |
| Mode M0 | |||
|---|---|---|---|
| Quadrant | BADHDUFLAG | Total packets | Discarded packets |
| A | 0 | 13977 | 3 |
| B | 0 | 15282 | 2 |
| C | 0 | 14045 | 2 |
| D | 0 | 15022 | 2 |
| Mode SS | |||
|---|---|---|---|
| Quadrant | BADHDUFLAG | Total packets | Discarded packets |
| A | 0 | 136 | 0 |
| B | 0 | 136 | 0 |
| C | 0 | 136 | 0 |
| D | 0 | 136 | 0 |
| Mode M9 | |||
|---|---|---|---|
| Quadrant | BADHDUFLAG | Total packets | Discarded packets |
| A | 0 | 18 | 0 |
| B | 0 | 18 | 0 |
| C | 0 | 18 | 0 |
| D | 0 | 19 | 0 |
| Quadrant | Total seconds | Saturated seconds | Saturation percentage |
|---|---|---|---|
| A | 6751 | 42 | 0.622130% |
| B | 6751 | 115 | 1.703451% |
| C | 6751 | 43 | 0.636943% |
| D | 6751 | 103 | 1.525700% |
Noise dominated data is calculated using 1-second bins in cleaned event files. If a bin has >2000 counts, and if more than 50% of those come from <1% of pixels, then it is considered to be noise-dominated and hence unusable.
| Quadrant | # 1 sec bins | Bins with >0 counts | Bins with >2000 counts | High rate bins dominated by noise | Noise dominated (total time) | Noise dominated (detector-on time) | Marked lightcurve |
|---|---|---|---|---|---|---|---|
| A | 7931 | 6753 | 0 | 0 | 0.00% | 0.00% | 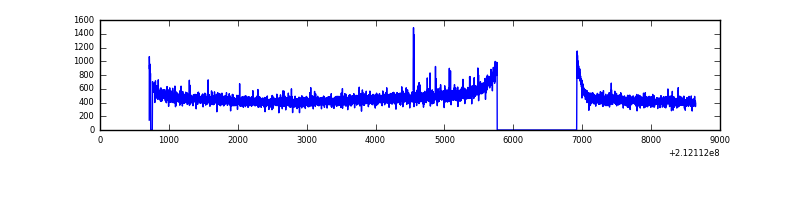 |
| B | 7931 | 6753 | 47 | 47 | 0.59% | 0.70% | 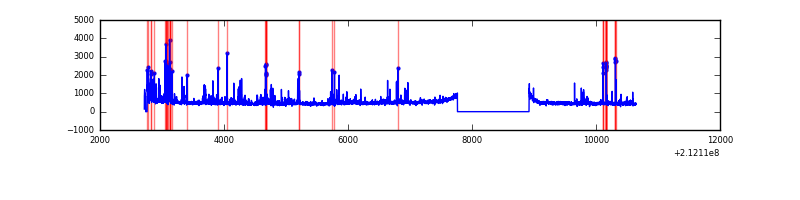 |
| C | 7931 | 6753 | 0 | 0 | 0.00% | 0.00% | 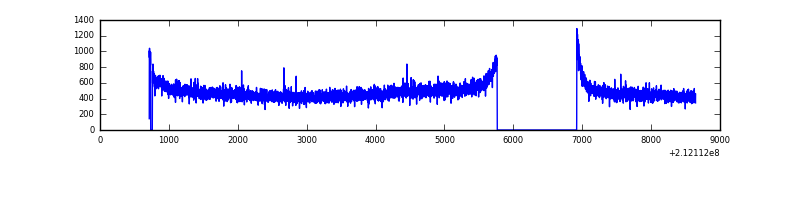 |
| D | 7931 | 6753 | 64 | 64 | 0.81% | 0.95% | 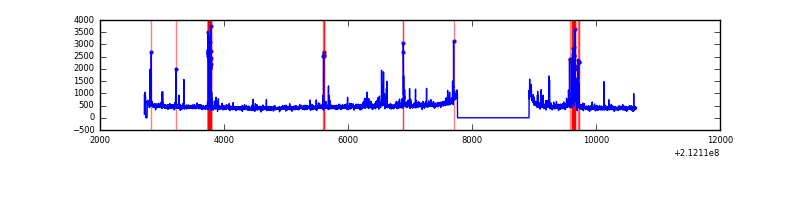 |
Top three noisy pixels from each quadrant. If the there are fewer than three noisy pixels in the level2.evt file, extra rows are filled as -1
| Pixel properties | Quadrant properties | ||||||
|---|---|---|---|---|---|---|---|
| Quadrant | DetID | PixID | Counts | Sigma | Mean | Median | Sigma |
| A | 0 | 50 | 11180 | 63.99 | 798 | 782 | 162.5 |
| A | 0 | 247 | 8969 | 50.38 | 798 | 782 | 162.5 |
| A | 0 | 226 | 8545 | 47.77 | 798 | 782 | 162.5 |
| B | 10 | 16 | 428877 | 2774.88 | 811 | 792 | 154.3 |
| B | 4 | 48 | 36707 | 232.8 | 811 | 792 | 154.3 |
| B | 15 | 54 | 22724 | 142.17 | 811 | 792 | 154.3 |
| C | 1 | 16 | 139656 | 756.75 | 791 | 795 | 183.5 |
| C | 13 | 61 | 6395 | 30.52 | 791 | 795 | 183.5 |
| C | 3 | 202 | 1931 | 6.19 | 791 | 795 | 183.5 |
| D | 2 | 14 | 252305 | 1321.13 | 777 | 753 | 190.4 |
| D | 2 | 136 | 107688 | 561.62 | 777 | 753 | 190.4 |
| D | 8 | 195 | 69616 | 361.66 | 777 | 753 | 190.4 |
Histogram calculated using DETX and DETY for each event in the final _common_clean file
| Quadrant A | 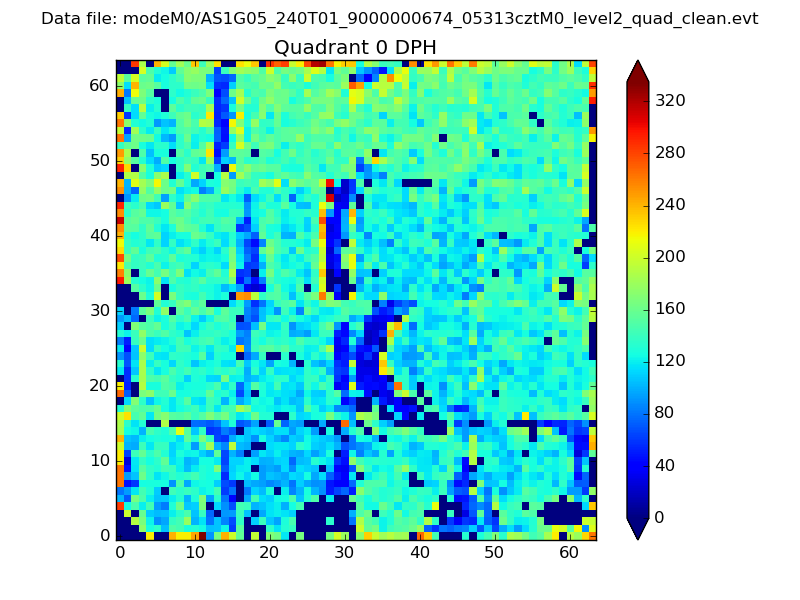 |
 |
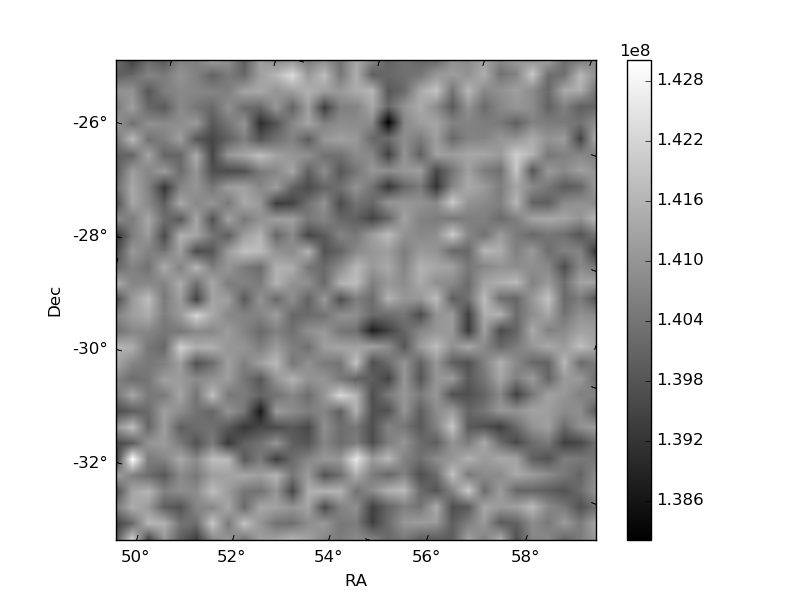
Quadrant B |
|---|---|---|---|
| Quadrant D | 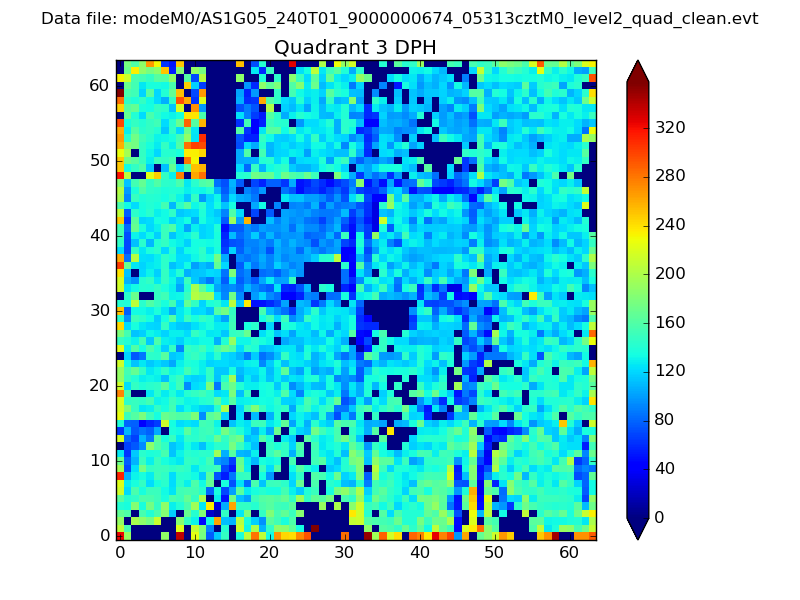 |
 |
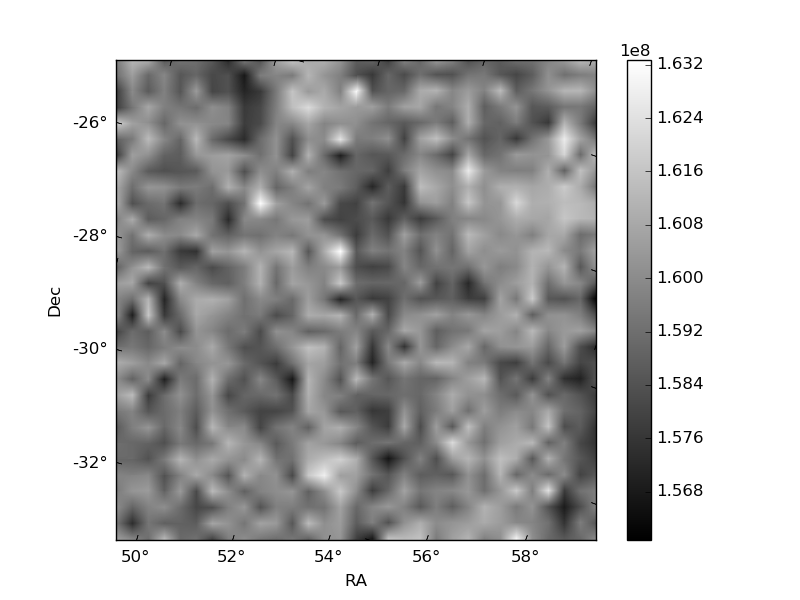
Quadrant C |
| Plot type | Count rate plots | Images |
|---|---|---|
| Comparison with Poisson distribution Blue bars denote a histogram of data divided into 1 sec bins. Red curve is a Poisson curve with rate = median count rate of data. |
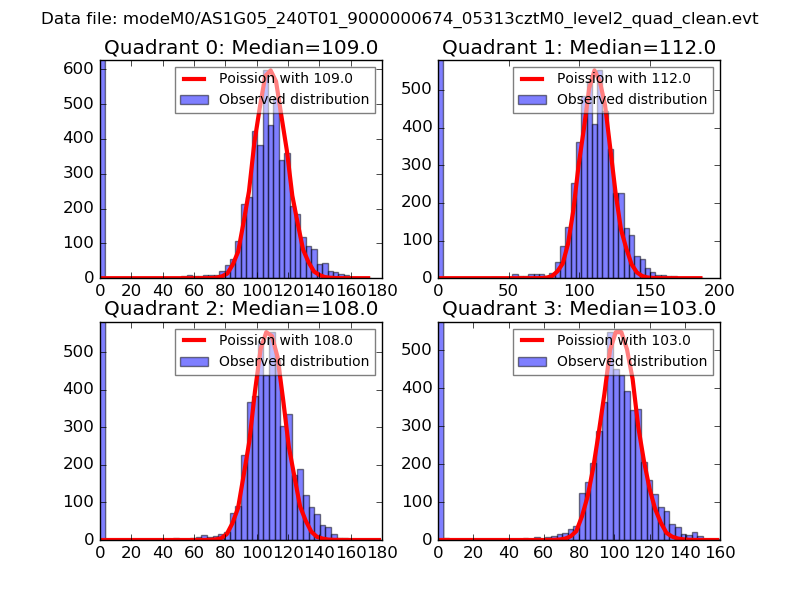 |
 |
| Quadrant-wise count rates Data is divided into 100 sec bins |
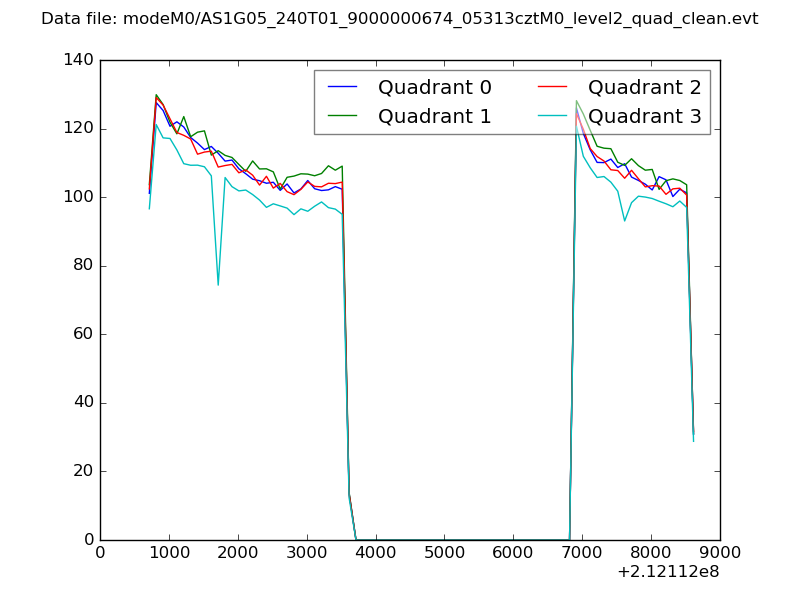 |
|
| Module-wise count rates for Quadrant A Data is divided into 100 sec bins |
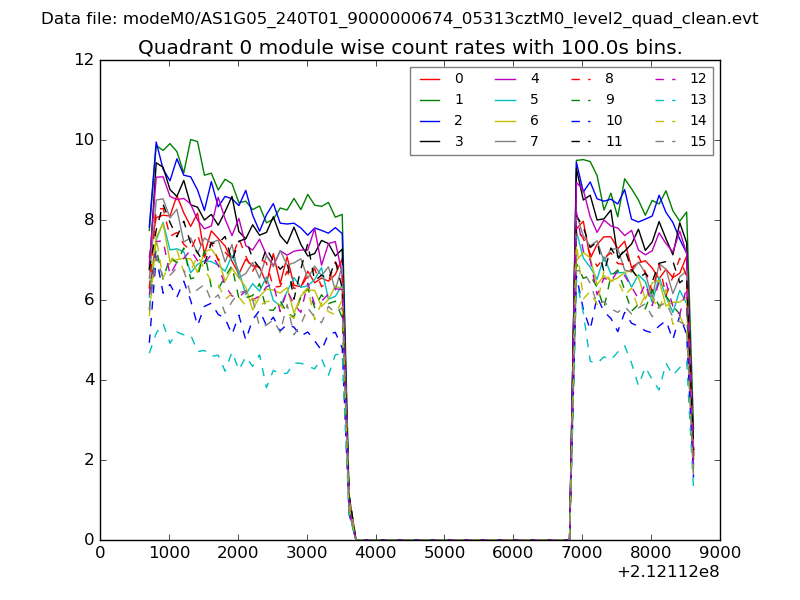 |
 |
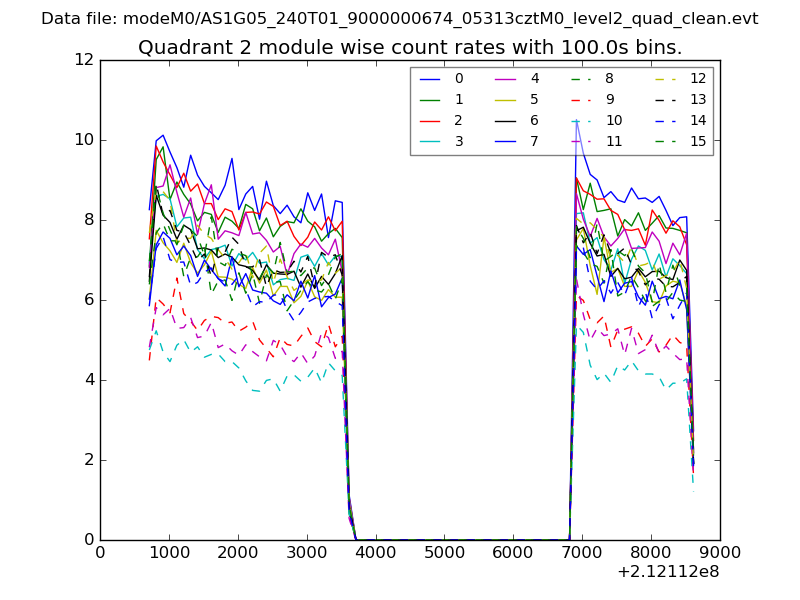
| Module-wise count rates for Quadrant B Data is divided into 100 sec bins |
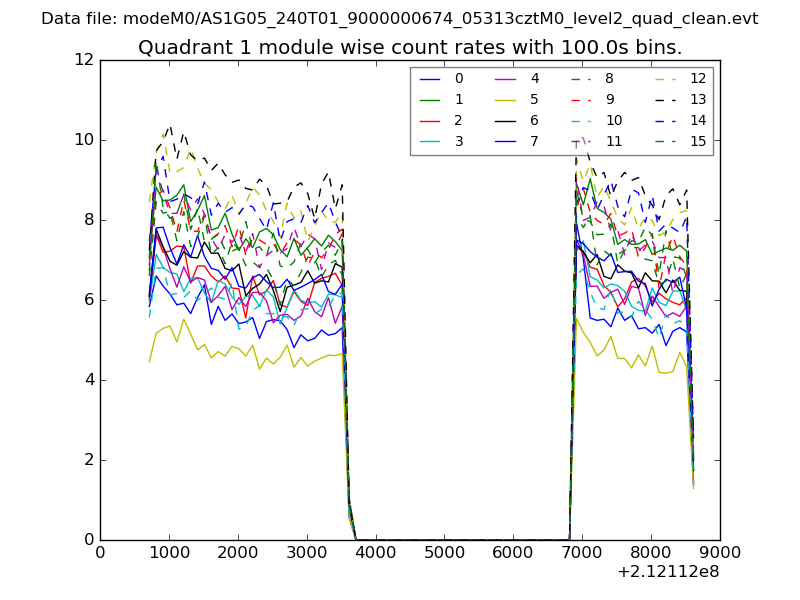 |
 |
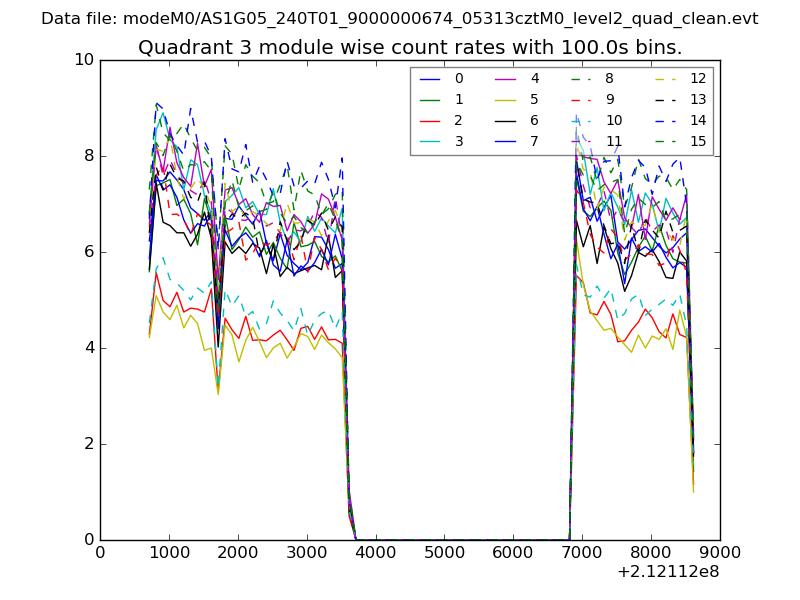
| Module-wise count rates for Quadrant C Data is divided into 100 sec bins |
 |
 |
| Module-wise count rates for Quadrant D Data is divided into 100 sec bins |
 |
 |
| Parameter | Plot |
|---|---|
| CZT HV Monitor | 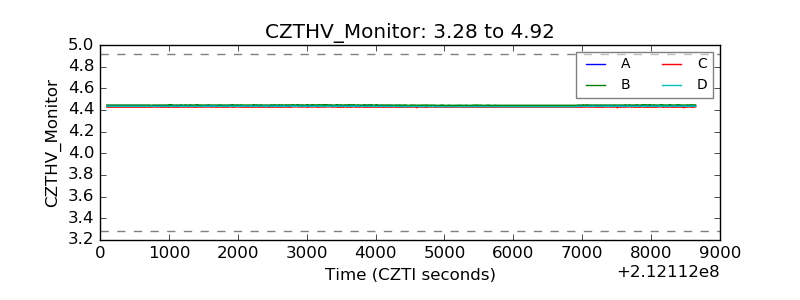 |
| D_VDD | 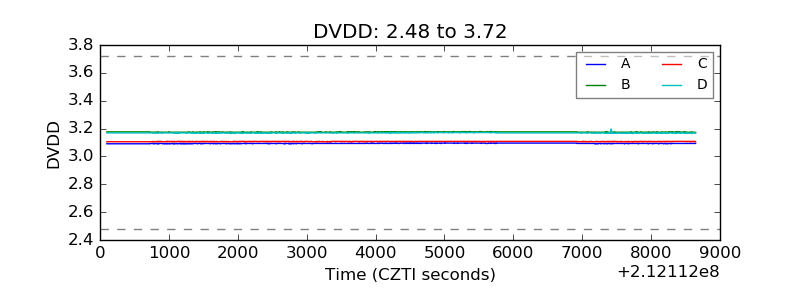 |
| Temperature 1 | 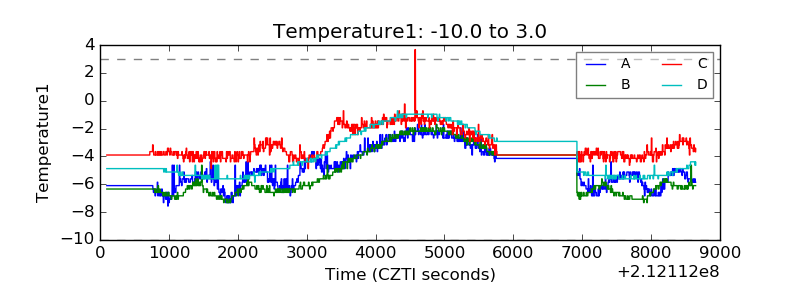 |
| Veto HV Monitor | 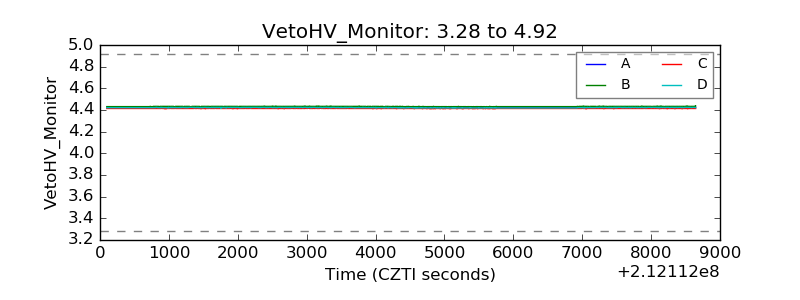 |
| Veto LLD | 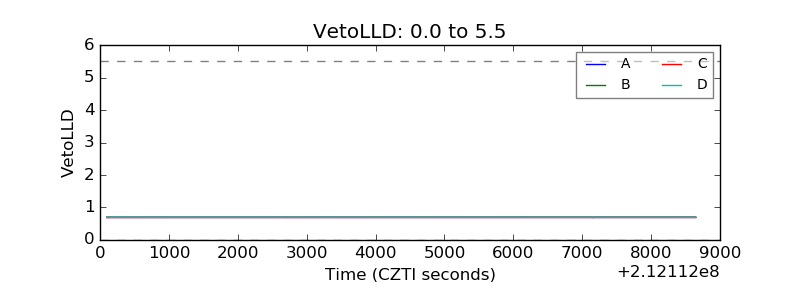 |
| Alpha Counter | 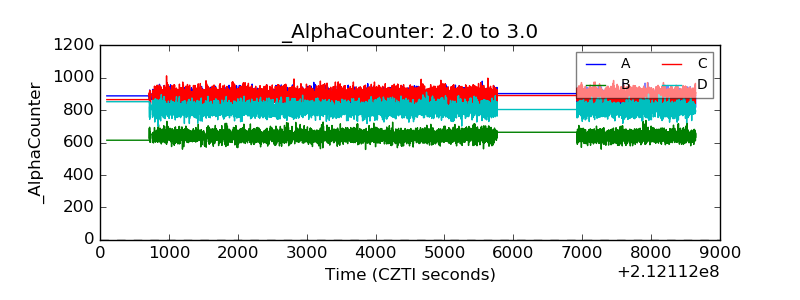 |
| _CPM_Rate | 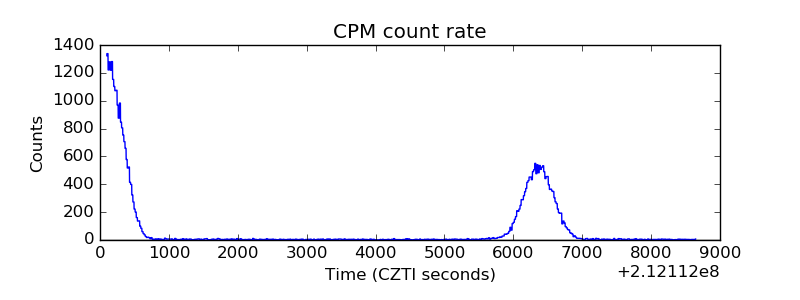 |
| CZT Counter | 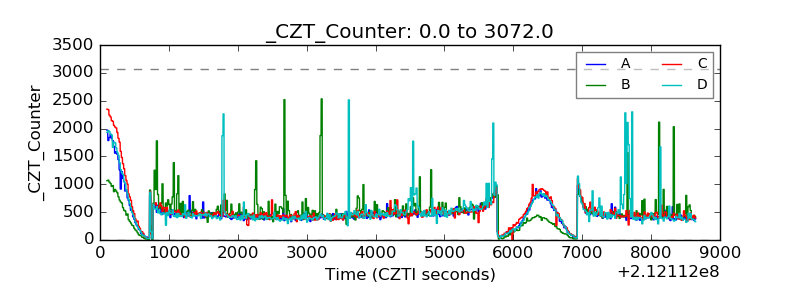 |
| +2.5 Volts monitor |  |
| +5 Volts monitor |  |
| _ROLL_ROT | 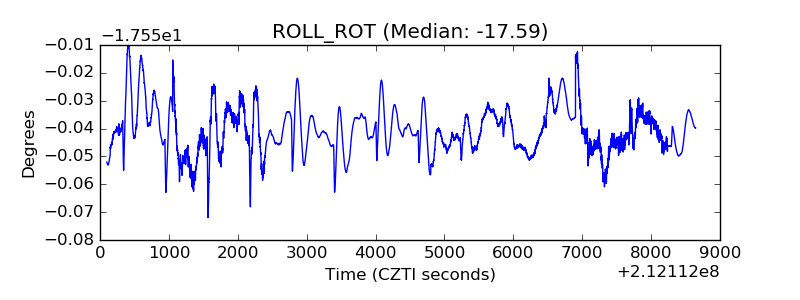 |
| _Roll_DEC | 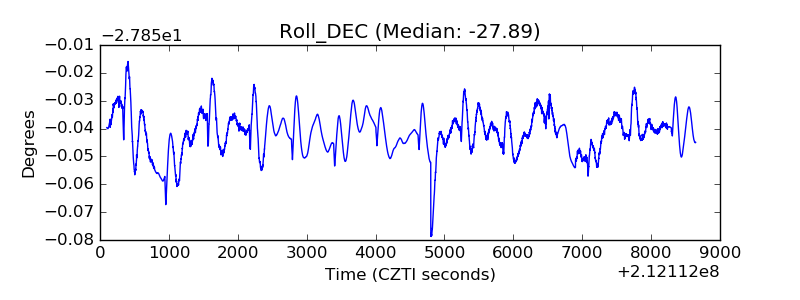 |
| _Roll_RA | 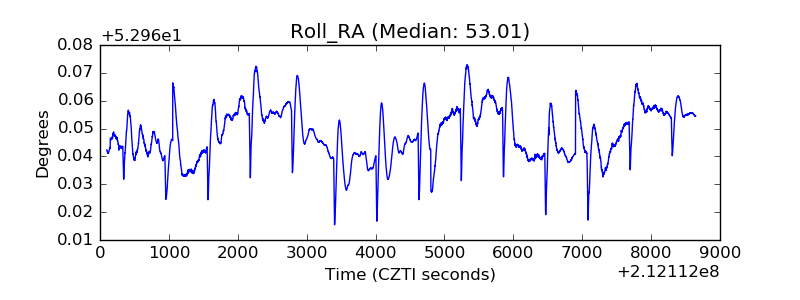 |
| Veto Counter | 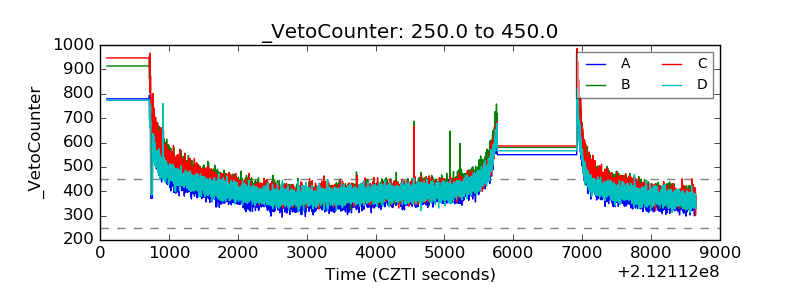 |