| Param | Original file | Final file |
|---|---|---|
| Filename | modeM0/AS1G05_240T01_9000000674_05315cztM0_level2.evt | modeM0/AS1G05_240T01_9000000674_05315cztM0_level2_quad_clean.evt |
| Size (bytes) | 509,411,520 | 94,011,840 |
| Size | 485.8 MB | 89.7 MB |
| Events in quadrant A | 3,559,462 | 584,208 |
| Events in quadrant B | 3,906,975 | 593,470 |
| Events in quadrant C | 3,551,111 | 578,286 |
| Events in quadrant D | 3,884,205 | 552,776 |
| Mode M0 | |||
|---|---|---|---|
| Quadrant | BADHDUFLAG | Total packets | Discarded packets |
| A | 0 | 16020 | 3 |
| B | 0 | 16831 | 2 |
| C | 0 | 15994 | 2 |
| D | 0 | 17140 | 2 |
| Mode SS | |||
|---|---|---|---|
| Quadrant | BADHDUFLAG | Total packets | Discarded packets |
| A | 0 | 160 | 0 |
| B | 0 | 160 | 0 |
| C | 0 | 160 | 0 |
| D | 0 | 160 | 0 |
| Mode M9 | |||
|---|---|---|---|
| Quadrant | BADHDUFLAG | Total packets | Discarded packets |
| A | 0 | 13 | 0 |
| B | 0 | 13 | 0 |
| C | 0 | 13 | 0 |
| D | 0 | 13 | 0 |
| Quadrant | Total seconds | Saturated seconds | Saturation percentage |
|---|---|---|---|
| A | 7731 | 123 | 1.590997% |
| B | 7731 | 167 | 2.160135% |
| C | 7731 | 113 | 1.461648% |
| D | 7731 | 165 | 2.134265% |
Noise dominated data is calculated using 1-second bins in cleaned event files. If a bin has >2000 counts, and if more than 50% of those come from <1% of pixels, then it is considered to be noise-dominated and hence unusable.
| Quadrant | # 1 sec bins | Bins with >0 counts | Bins with >2000 counts | High rate bins dominated by noise | Noise dominated (total time) | Noise dominated (detector-on time) | Marked lightcurve |
|---|---|---|---|---|---|---|---|
| A | 9021 | 7732 | 0 | 0 | 0.00% | 0.00% | 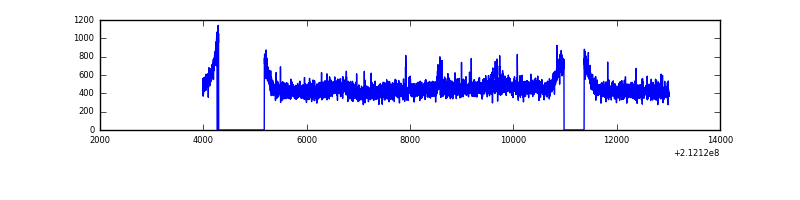 |
| B | 9021 | 7734 | 36 | 36 | 0.40% | 0.47% | 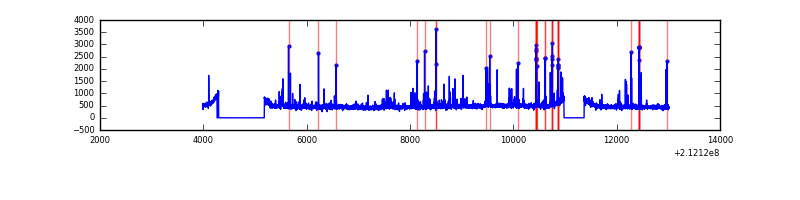 |
| C | 9021 | 7734 | 0 | 0 | 0.00% | 0.00% |  |
| D | 9021 | 7734 | 42 | 42 | 0.47% | 0.54% | 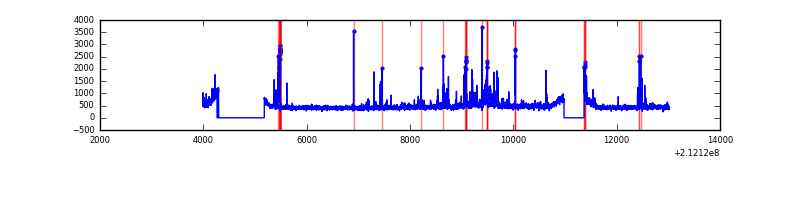 |
Top three noisy pixels from each quadrant. If the there are fewer than three noisy pixels in the level2.evt file, extra rows are filled as -1
| Pixel properties | Quadrant properties | ||||||
|---|---|---|---|---|---|---|---|
| Quadrant | DetID | PixID | Counts | Sigma | Mean | Median | Sigma |
| A | 13 | 251 | 51335 | 273.03 | 902 | 881 | 184.8 |
| A | 15 | 236 | 28046 | 147.0 | 902 | 881 | 184.8 |
| A | 12 | 194 | 8855 | 43.15 | 902 | 881 | 184.8 |
| B | 10 | 16 | 296946 | 1679.89 | 912 | 887 | 176.2 |
| B | 4 | 48 | 29482 | 162.25 | 912 | 887 | 176.2 |
| B | 4 | 80 | 21712 | 118.16 | 912 | 887 | 176.2 |
| C | 1 | 16 | 72159 | 344.26 | 891 | 895 | 207.0 |
| C | 13 | 61 | 7131 | 30.12 | 891 | 895 | 207.0 |
| C | 12 | 4 | 3147 | 10.88 | 891 | 895 | 207.0 |
| D | 2 | 234 | 250169 | 1145.32 | 883 | 854 | 217.7 |
| D | 2 | 14 | 119571 | 545.37 | 883 | 854 | 217.7 |
| D | 8 | 195 | 57175 | 258.73 | 883 | 854 | 217.7 |
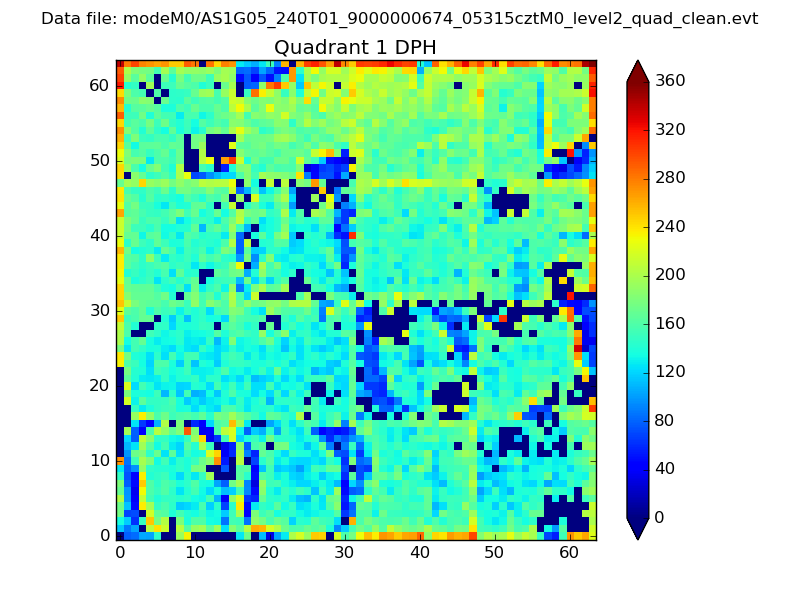
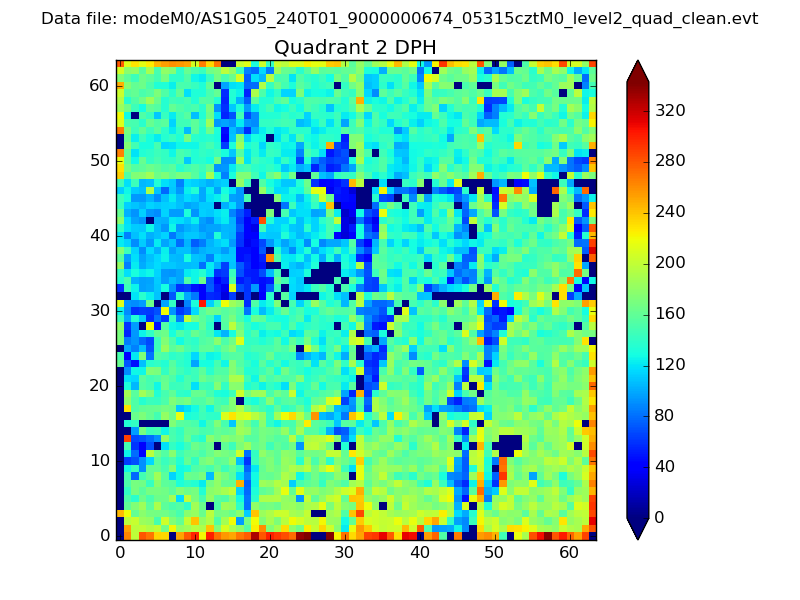
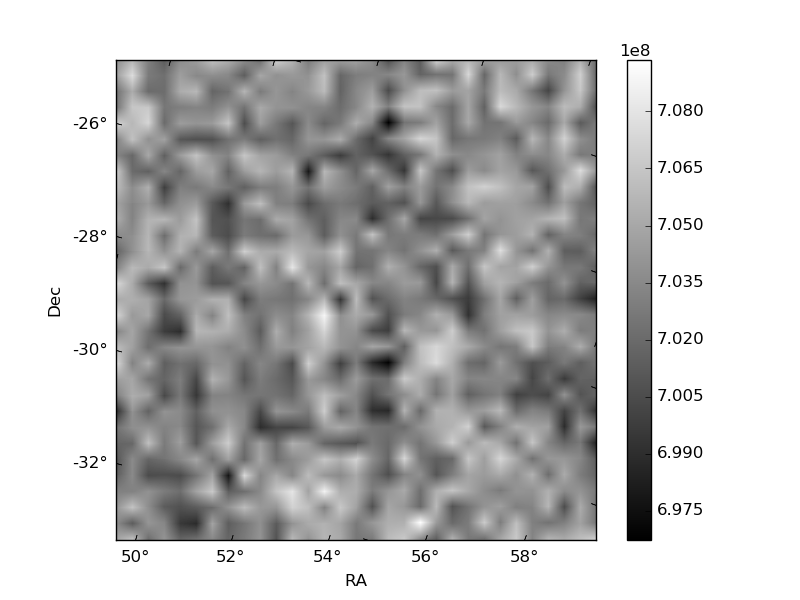
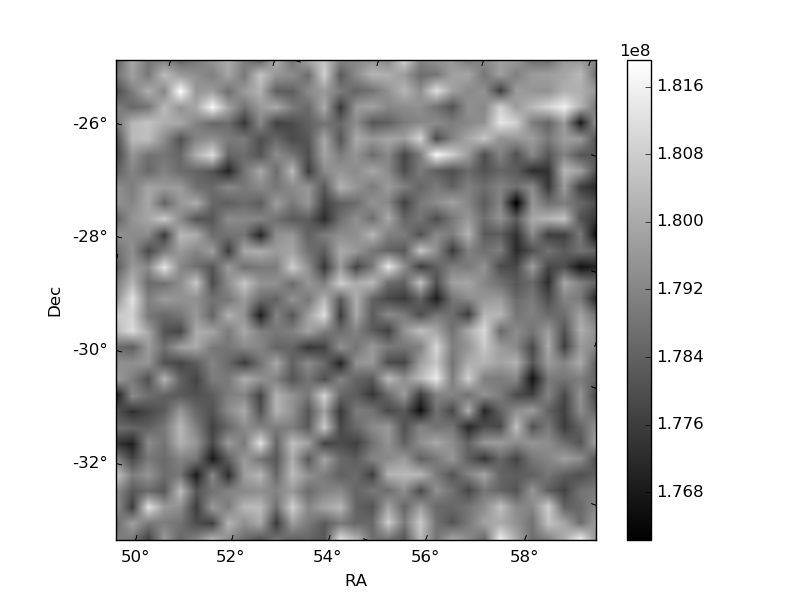
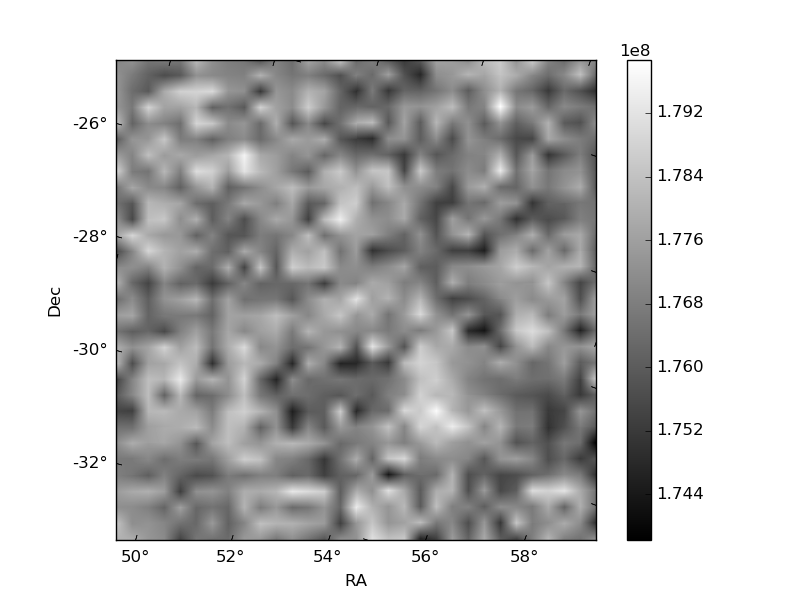
Histogram calculated using DETX and DETY for each event in the final _common_clean file
| Quadrant A | 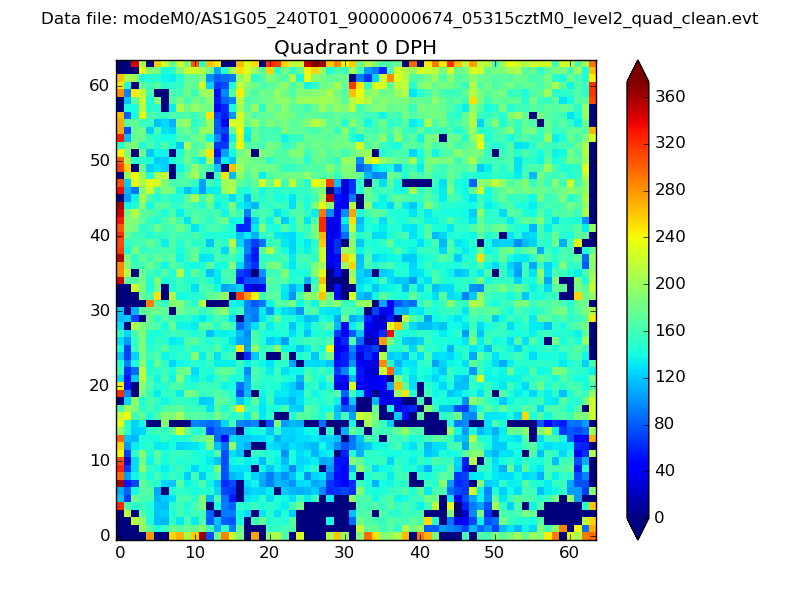 |
 |
Quadrant B |
|---|---|---|---|
| Quadrant D | 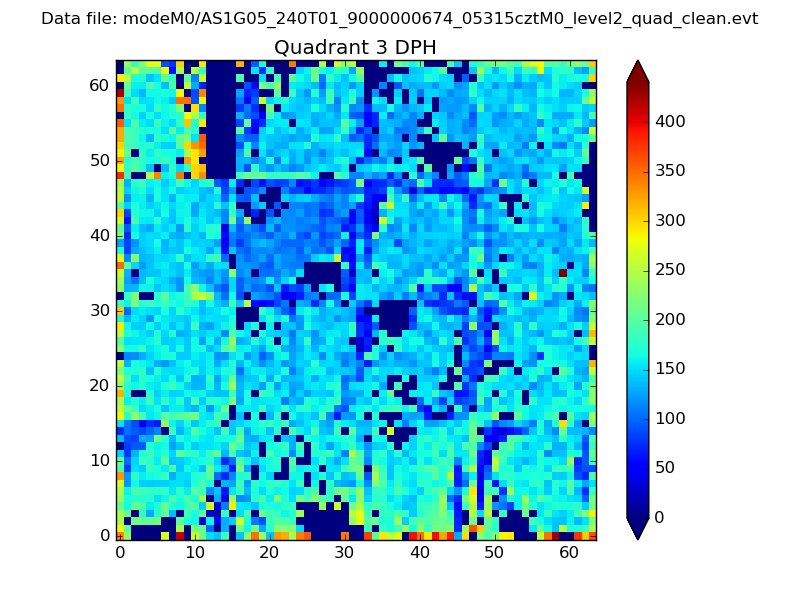 |
 |
Quadrant C |
| Plot type | Count rate plots | Images |
|---|---|---|
| Comparison with Poisson distribution Blue bars denote a histogram of data divided into 1 sec bins. Red curve is a Poisson curve with rate = median count rate of data. |
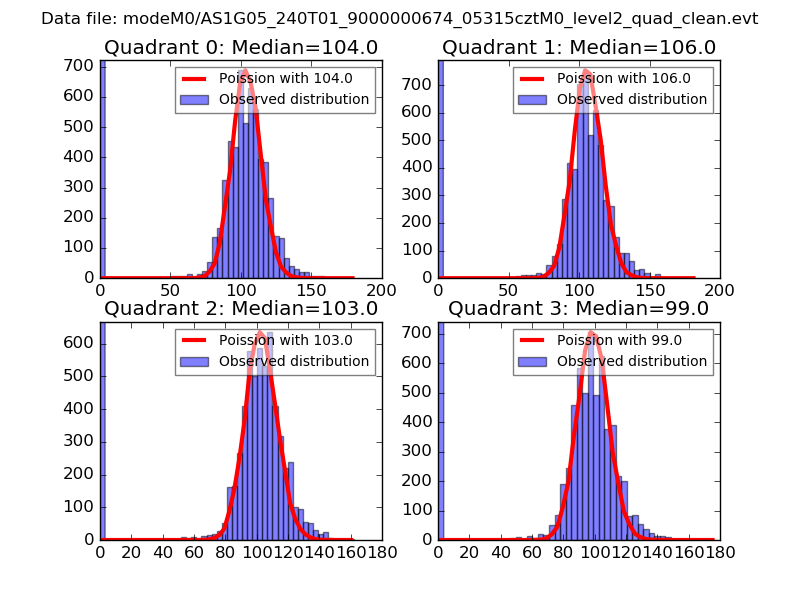 |
 |
| Quadrant-wise count rates Data is divided into 100 sec bins |
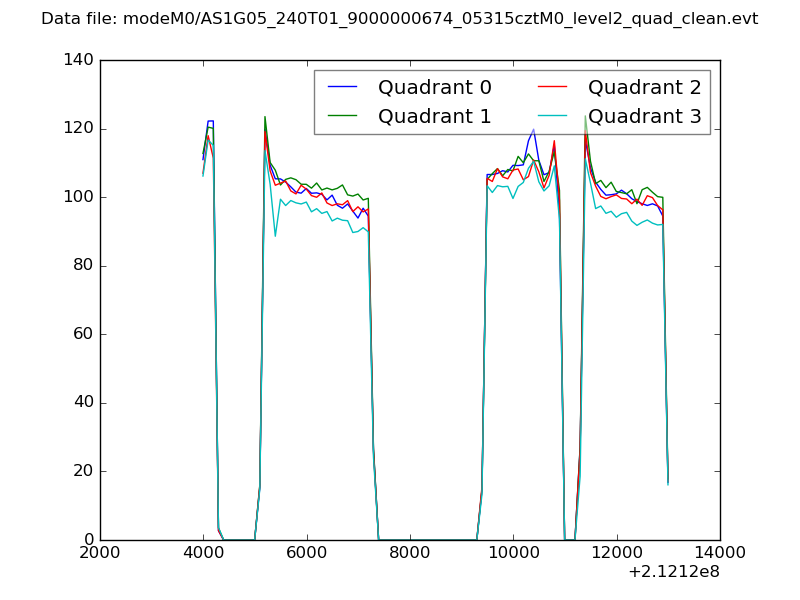 |
|
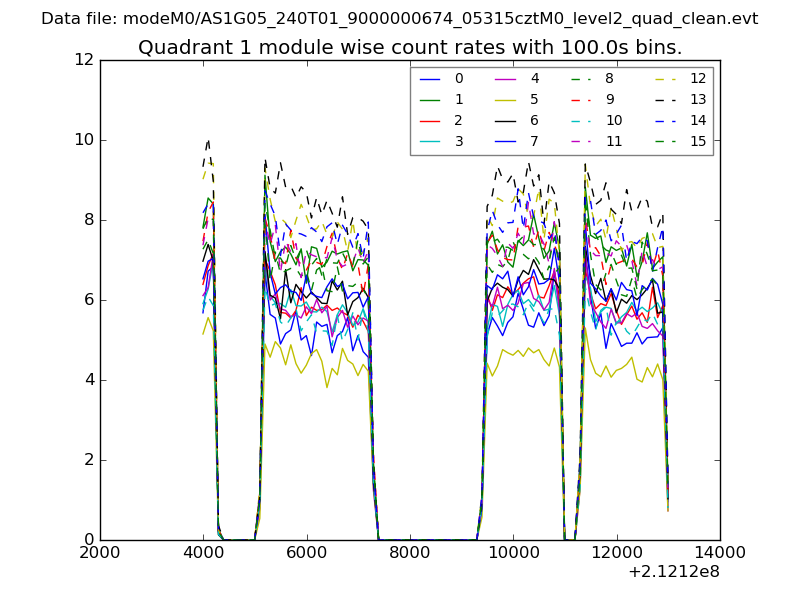
| Module-wise count rates for Quadrant A Data is divided into 100 sec bins |
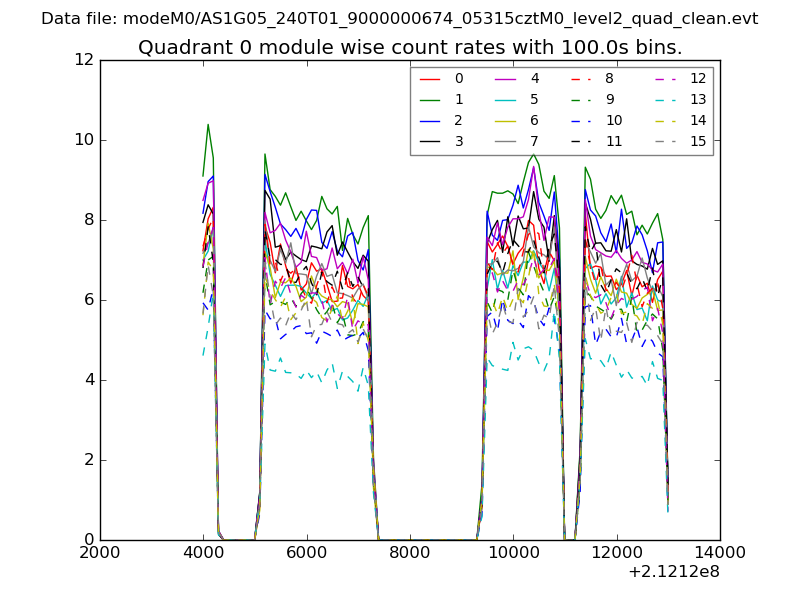 |
 |
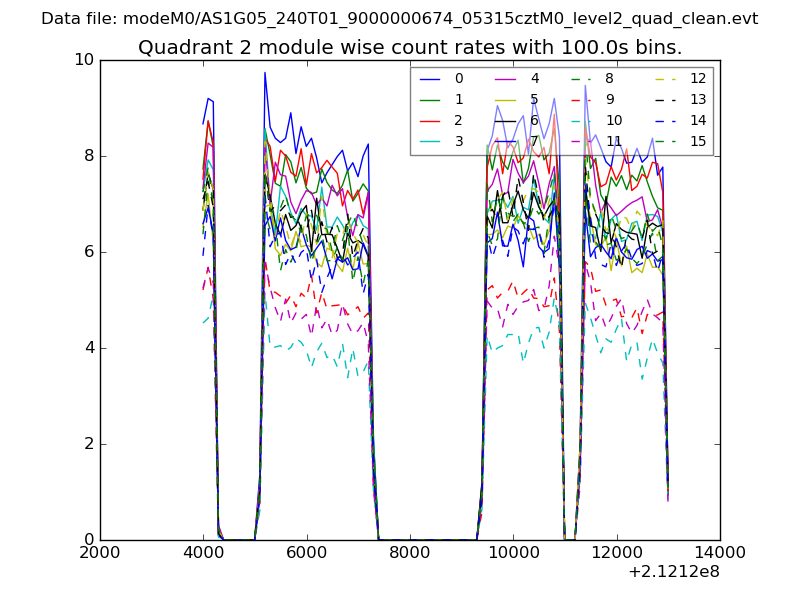
| Module-wise count rates for Quadrant B Data is divided into 100 sec bins |
 |
 |
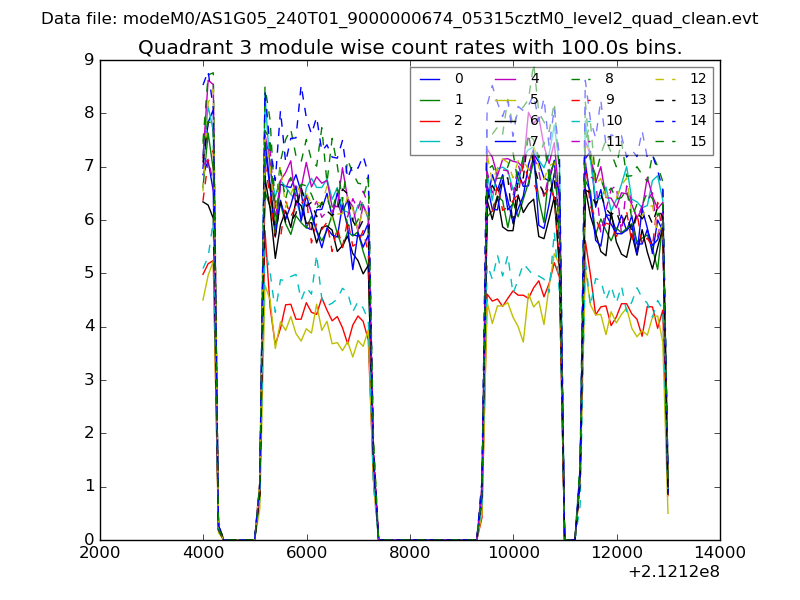
| Module-wise count rates for Quadrant C Data is divided into 100 sec bins |
 |
 |
| Module-wise count rates for Quadrant D Data is divided into 100 sec bins |
 |
 |
| Parameter | Plot |
|---|---|
| CZT HV Monitor | 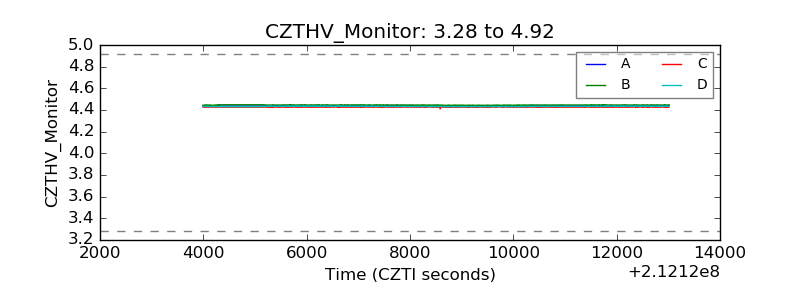 |
| D_VDD | 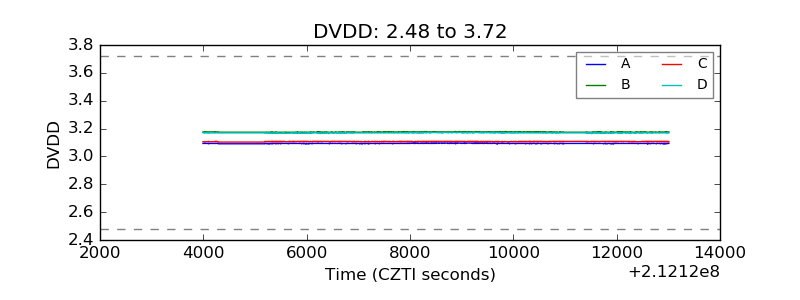 |
| Temperature 1 | 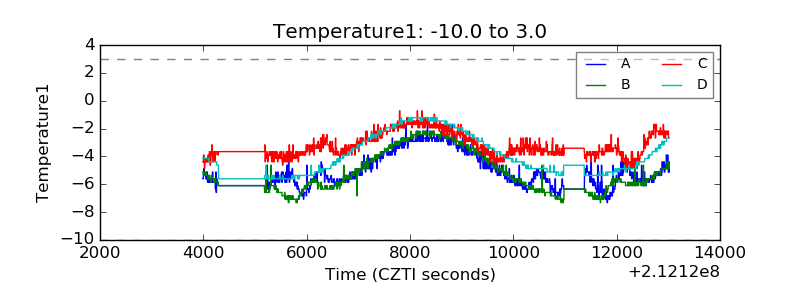 |
| Veto HV Monitor | 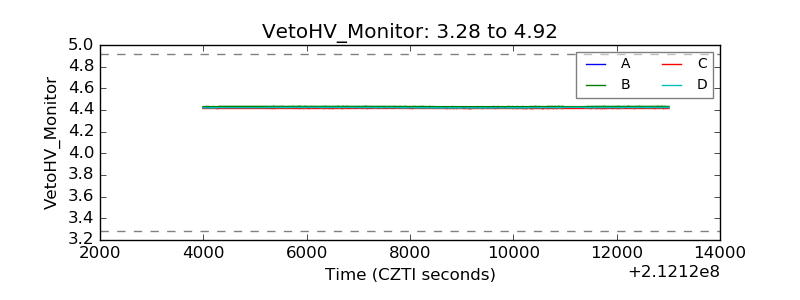 |
| Veto LLD | 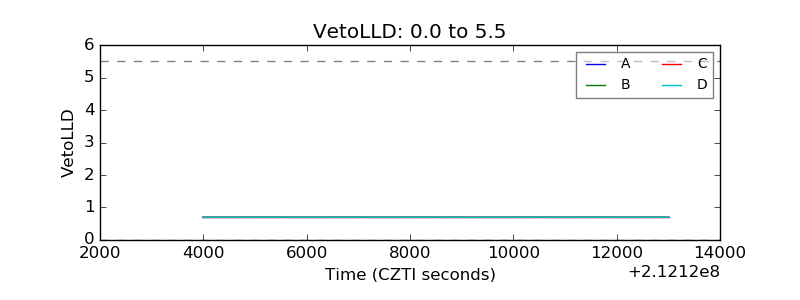 |
| Alpha Counter | 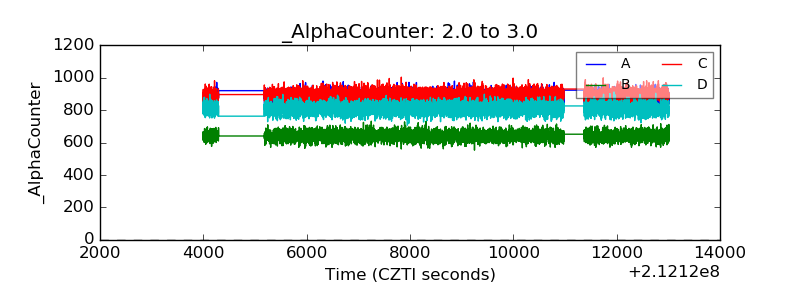 |
| _CPM_Rate | 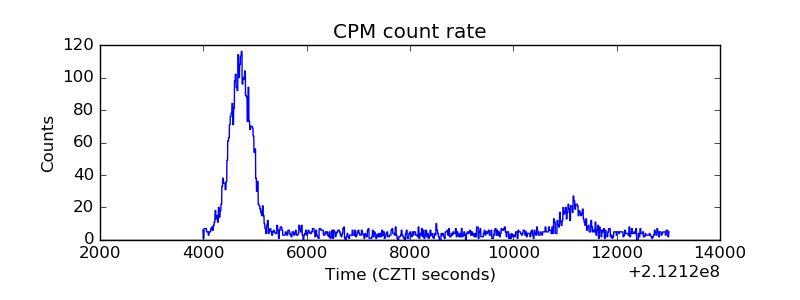 |
| CZT Counter | 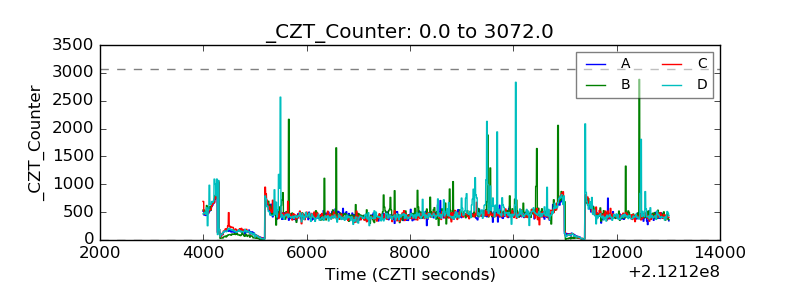 |
| +2.5 Volts monitor |  |
| +5 Volts monitor |  |
| _ROLL_ROT | 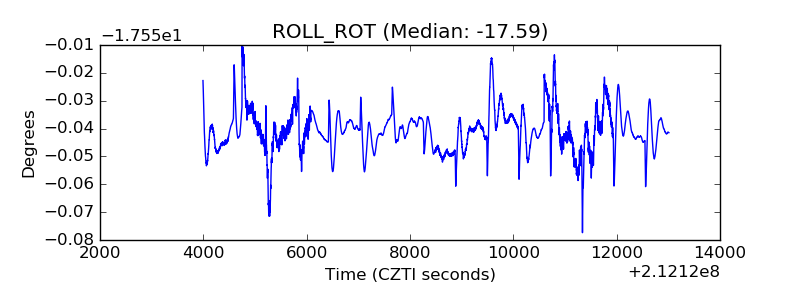 |
| _Roll_DEC | 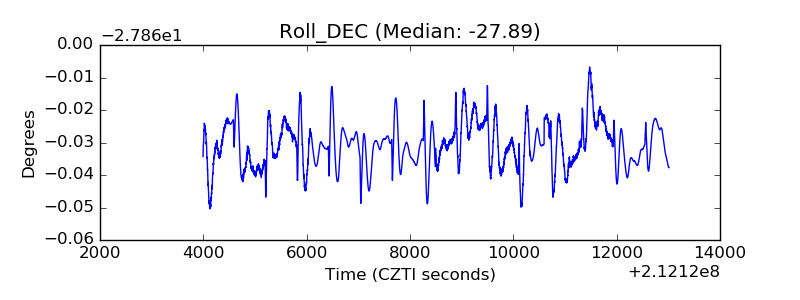 |
| _Roll_RA | 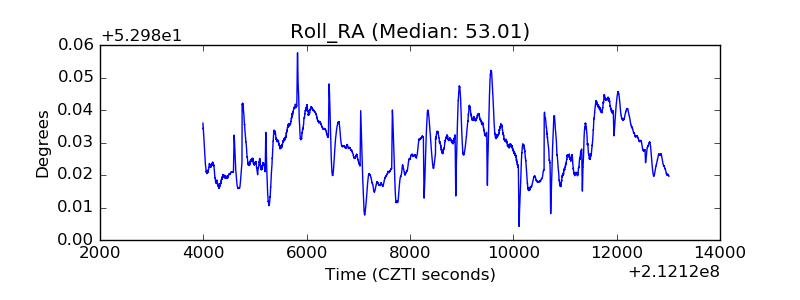 |
| Veto Counter | 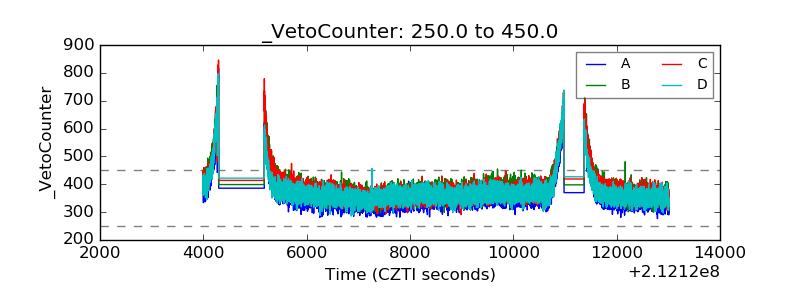 |