| Param | Original file | Final file |
|---|---|---|
| Filename | modeM0/AS1G05_240T01_9000000674_05316cztM0_level2.evt | modeM0/AS1G05_240T01_9000000674_05316cztM0_level2_quad_clean.evt |
| Size (bytes) | 503,887,680 | 91,131,840 |
| Size | 480.5 MB | 86.9 MB |
| Events in quadrant A | 3,575,232 | 559,799 |
| Events in quadrant B | 3,888,897 | 572,140 |
| Events in quadrant C | 3,497,370 | 558,776 |
| Events in quadrant D | 3,773,322 | 531,194 |
| Mode M0 | |||
|---|---|---|---|
| Quadrant | BADHDUFLAG | Total packets | Discarded packets |
| A | 0 | 16149 | 14 |
| B | 0 | 16793 | 11 |
| C | 0 | 15976 | 14 |
| D | 0 | 16643 | 6 |
| Mode SS | |||
|---|---|---|---|
| Quadrant | BADHDUFLAG | Total packets | Discarded packets |
| A | 0 | 154 | 0 |
| B | 0 | 154 | 0 |
| C | 0 | 154 | 0 |
| D | 0 | 154 | 0 |
| Quadrant | Total seconds | Saturated seconds | Saturation percentage |
|---|---|---|---|
| A | 7730 | 167 | 2.160414% |
| B | 7731 | 182 | 2.354159% |
| C | 7730 | 76 | 0.983182% |
| D | 7733 | 140 | 1.810423% |
Noise dominated data is calculated using 1-second bins in cleaned event files. If a bin has >2000 counts, and if more than 50% of those come from <1% of pixels, then it is considered to be noise-dominated and hence unusable.
| Quadrant | # 1 sec bins | Bins with >0 counts | Bins with >2000 counts | High rate bins dominated by noise | Noise dominated (total time) | Noise dominated (detector-on time) | Marked lightcurve |
|---|---|---|---|---|---|---|---|
| A | 7736 | 7736 | 0 | 0 | 0.00% | 0.00% | 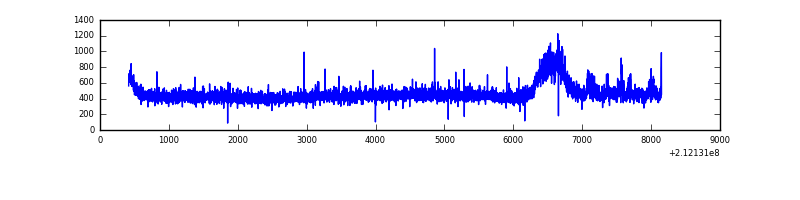 |
| B | 7736 | 7736 | 31 | 31 | 0.40% | 0.40% | 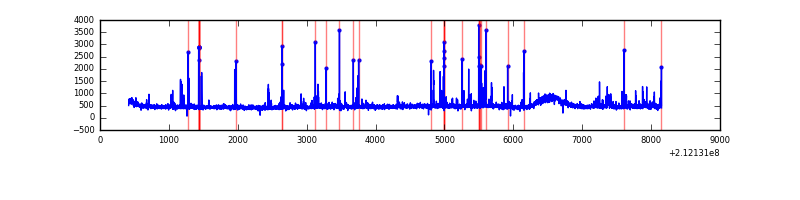 |
| C | 7736 | 7736 | 0 | 0 | 0.00% | 0.00% | 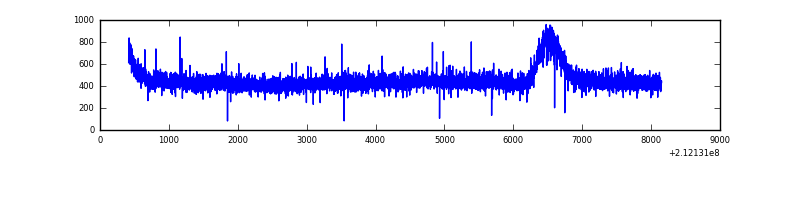 |
| D | 7736 | 7736 | 16 | 16 | 0.21% | 0.21% | 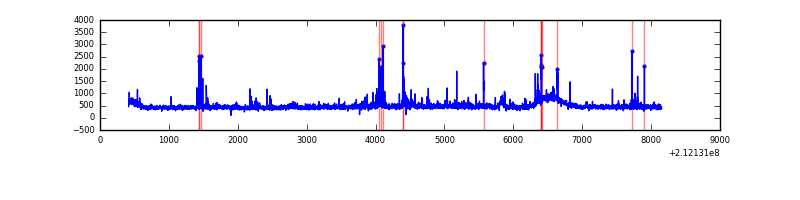 |
Top three noisy pixels from each quadrant. If the there are fewer than three noisy pixels in the level2.evt file, extra rows are filled as -1
| Pixel properties | Quadrant properties | ||||||
|---|---|---|---|---|---|---|---|
| Quadrant | DetID | PixID | Counts | Sigma | Mean | Median | Sigma |
| A | 0 | 247 | 93676 | 498.43 | 899 | 877 | 186.2 |
| A | 0 | 226 | 16940 | 86.28 | 899 | 877 | 186.2 |
| A | 12 | 194 | 8803 | 42.57 | 899 | 877 | 186.2 |
| B | 10 | 16 | 234442 | 1305.36 | 912 | 888 | 178.9 |
| B | 4 | 80 | 62593 | 344.88 | 912 | 888 | 178.9 |
| B | 4 | 48 | 36832 | 200.89 | 912 | 888 | 178.9 |
| C | 1 | 16 | 36707 | 173.45 | 886 | 888 | 206.5 |
| C | 13 | 61 | 7349 | 31.29 | 886 | 888 | 206.5 |
| C | 12 | 4 | 2891 | 9.7 | 886 | 888 | 206.5 |
| D | 2 | 234 | 222710 | 1024.14 | 880 | 852 | 216.6 |
| D | 8 | 195 | 69713 | 317.88 | 880 | 852 | 216.6 |
| D | 2 | 14 | 48280 | 218.94 | 880 | 852 | 216.6 |
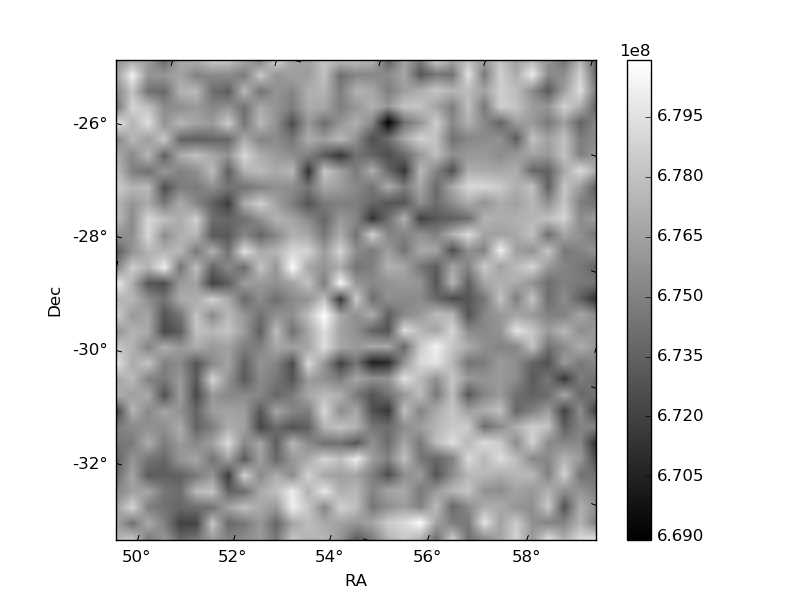
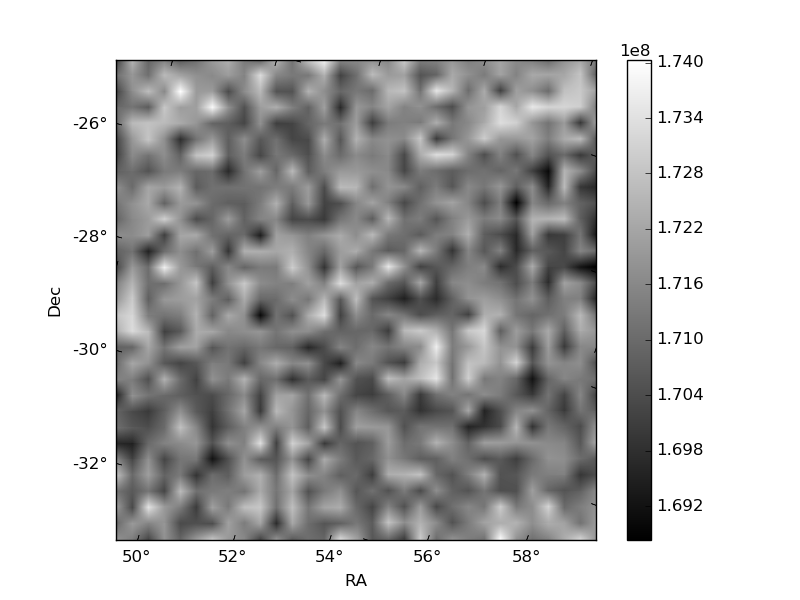
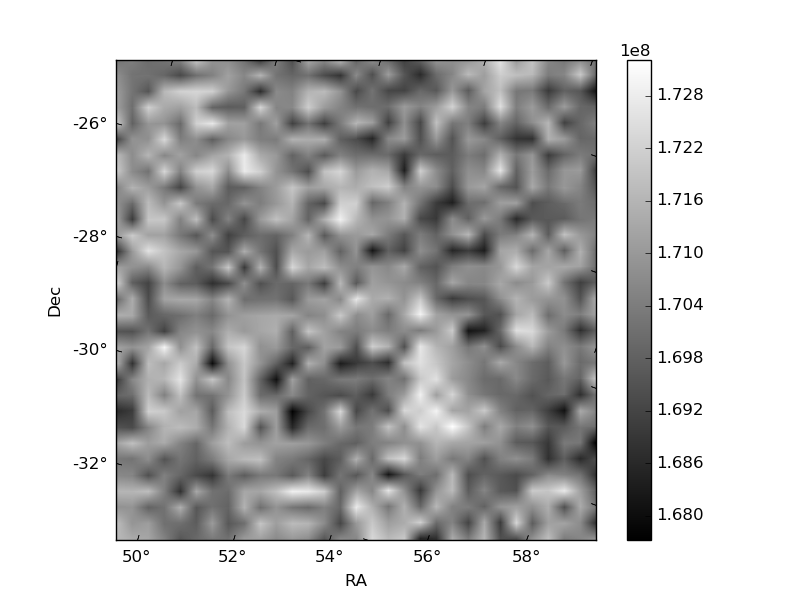
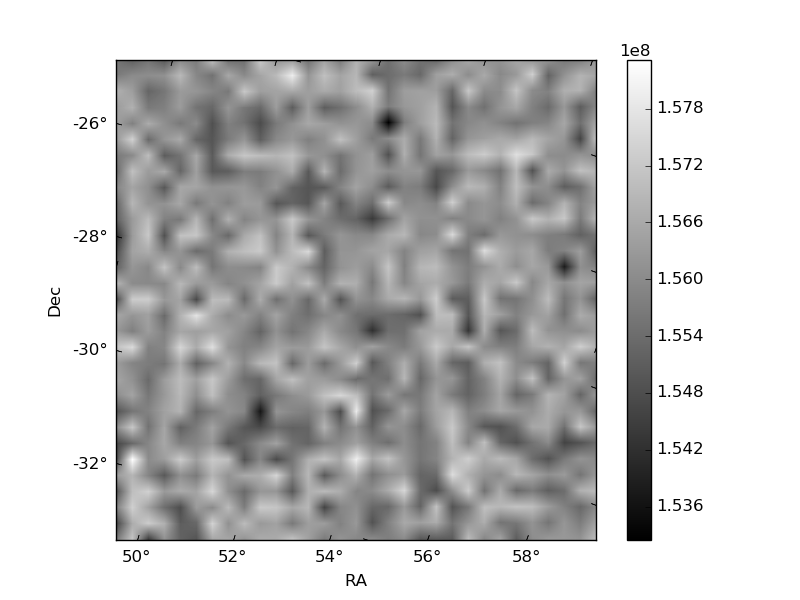
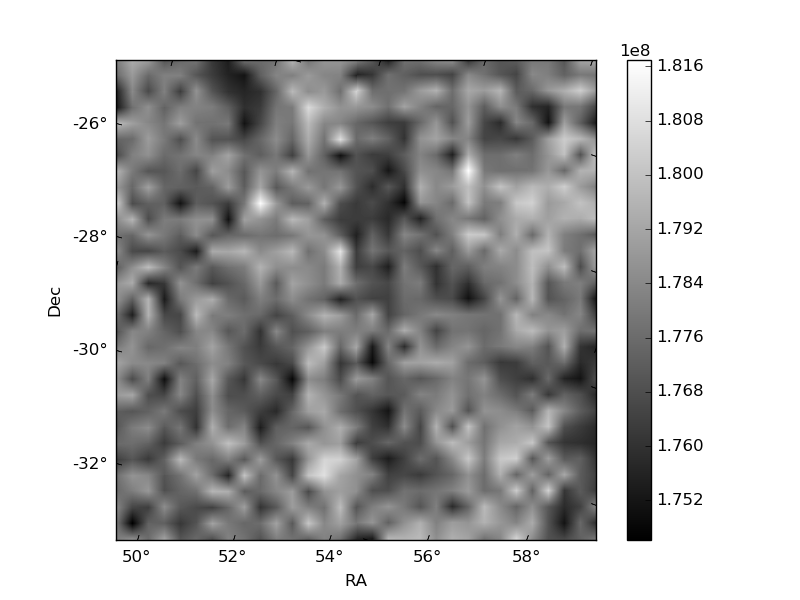
Histogram calculated using DETX and DETY for each event in the final _common_clean file
| Quadrant A | 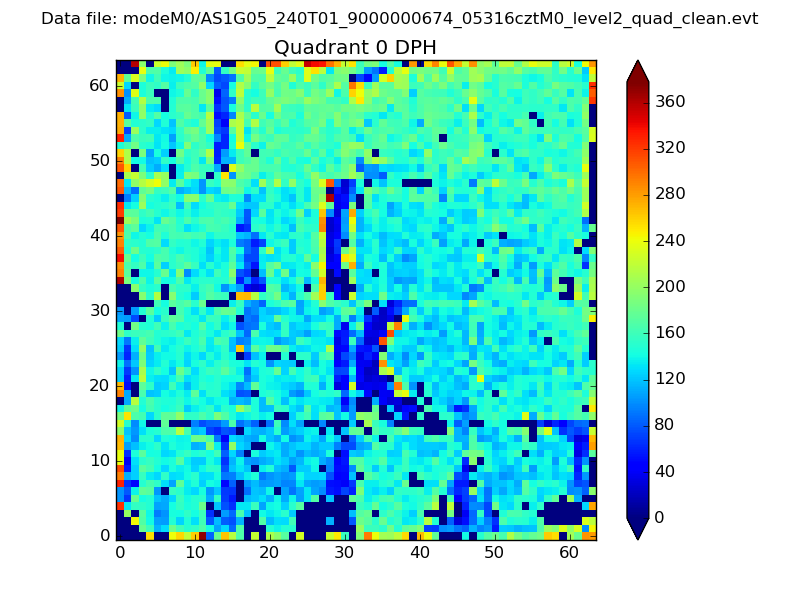 |
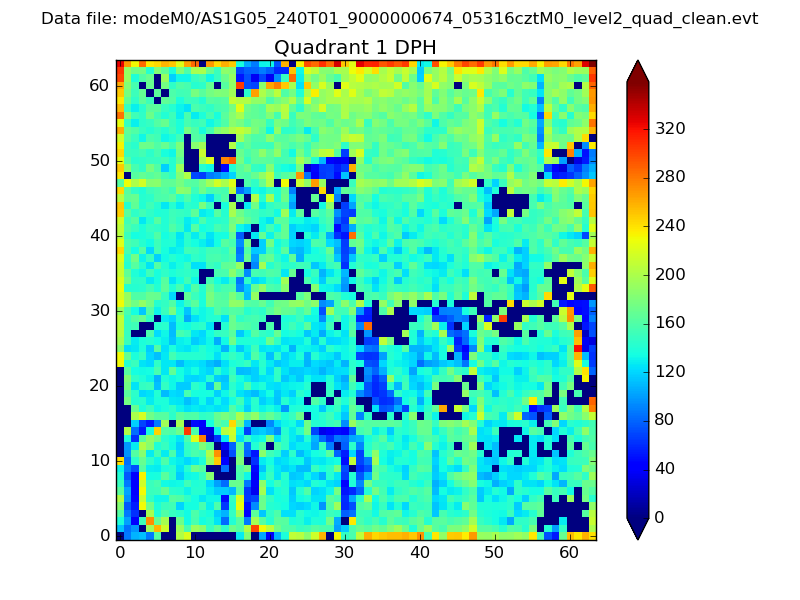 |
Quadrant B |
|---|---|---|---|
| Quadrant D | 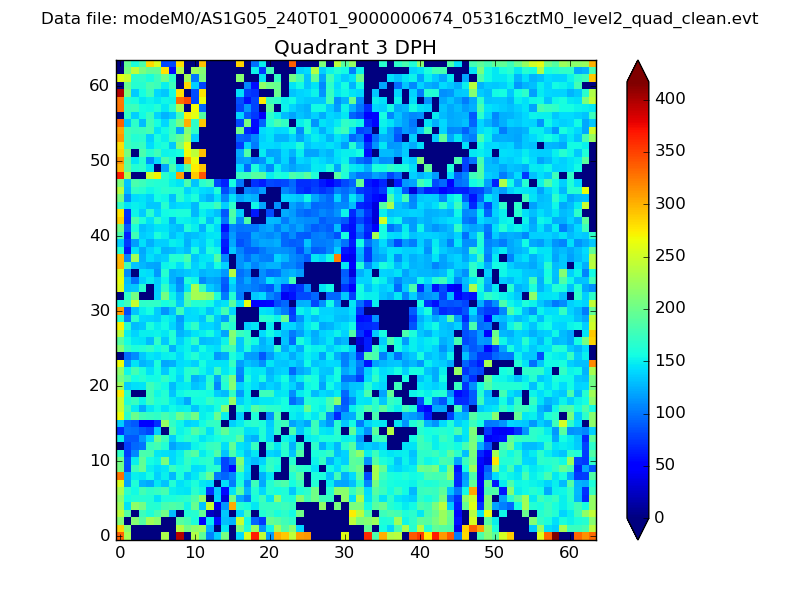 |
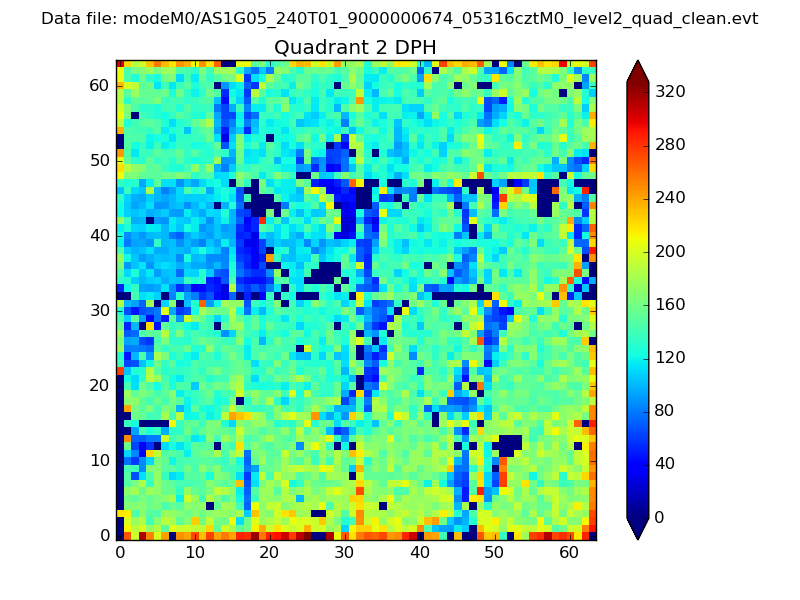 |
Quadrant C |
| Plot type | Count rate plots | Images |
|---|---|---|
| Comparison with Poisson distribution Blue bars denote a histogram of data divided into 1 sec bins. Red curve is a Poisson curve with rate = median count rate of data. |
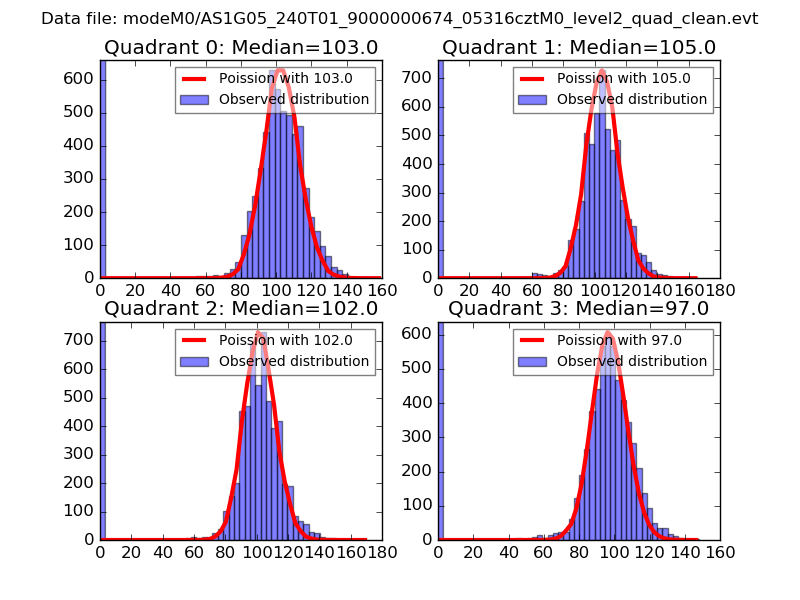 |
 |
| Quadrant-wise count rates Data is divided into 100 sec bins |
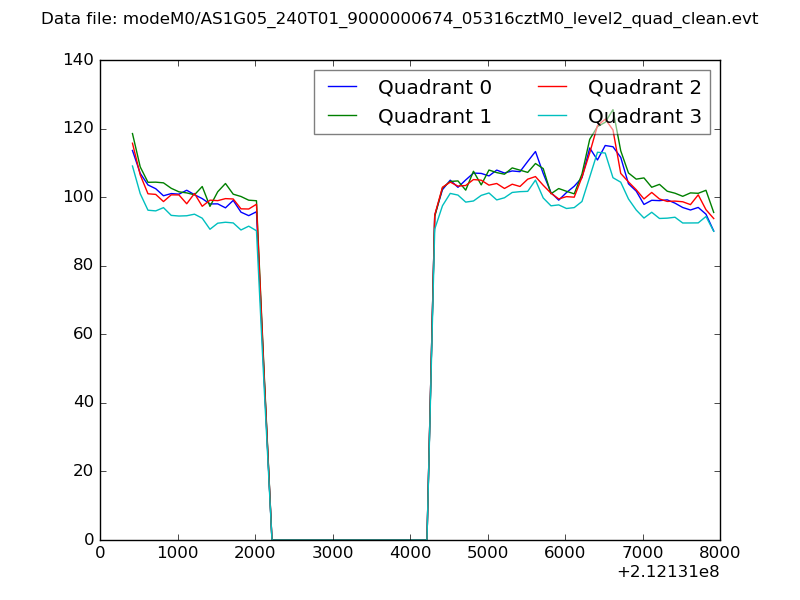 |
|
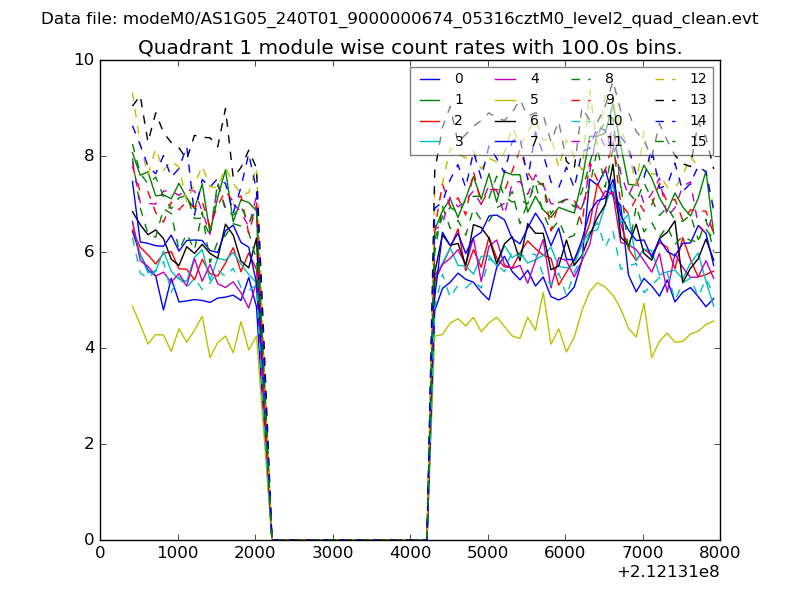
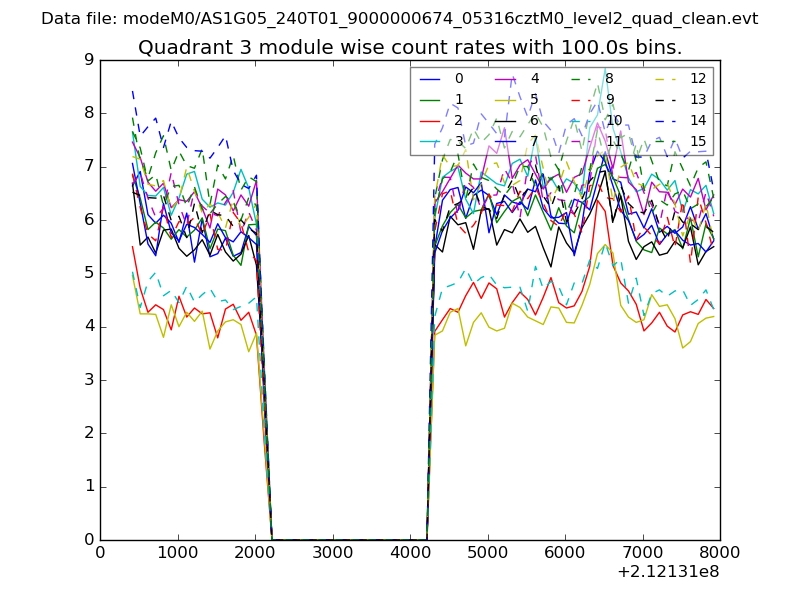
| Module-wise count rates for Quadrant A Data is divided into 100 sec bins |
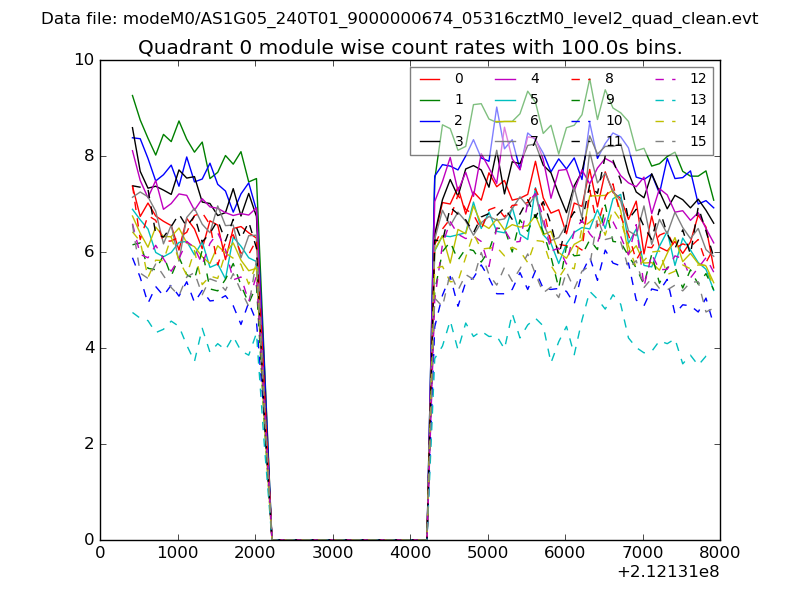 |
 |
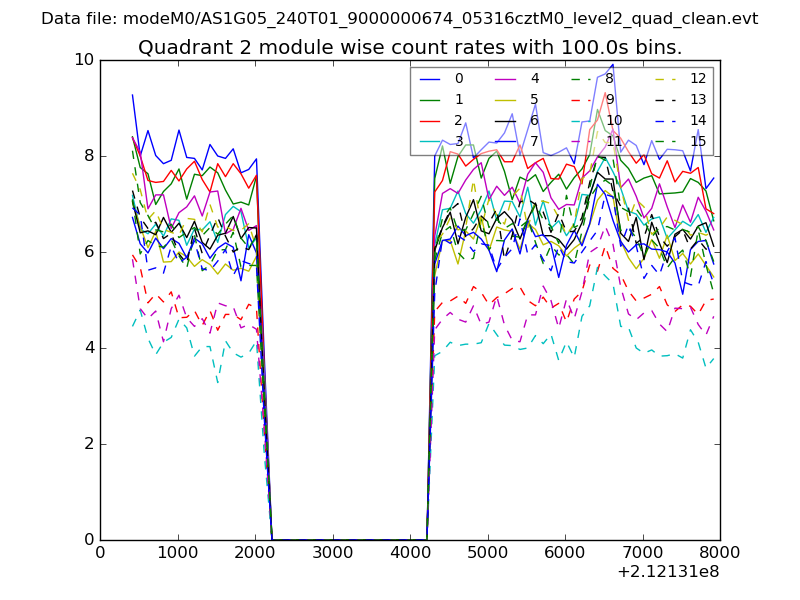
| Module-wise count rates for Quadrant B Data is divided into 100 sec bins |
 |
 |
| Module-wise count rates for Quadrant C Data is divided into 100 sec bins |
 |
 |
| Module-wise count rates for Quadrant D Data is divided into 100 sec bins |
 |
 |
| Parameter | Plot |
|---|---|
| CZT HV Monitor | 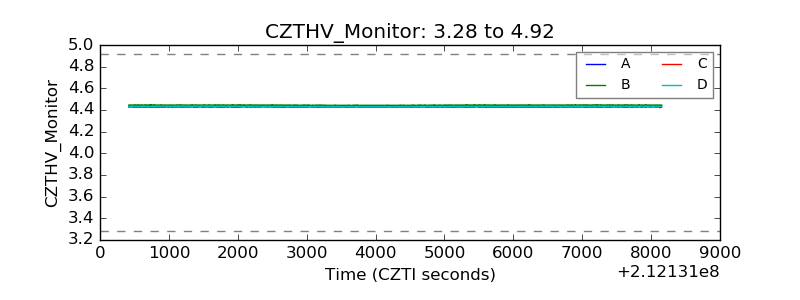 |
| D_VDD | 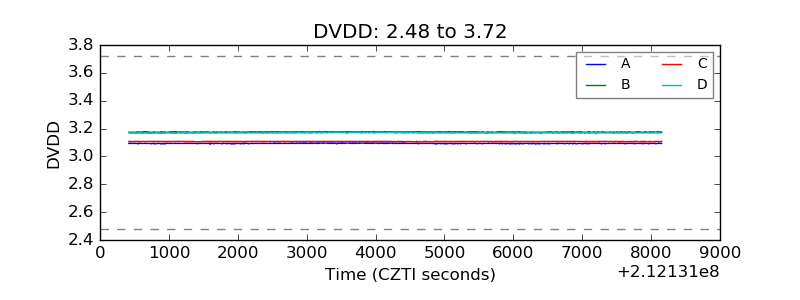 |
| Temperature 1 | 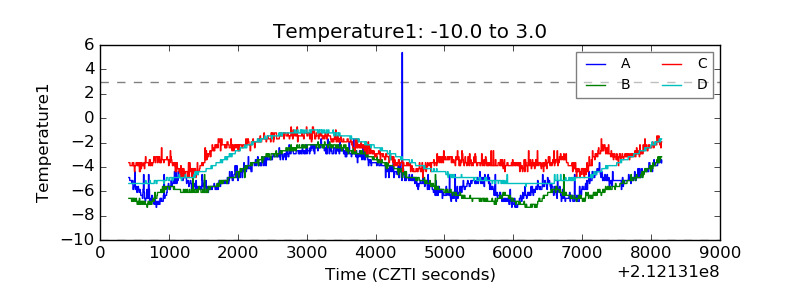 |
| Veto HV Monitor | 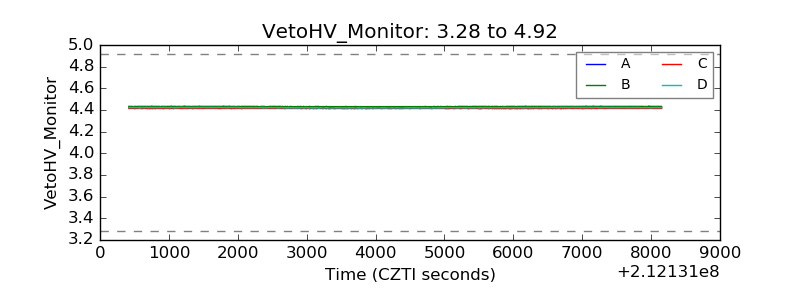 |
| Veto LLD | 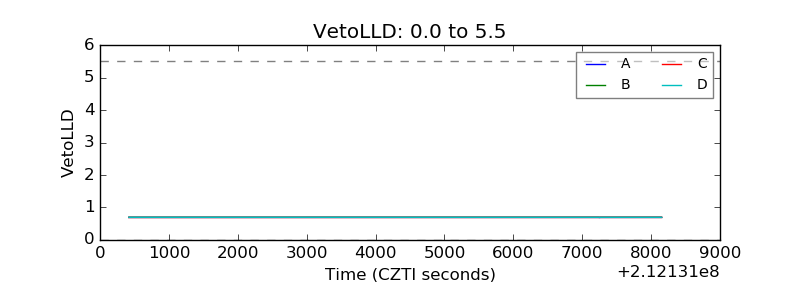 |
| Alpha Counter | 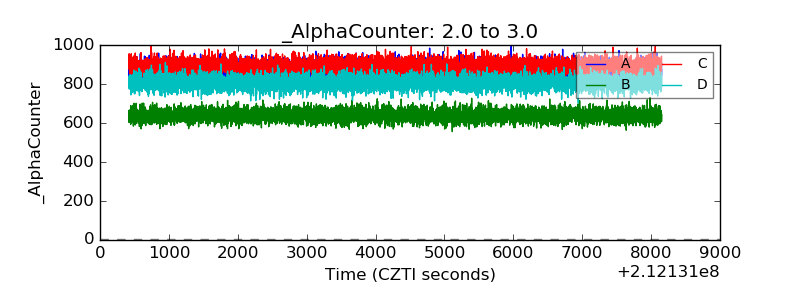 |
| _CPM_Rate | 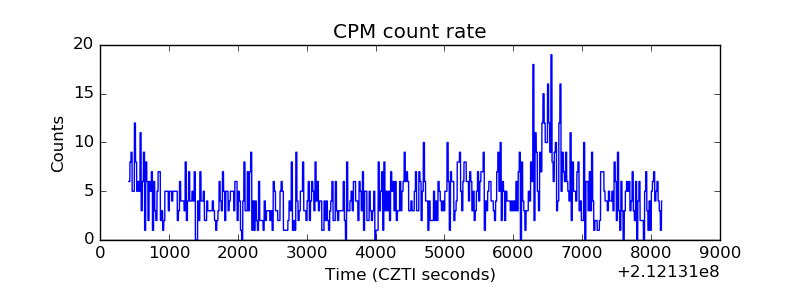 |
| CZT Counter | 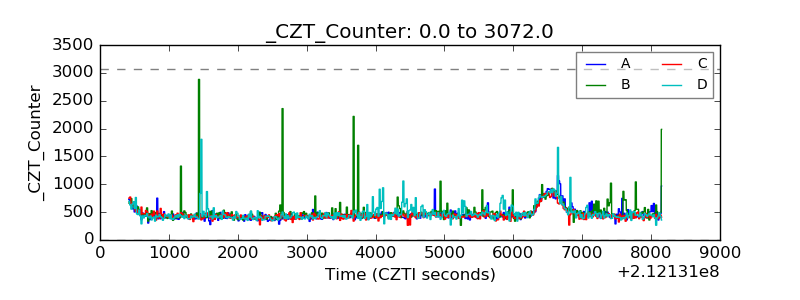 |
| +2.5 Volts monitor |  |
| +5 Volts monitor |  |
| _ROLL_ROT | 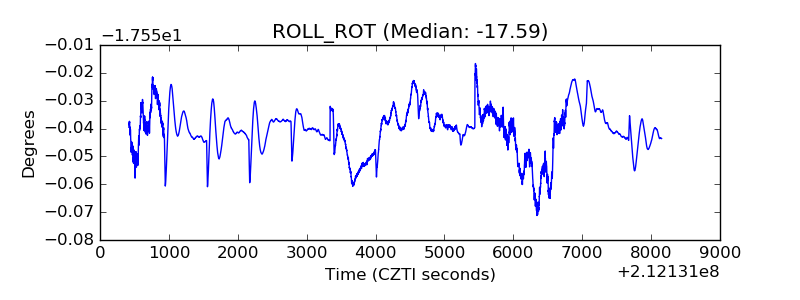 |
| _Roll_DEC | 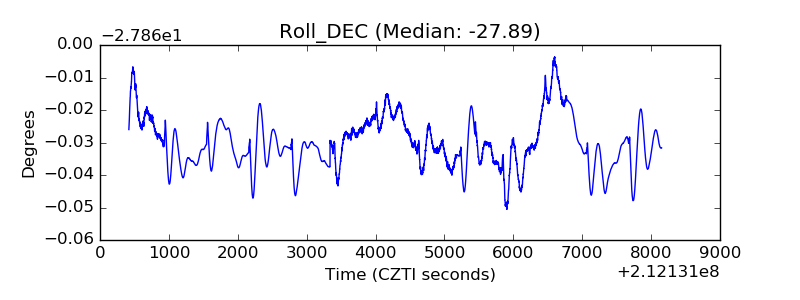 |
| _Roll_RA | 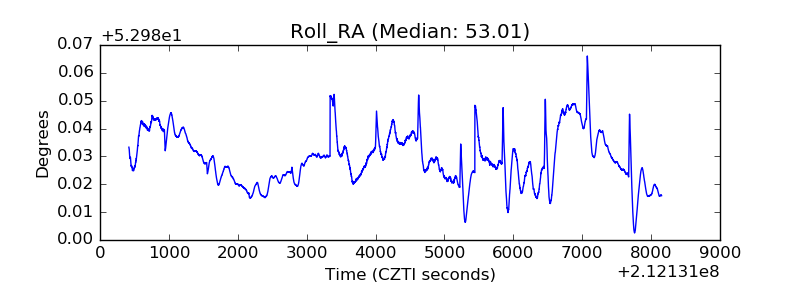 |
| Veto Counter |  |