| Param | Original file | Final file |
|---|---|---|
| Filename | modeM0/AS1G05_240T01_9000000674_05321cztM0_level2.evt | modeM0/AS1G05_240T01_9000000674_05321cztM0_level2_quad_clean.evt |
| Size (bytes) | 1,963,442,880 | 313,508,160 |
| Size | 1.8 GB | 299.0 MB |
| Events in quadrant A | 14,722,912 | 1,881,043 |
| Events in quadrant B | 14,482,952 | 1,906,948 |
| Events in quadrant C | 13,726,517 | 1,864,419 |
| Events in quadrant D | 14,515,453 | 1,792,984 |
| Mode M0 | |||
|---|---|---|---|
| Quadrant | BADHDUFLAG | Total packets | Discarded packets |
| A | 0 | 64826 | 6 |
| B | 0 | 63204 | 5 |
| C | 0 | 61826 | 5 |
| D | 0 | 64395 | 5 |
| Mode SS | |||
|---|---|---|---|
| Quadrant | BADHDUFLAG | Total packets | Discarded packets |
| A | 0 | 606 | 0 |
| B | 0 | 606 | 0 |
| C | 0 | 606 | 0 |
| D | 0 | 606 | 0 |
| Mode M9 | |||
|---|---|---|---|
| Quadrant | BADHDUFLAG | Total packets | Discarded packets |
| A | 0 | 28 | 0 |
| B | 0 | 28 | 0 |
| C | 0 | 28 | 0 |
| D | 0 | 28 | 0 |
| Quadrant | Total seconds | Saturated seconds | Saturation percentage |
|---|---|---|---|
| A | 29812 | 645 | 2.163558% |
| B | 29812 | 559 | 1.875084% |
| C | 29812 | 357 | 1.197504% |
| D | 29812 | 505 | 1.693949% |
Noise dominated data is calculated using 1-second bins in cleaned event files. If a bin has >2000 counts, and if more than 50% of those come from <1% of pixels, then it is considered to be noise-dominated and hence unusable.
| Quadrant | # 1 sec bins | Bins with >0 counts | Bins with >2000 counts | High rate bins dominated by noise | Noise dominated (total time) | Noise dominated (detector-on time) | Marked lightcurve |
|---|---|---|---|---|---|---|---|
| A | 32652 | 29812 | 92 | 92 | 0.28% | 0.31% | 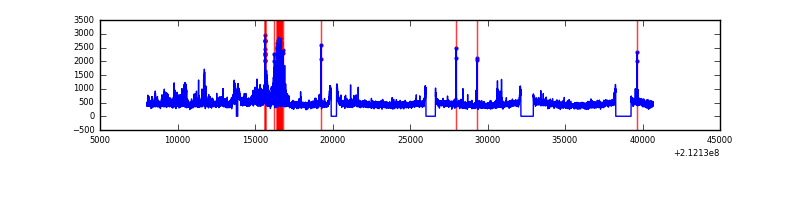 |
| B | 32652 | 29813 | 39 | 39 | 0.12% | 0.13% | 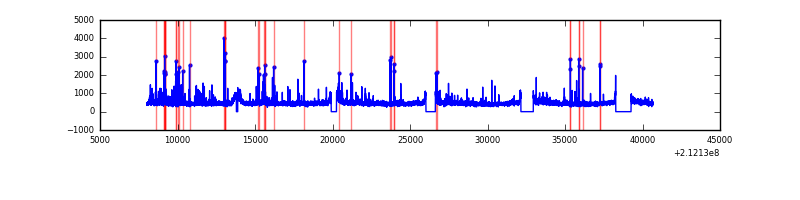 |
| C | 32652 | 29812 | 0 | 0 | 0.00% | 0.00% | 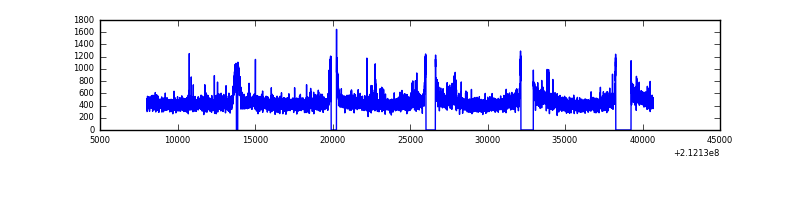 |
| D | 32652 | 29814 | 93 | 93 | 0.28% | 0.31% | 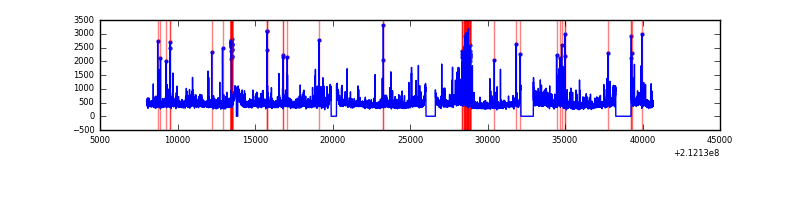 |
Top three noisy pixels from each quadrant. If the there are fewer than three noisy pixels in the level2.evt file, extra rows are filled as -1
| Pixel properties | Quadrant properties | ||||||
|---|---|---|---|---|---|---|---|
| Quadrant | DetID | PixID | Counts | Sigma | Mean | Median | Sigma |
| A | 0 | 247 | 1268621 | 1805.3 | 3431 | 3351 | 700.9 |
| A | 0 | 226 | 149562 | 208.62 | 3431 | 3351 | 700.9 |
| A | 0 | 50 | 107199 | 148.17 | 3431 | 3351 | 700.9 |
| B | 4 | 80 | 391517 | 585.02 | 3479 | 3389 | 663.4 |
| B | 10 | 16 | 227498 | 337.8 | 3479 | 3389 | 663.4 |
| B | 4 | 48 | 114847 | 168.0 | 3479 | 3389 | 663.4 |
| C | 1 | 16 | 541147 | 691.56 | 3361 | 3379 | 777.6 |
| C | 14 | 67 | 35660 | 41.51 | 3361 | 3379 | 777.6 |
| C | 13 | 61 | 27280 | 30.74 | 3361 | 3379 | 777.6 |
| D | 2 | 136 | 559933 | 681.77 | 3346 | 3236 | 816.5 |
| D | 2 | 234 | 499574 | 607.85 | 3346 | 3236 | 816.5 |
| D | 8 | 195 | 240978 | 291.16 | 3346 | 3236 | 816.5 |
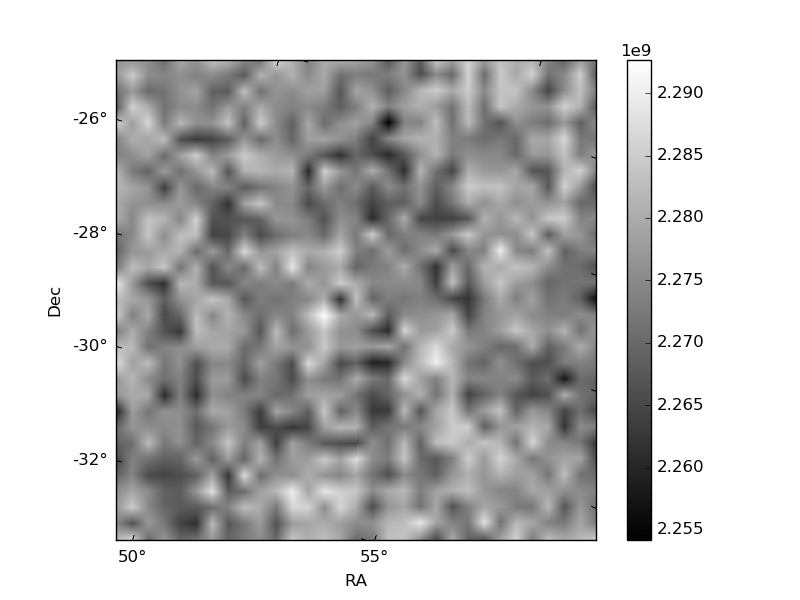
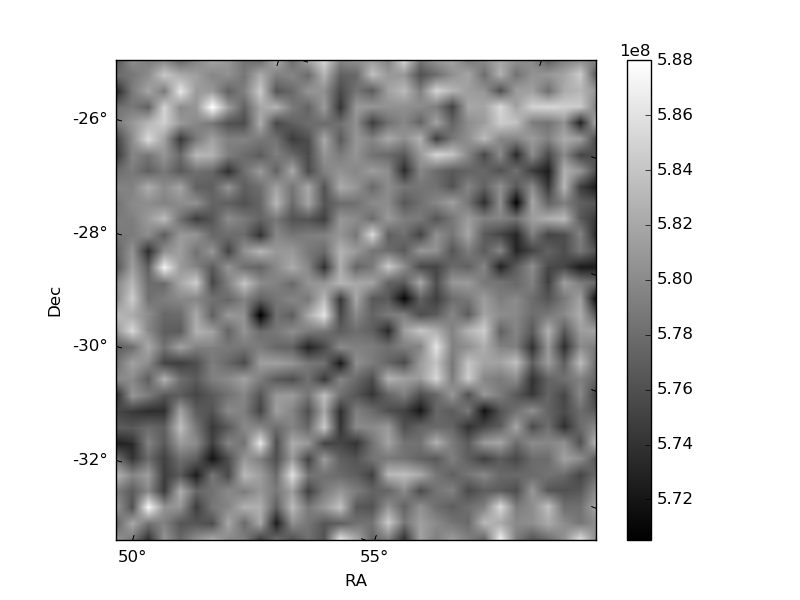
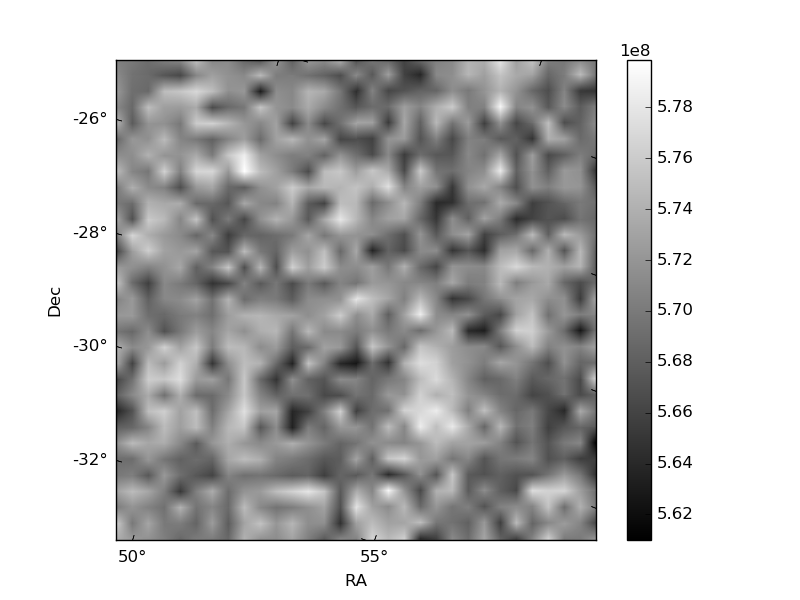
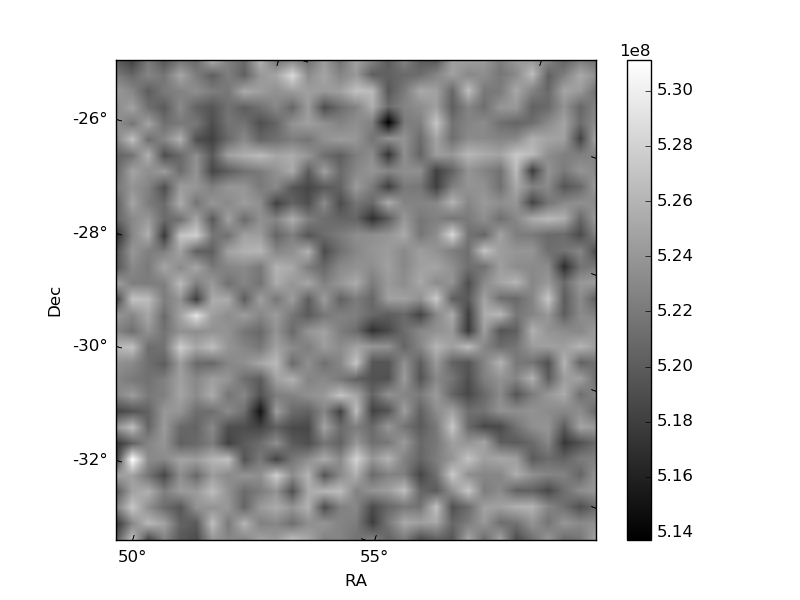
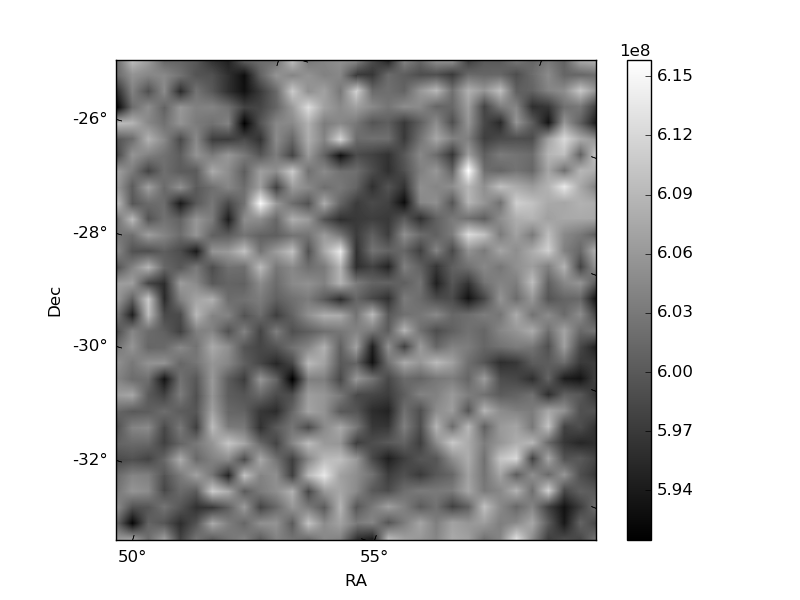
Histogram calculated using DETX and DETY for each event in the final _common_clean file
| Quadrant A | 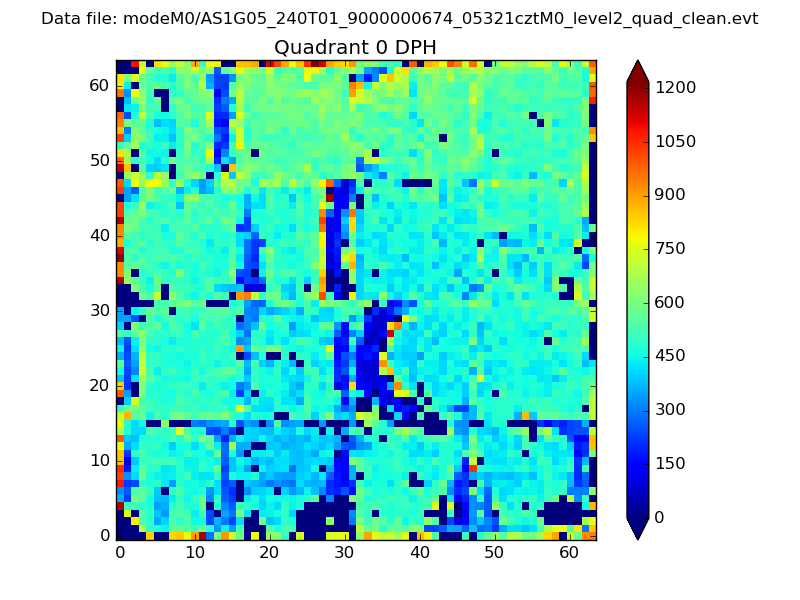 |
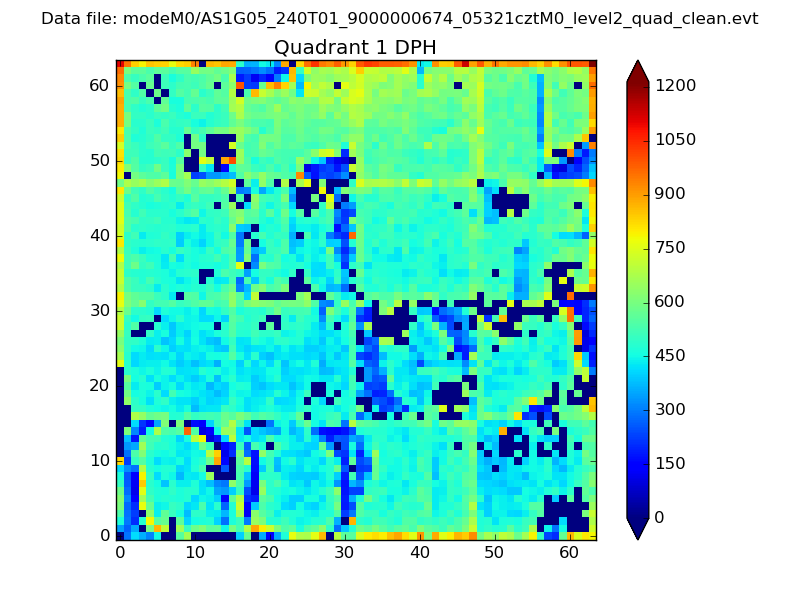 |
Quadrant B |
|---|---|---|---|
| Quadrant D | 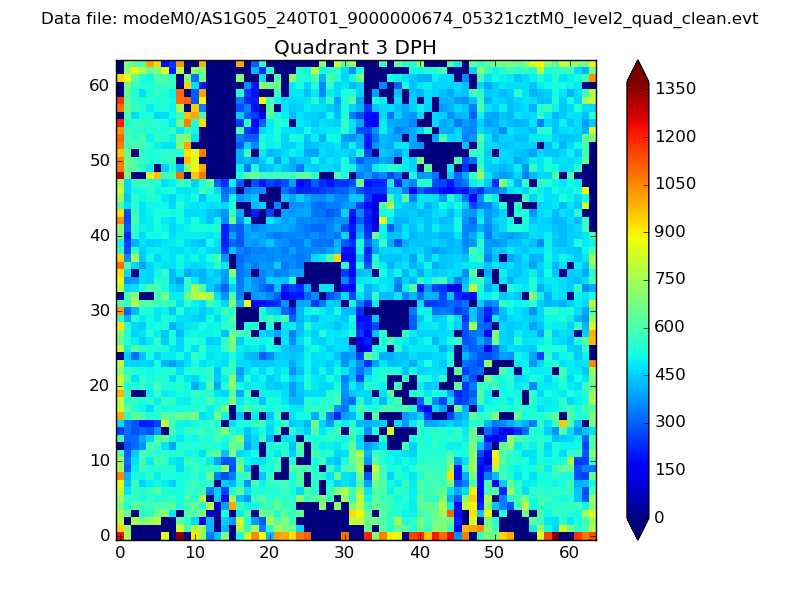 |
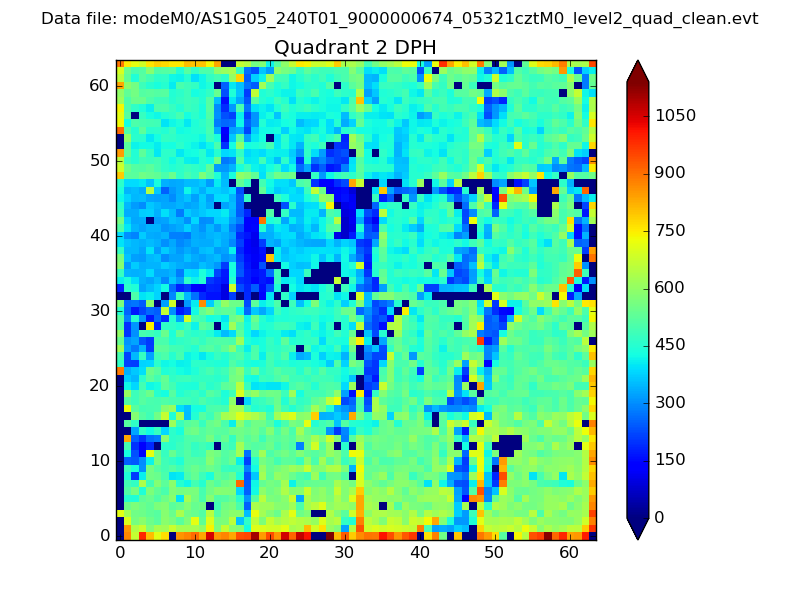 |
Quadrant C |
| Plot type | Count rate plots | Images |
|---|---|---|
| Comparison with Poisson distribution Blue bars denote a histogram of data divided into 1 sec bins. Red curve is a Poisson curve with rate = median count rate of data. |
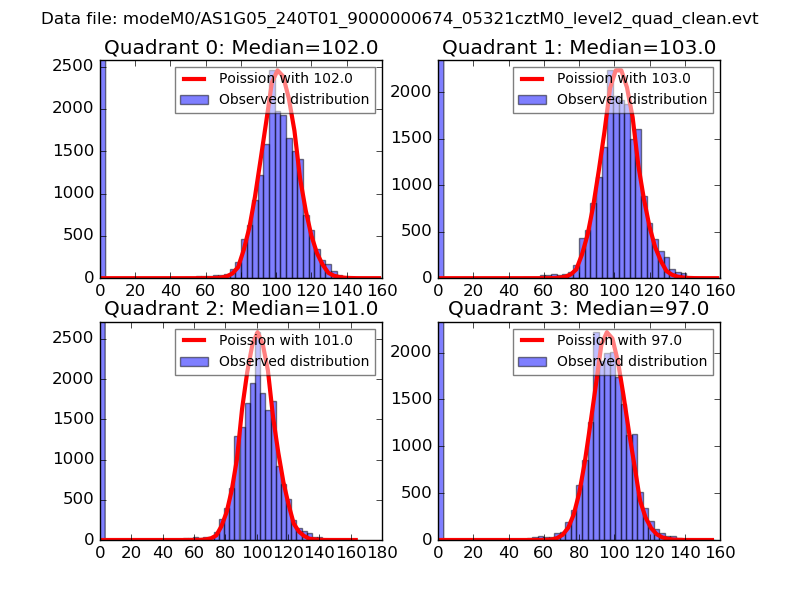 |
 |
| Quadrant-wise count rates Data is divided into 100 sec bins |
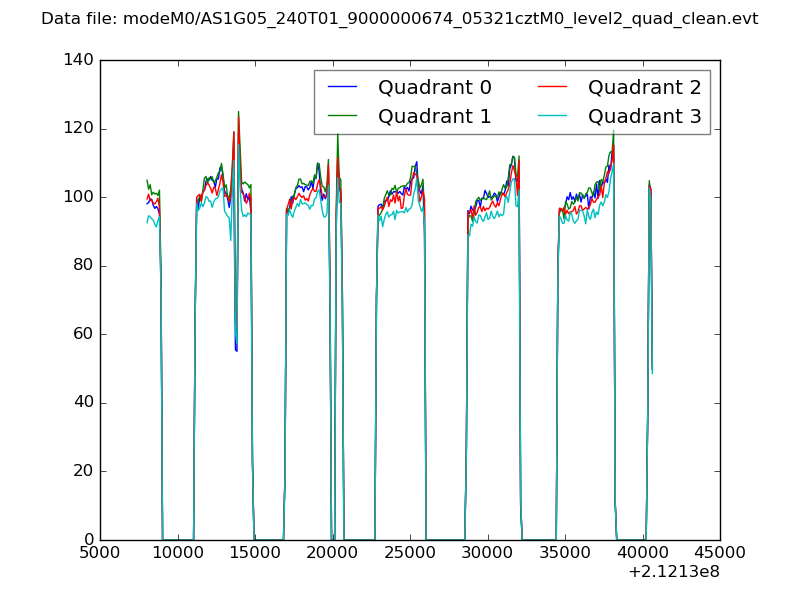 |
|
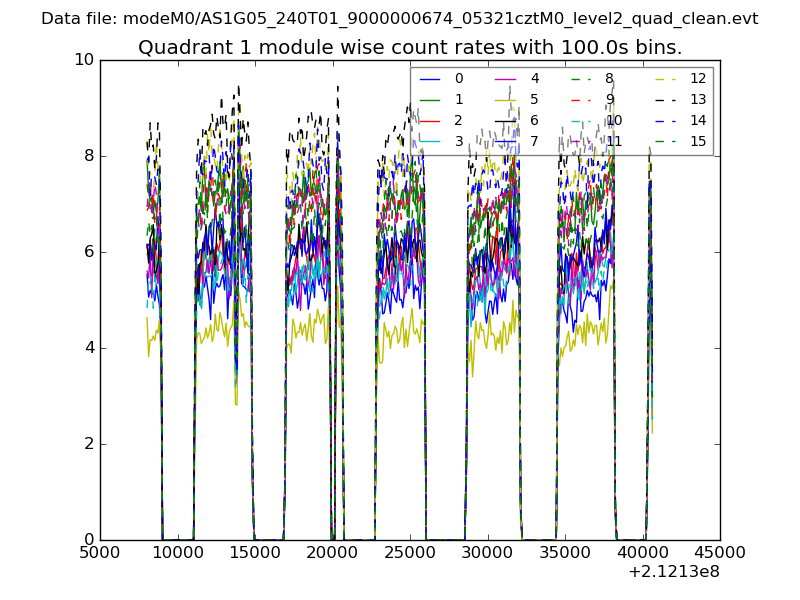
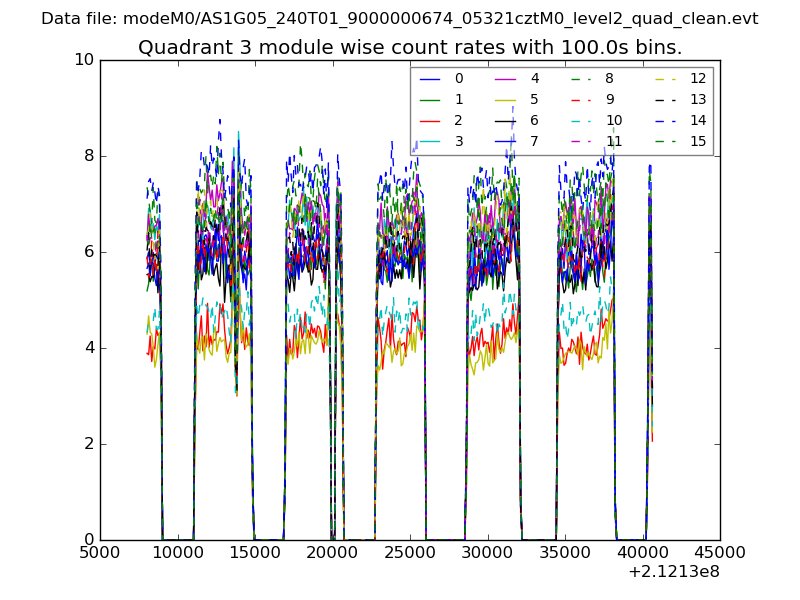
| Module-wise count rates for Quadrant A Data is divided into 100 sec bins |
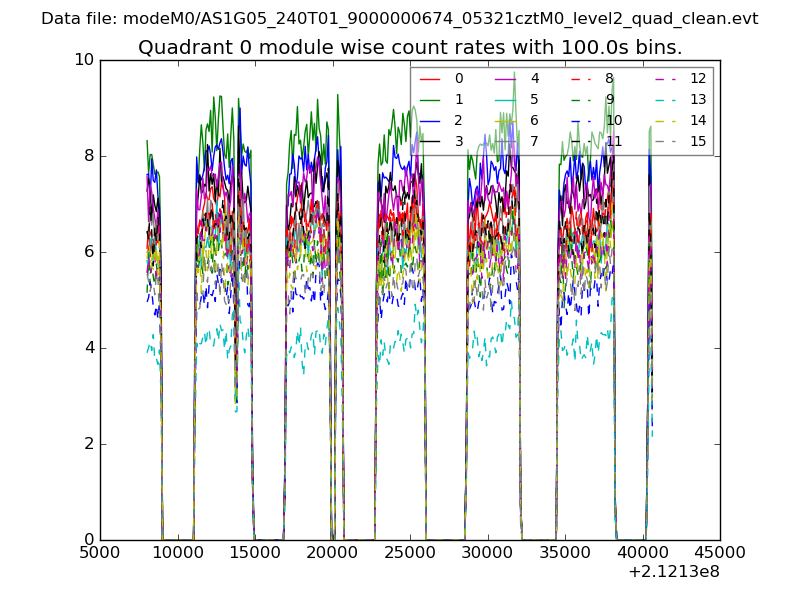 |
 |
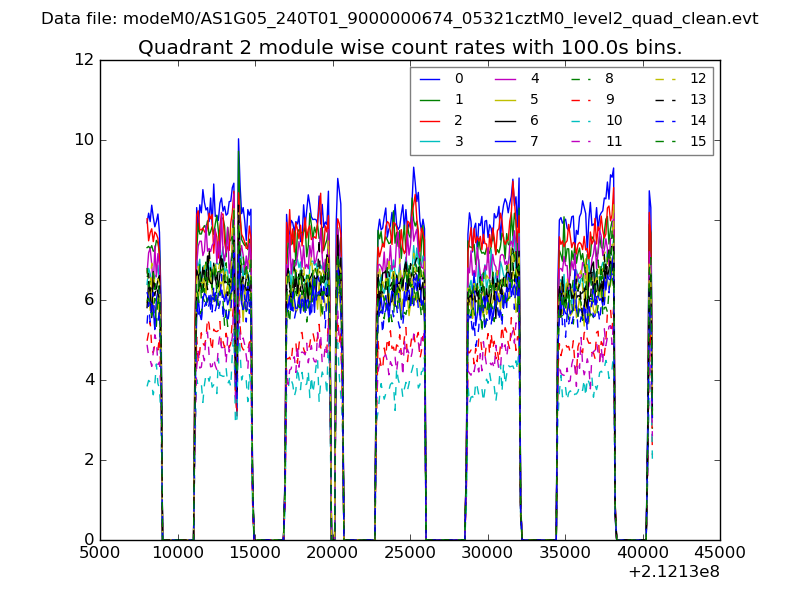
| Module-wise count rates for Quadrant B Data is divided into 100 sec bins |
 |
 |
| Module-wise count rates for Quadrant C Data is divided into 100 sec bins |
 |
 |
| Module-wise count rates for Quadrant D Data is divided into 100 sec bins |
 |
 |
| Parameter | Plot |
|---|---|
| CZT HV Monitor | 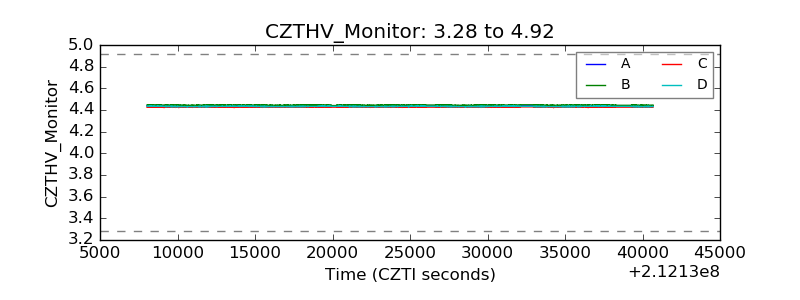 |
| D_VDD | 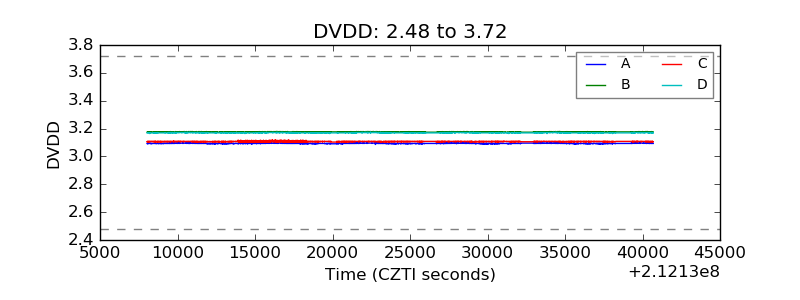 |
| Temperature 1 | 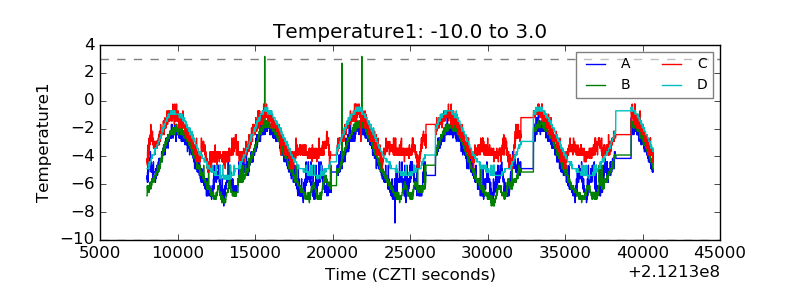 |
| Veto HV Monitor | 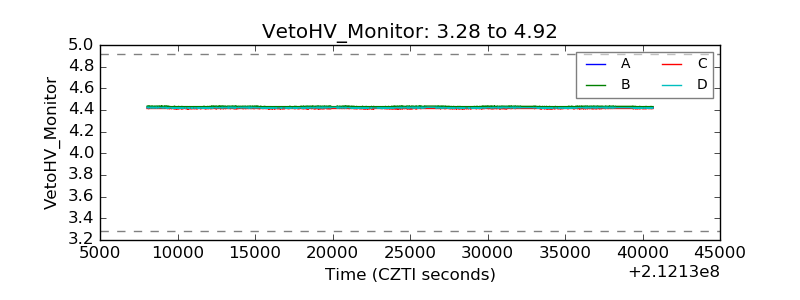 |
| Veto LLD |  |
| Alpha Counter | 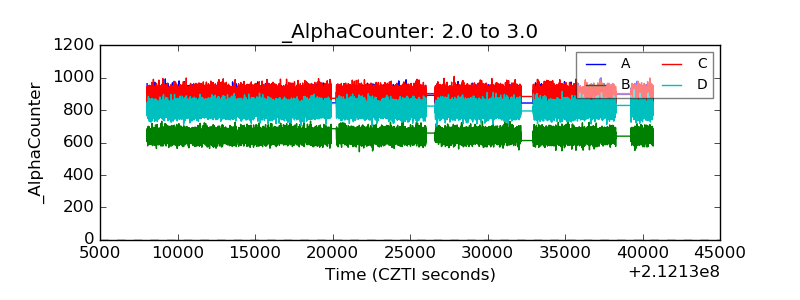 |
| _CPM_Rate | 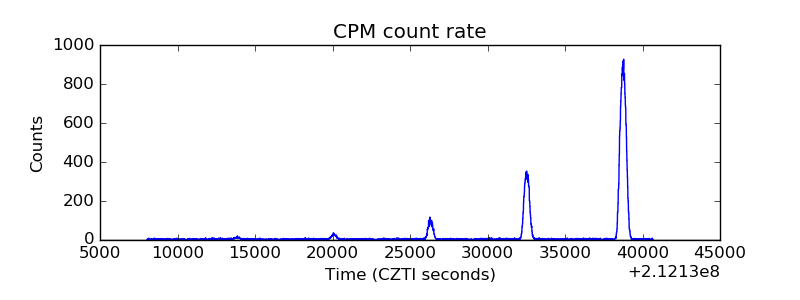 |
| CZT Counter | 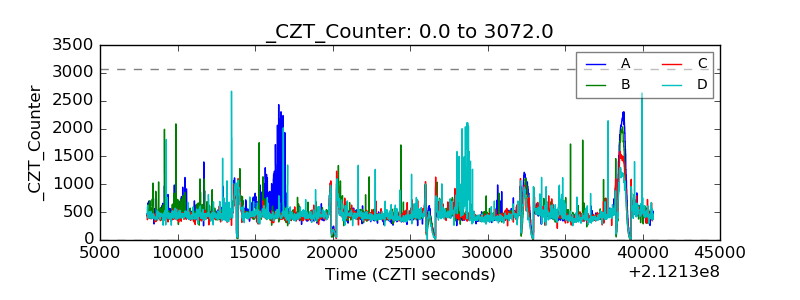 |
| +2.5 Volts monitor |  |
| +5 Volts monitor |  |
| _ROLL_ROT | 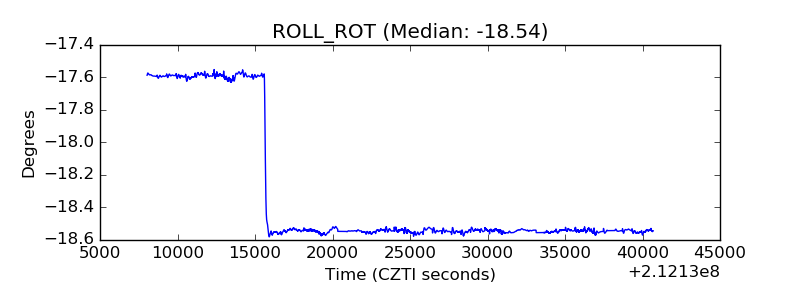 |
| _Roll_DEC | 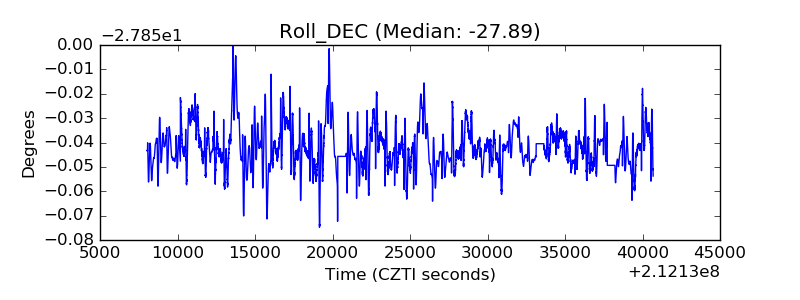 |
| _Roll_RA | 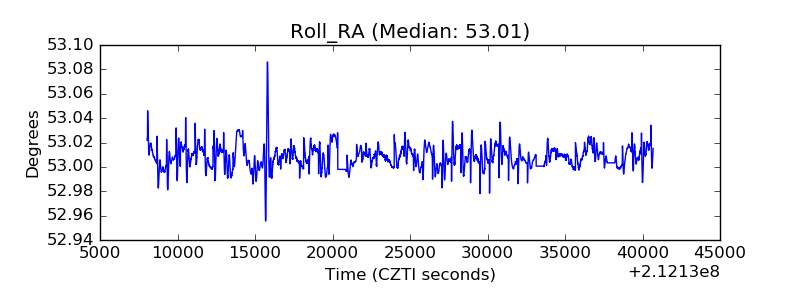 |
| Veto Counter | 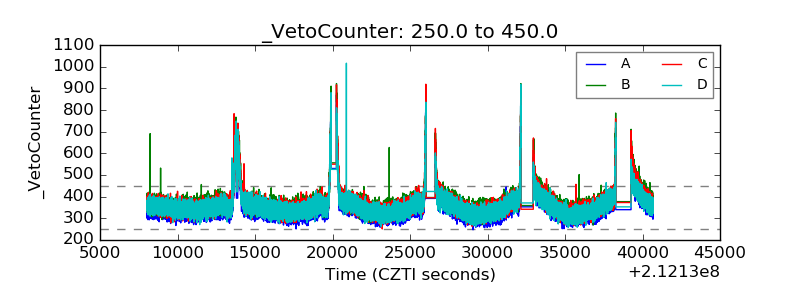 |