| Param | Original file | Final file |
|---|---|---|
| Filename | modeM0/AS1G05_240T01_9000000674_05323cztM0_level2.evt | modeM0/AS1G05_240T01_9000000674_05323cztM0_level2_quad_clean.evt |
| Size (bytes) | 427,829,760 | 71,884,800 |
| Size | 408.0 MB | 68.6 MB |
| Events in quadrant A | 3,114,665 | 437,312 |
| Events in quadrant B | 3,216,785 | 444,701 |
| Events in quadrant C | 3,114,952 | 430,211 |
| Events in quadrant D | 3,071,997 | 414,564 |
| Mode M0 | |||
|---|---|---|---|
| Quadrant | BADHDUFLAG | Total packets | Discarded packets |
| A | 0 | 13662 | 3 |
| B | 0 | 13912 | 2 |
| C | 0 | 13640 | 2 |
| D | 0 | 13793 | 2 |
| Mode SS | |||
|---|---|---|---|
| Quadrant | BADHDUFLAG | Total packets | Discarded packets |
| A | 0 | 132 | 0 |
| B | 0 | 132 | 0 |
| C | 0 | 132 | 0 |
| D | 0 | 132 | 0 |
| Mode M9 | |||
|---|---|---|---|
| Quadrant | BADHDUFLAG | Total packets | Discarded packets |
| A | 0 | 21 | 0 |
| B | 0 | 21 | 0 |
| C | 0 | 21 | 0 |
| D | 0 | 21 | 0 |
| Quadrant | Total seconds | Saturated seconds | Saturation percentage |
|---|---|---|---|
| A | 6451 | 110 | 1.705162% |
| B | 6451 | 112 | 1.736165% |
| C | 6451 | 63 | 0.976593% |
| D | 6451 | 73 | 1.131608% |
Noise dominated data is calculated using 1-second bins in cleaned event files. If a bin has >2000 counts, and if more than 50% of those come from <1% of pixels, then it is considered to be noise-dominated and hence unusable.
| Quadrant | # 1 sec bins | Bins with >0 counts | Bins with >2000 counts | High rate bins dominated by noise | Noise dominated (total time) | Noise dominated (detector-on time) | Marked lightcurve |
|---|---|---|---|---|---|---|---|
| A | 8546 | 6451 | 26 | 26 | 0.30% | 0.40% | 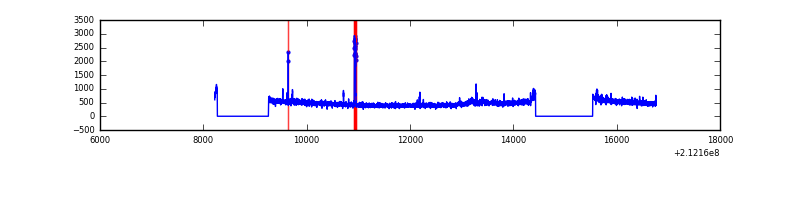 |
| B | 8546 | 6451 | 22 | 22 | 0.26% | 0.34% | 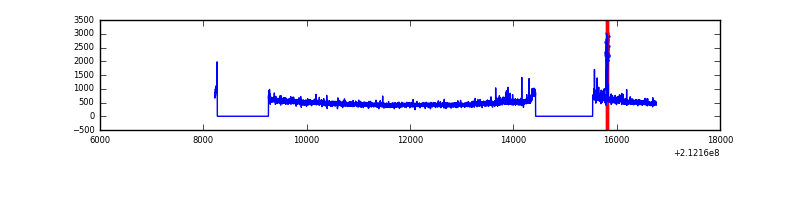 |
| C | 8546 | 6451 | 0 | 0 | 0.00% | 0.00% |  |
| D | 8546 | 6452 | 15 | 15 | 0.18% | 0.23% | 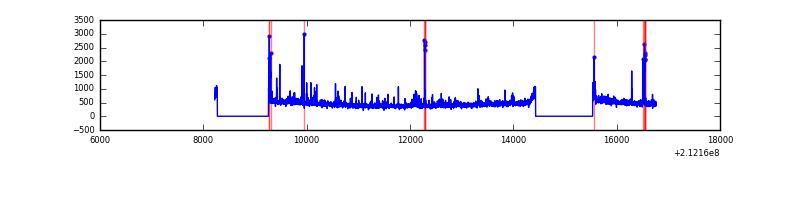 |
Top three noisy pixels from each quadrant. If the there are fewer than three noisy pixels in the level2.evt file, extra rows are filled as -1
| Pixel properties | Quadrant properties | ||||||
|---|---|---|---|---|---|---|---|
| Quadrant | DetID | PixID | Counts | Sigma | Mean | Median | Sigma |
| A | 0 | 50 | 126688 | 800.26 | 769 | 751 | 157.4 |
| A | 0 | 247 | 17832 | 108.54 | 769 | 751 | 157.4 |
| A | 0 | 226 | 9092 | 53.0 | 769 | 751 | 157.4 |
| B | 10 | 16 | 77843 | 513.1 | 781 | 763 | 150.2 |
| B | 15 | 204 | 54234 | 355.94 | 781 | 763 | 150.2 |
| B | 4 | 48 | 33123 | 215.41 | 781 | 763 | 150.2 |
| C | 1 | 16 | 179557 | 1038.92 | 747 | 750 | 172.1 |
| C | 14 | 67 | 18642 | 103.96 | 747 | 750 | 172.1 |
| C | 13 | 61 | 5982 | 30.4 | 747 | 750 | 172.1 |
| D | 2 | 234 | 118847 | 652.59 | 741 | 718 | 181.0 |
| D | 2 | 14 | 47388 | 257.82 | 741 | 718 | 181.0 |
| D | 2 | 63 | 42403 | 230.29 | 741 | 718 | 181.0 |
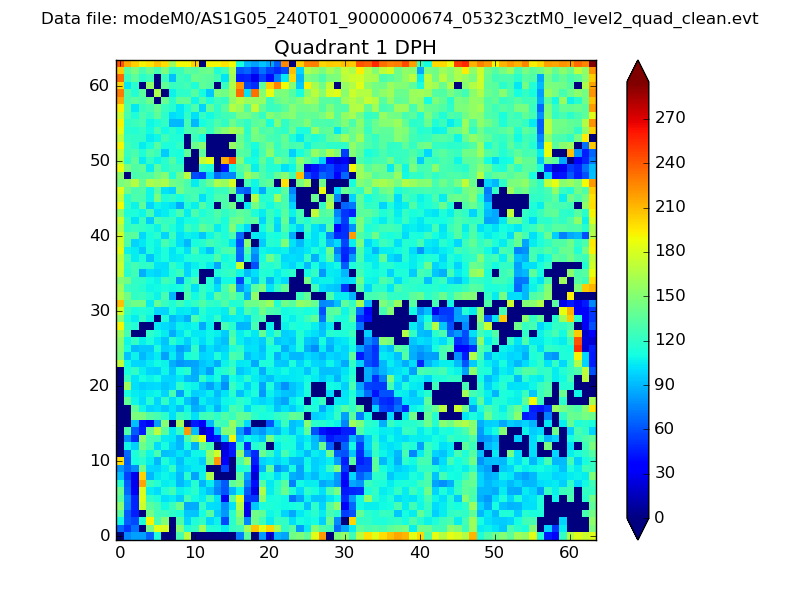
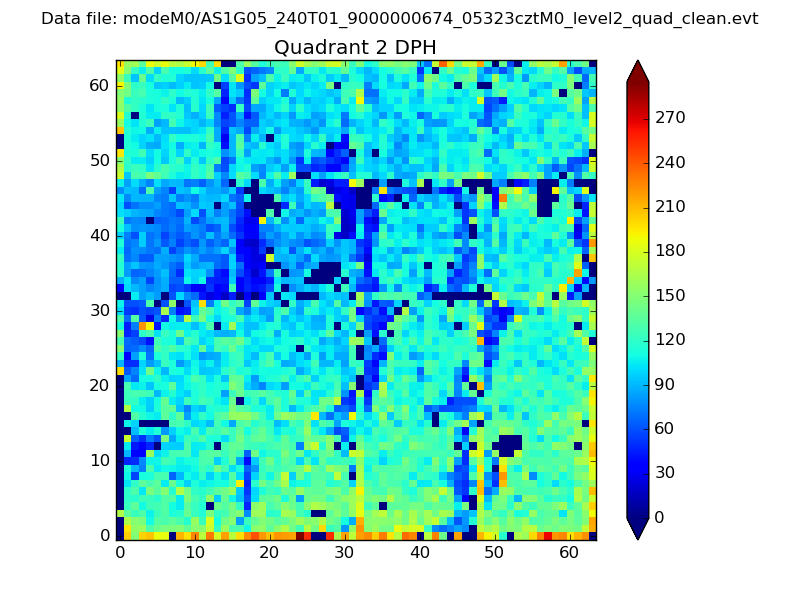
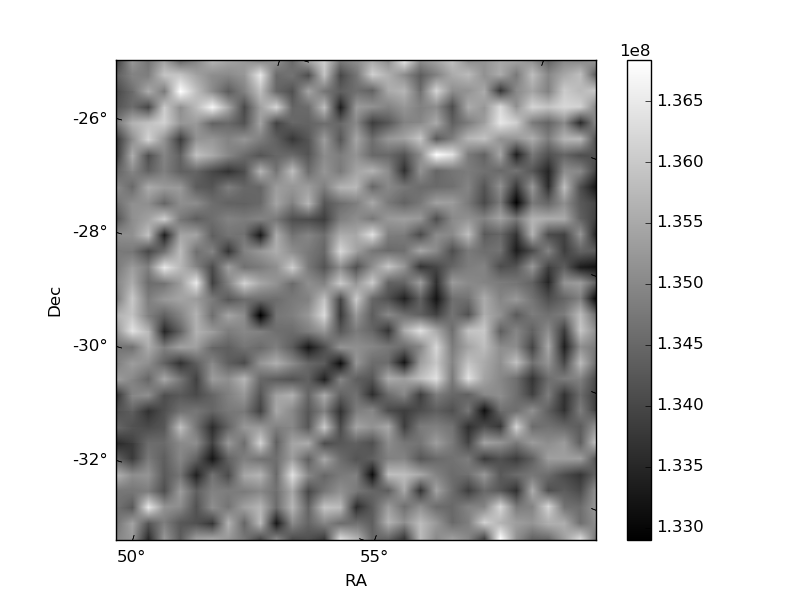
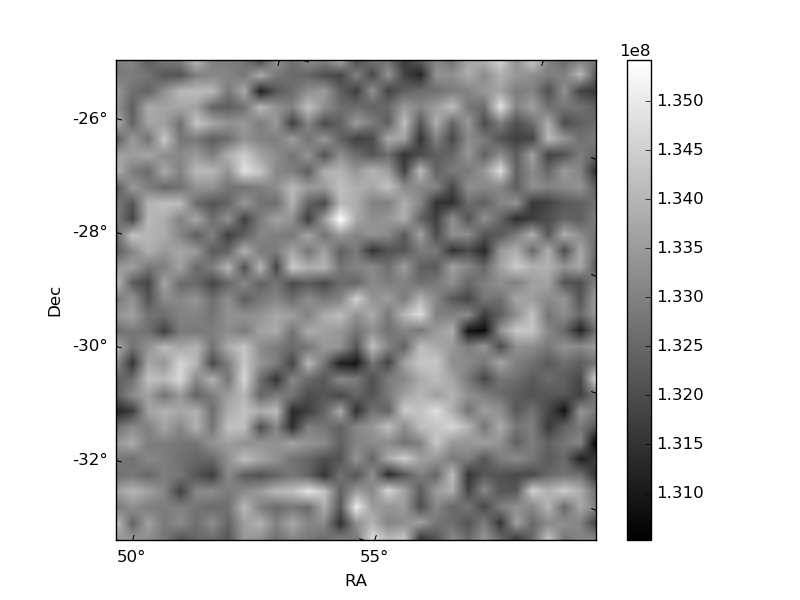
Histogram calculated using DETX and DETY for each event in the final _common_clean file
| Quadrant A | 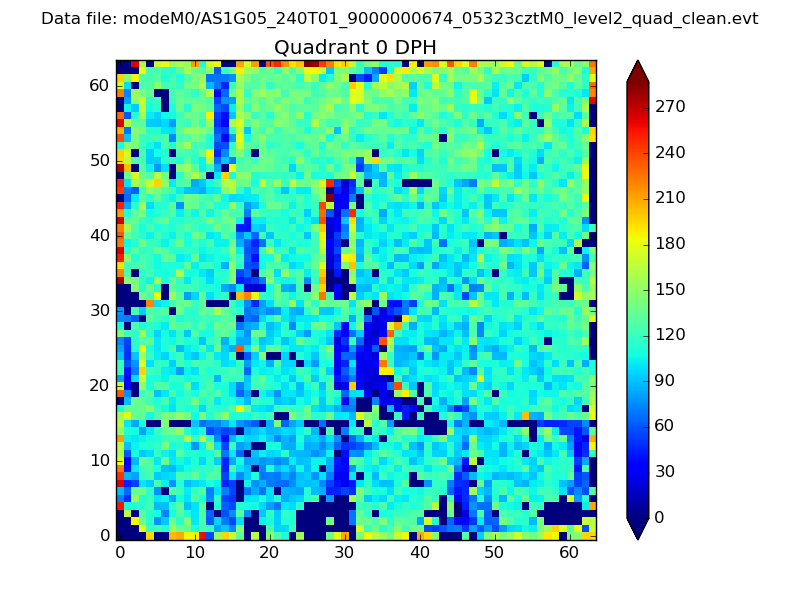 |
 |
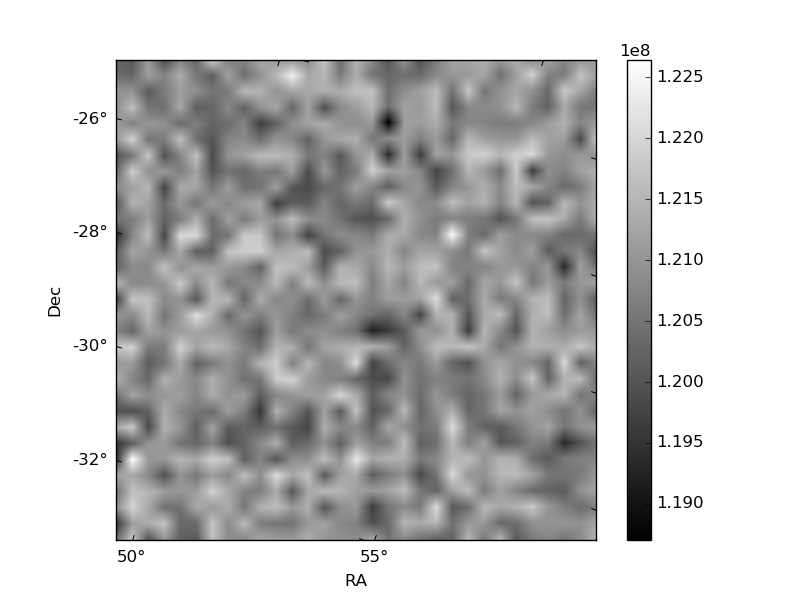
Quadrant B |
|---|---|---|---|
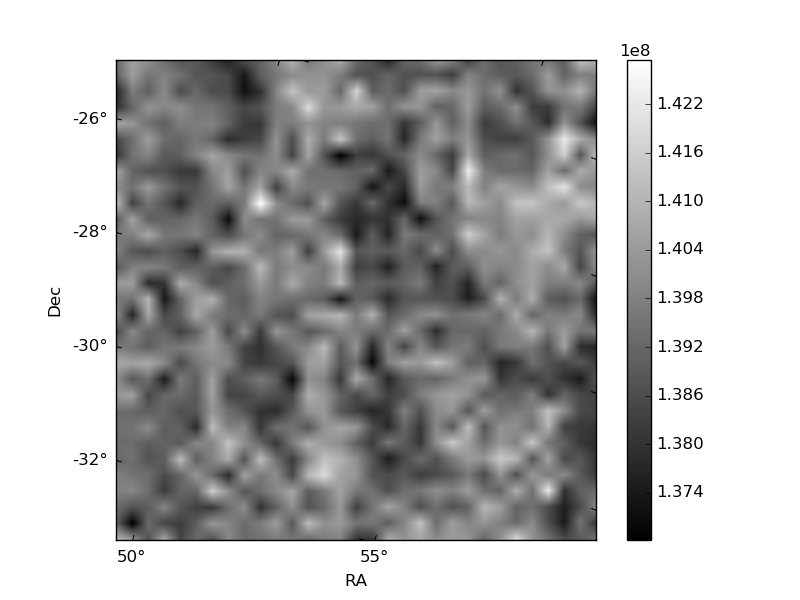
| Quadrant D |  |
 |
Quadrant C |
| Plot type | Count rate plots | Images |
|---|---|---|
| Comparison with Poisson distribution Blue bars denote a histogram of data divided into 1 sec bins. Red curve is a Poisson curve with rate = median count rate of data. |
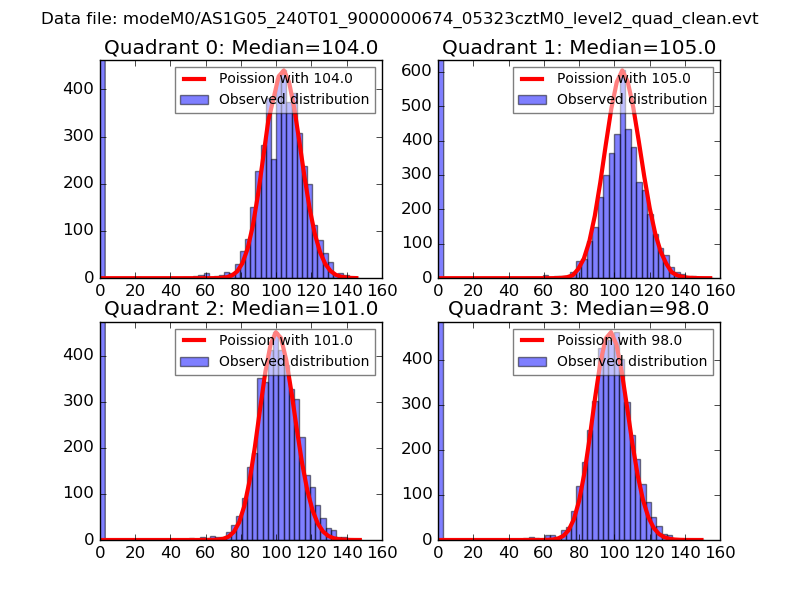 |
 |
| Quadrant-wise count rates Data is divided into 100 sec bins |
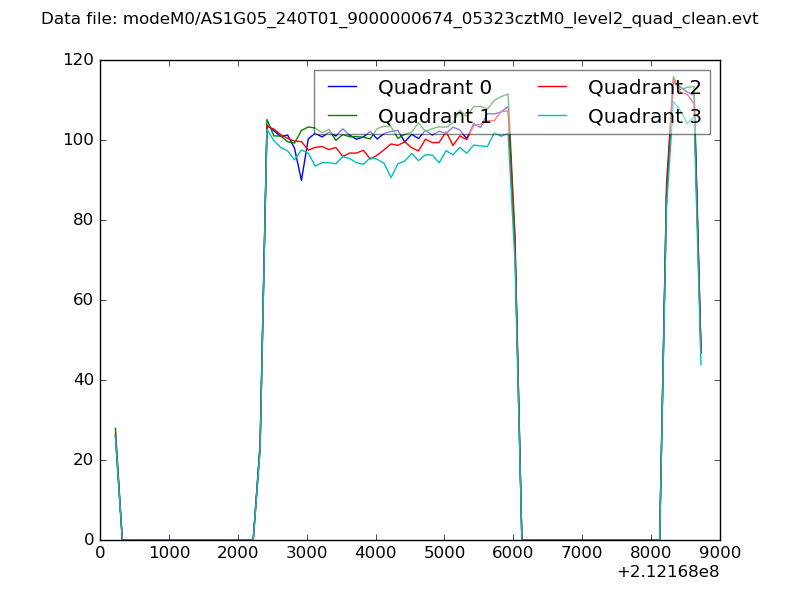 |
|
| Module-wise count rates for Quadrant A Data is divided into 100 sec bins |
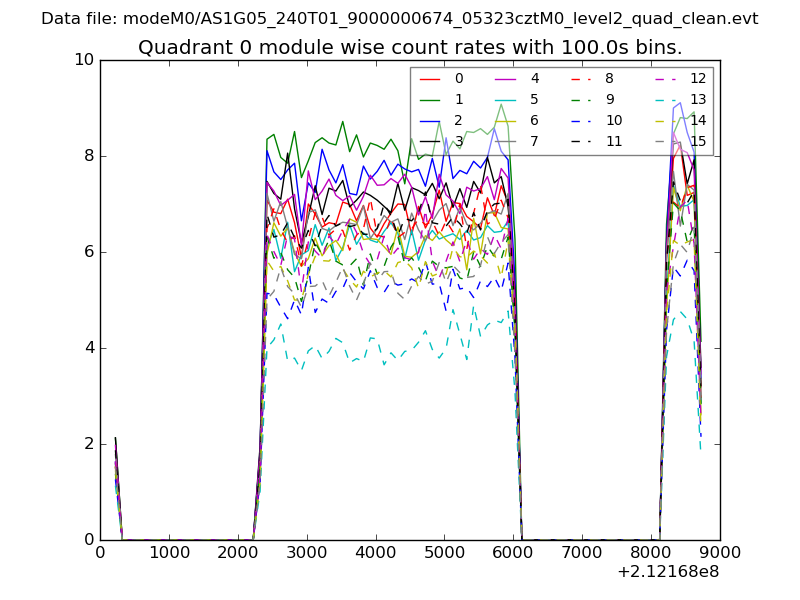 |
 |
| Module-wise count rates for Quadrant B Data is divided into 100 sec bins |
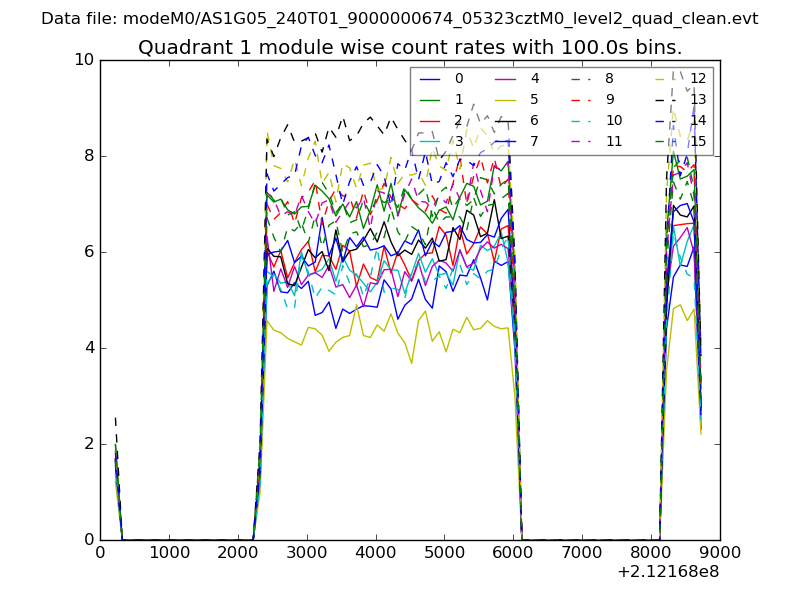 |
 |
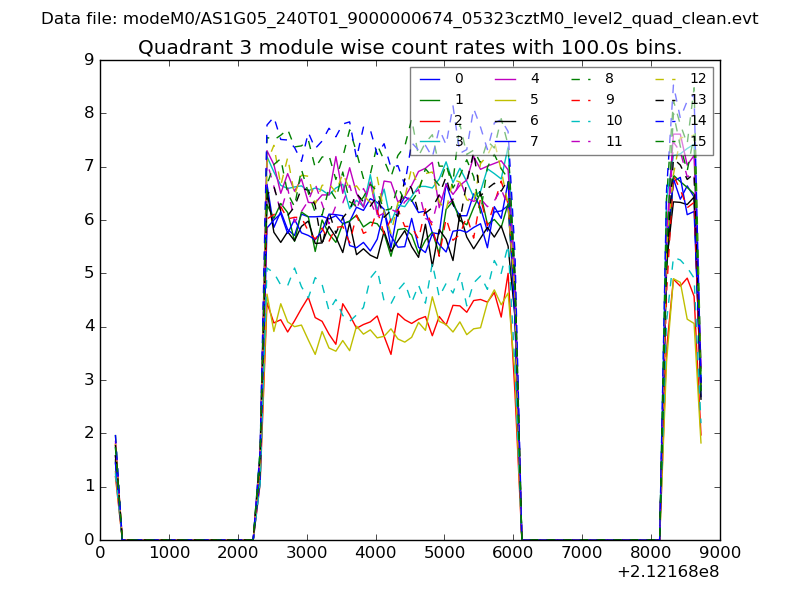
| Module-wise count rates for Quadrant C Data is divided into 100 sec bins |
 |
 |
| Module-wise count rates for Quadrant D Data is divided into 100 sec bins |
 |
 |
| Parameter | Plot |
|---|---|
| CZT HV Monitor | 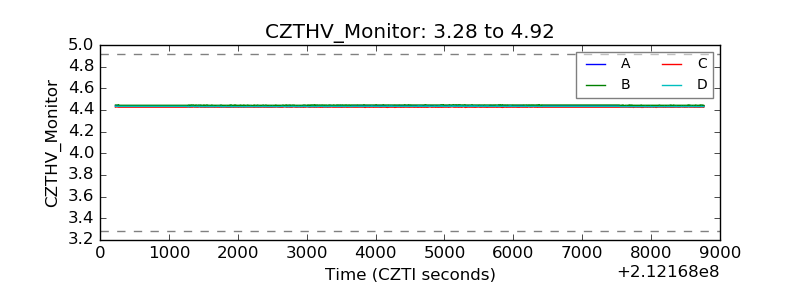 |
| D_VDD | 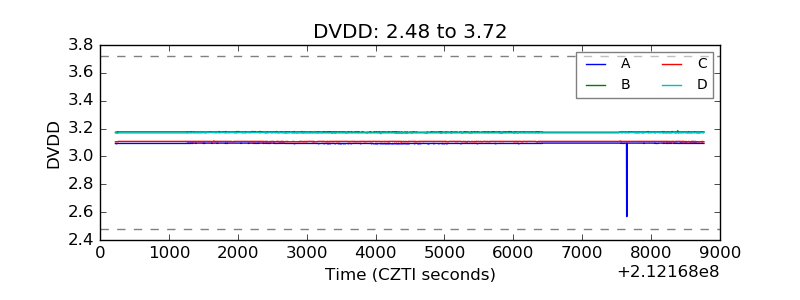 |
| Temperature 1 | 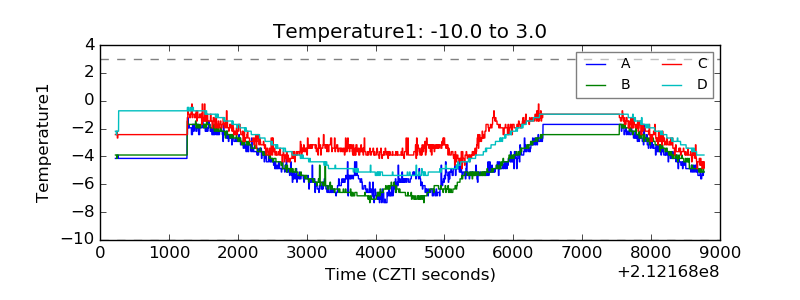 |
| Veto HV Monitor | 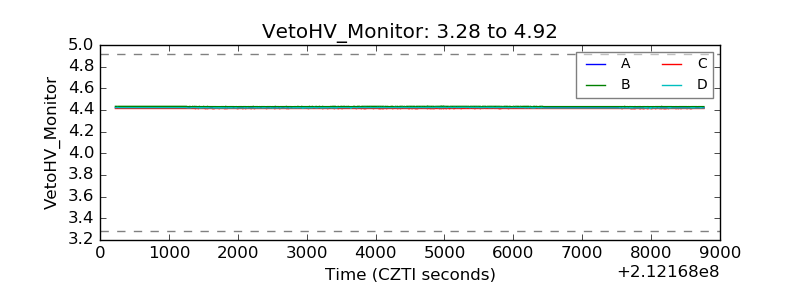 |
| Veto LLD | 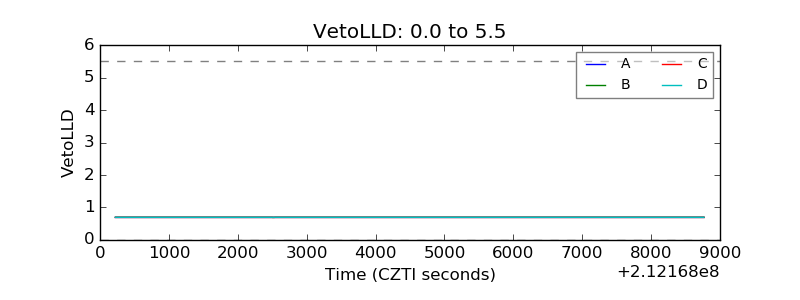 |
| Alpha Counter | 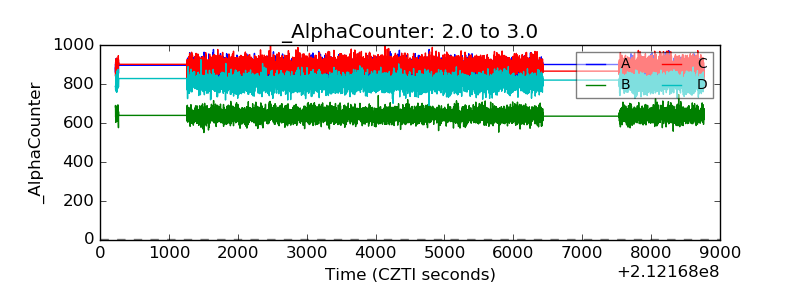 |
| _CPM_Rate | 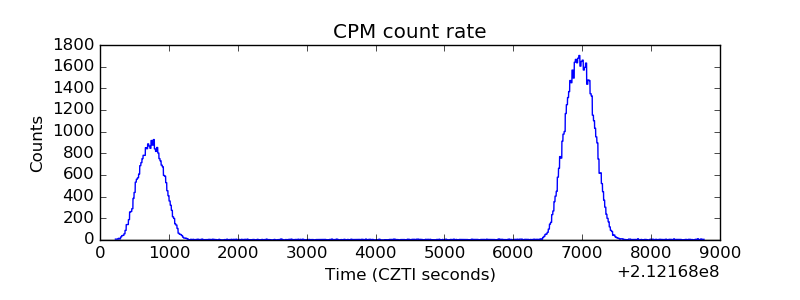 |
| CZT Counter | 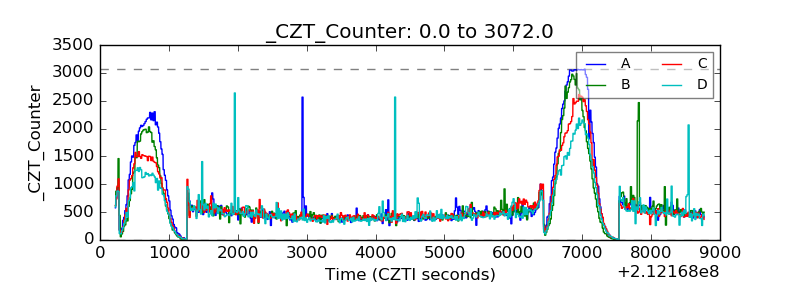 |
| +2.5 Volts monitor |  |
| +5 Volts monitor | 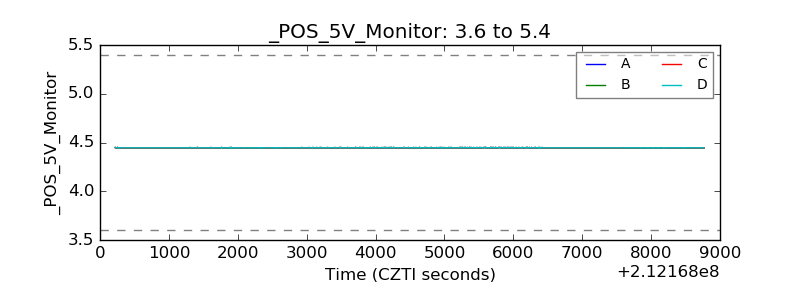 |
| _ROLL_ROT | 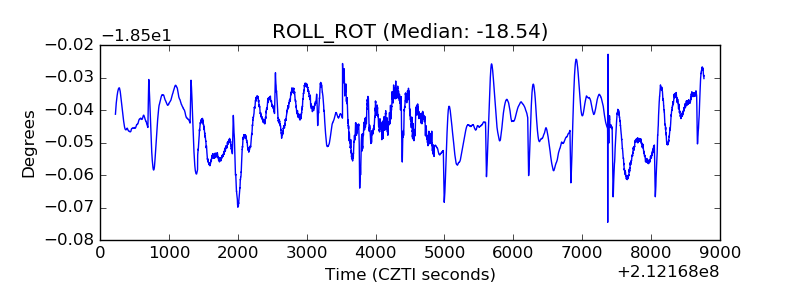 |
| _Roll_DEC | 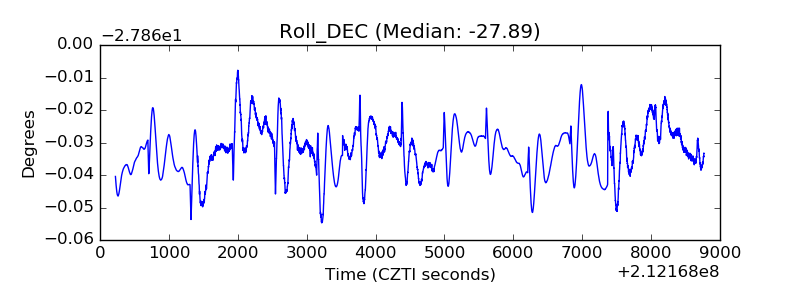 |
| _Roll_RA | 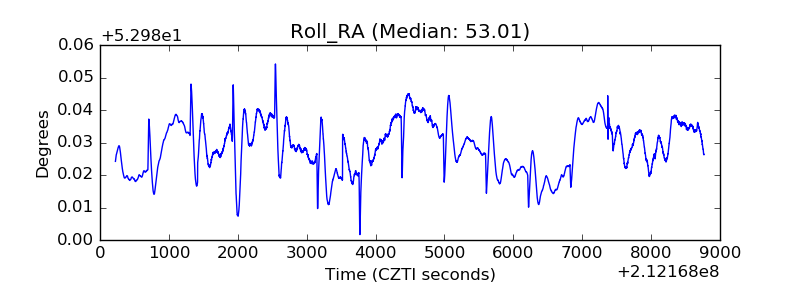 |
| Veto Counter | 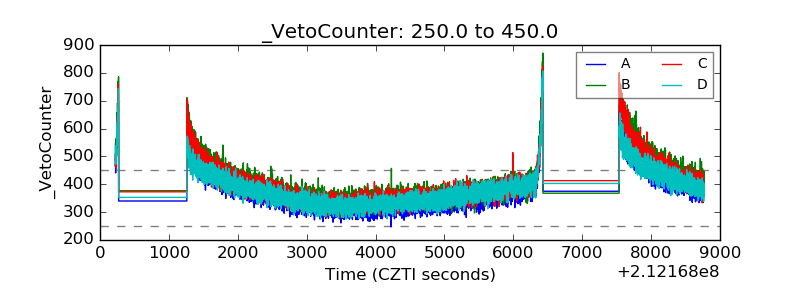 |