| Param | Original file | Final file |
|---|---|---|
| Filename | modeM0/AS1G05_240T01_9000000674_05325cztM0_level2.evt | modeM0/AS1G05_240T01_9000000674_05325cztM0_level2_quad_clean.evt |
| Size (bytes) | 418,953,600 | 88,963,200 |
| Size | 399.5 MB | 84.8 MB |
| Events in quadrant A | 3,004,519 | 571,468 |
| Events in quadrant B | 3,116,589 | 591,826 |
| Events in quadrant C | 2,910,432 | 567,402 |
| Events in quadrant D | 3,233,875 | 529,538 |
| Mode M0 | |||
|---|---|---|---|
| Quadrant | BADHDUFLAG | Total packets | Discarded packets |
| A | 0 | 12931 | 3 |
| B | 0 | 13364 | 2 |
| C | 0 | 12766 | 2 |
| D | 0 | 13986 | 2 |
| Mode SS | |||
|---|---|---|---|
| Quadrant | BADHDUFLAG | Total packets | Discarded packets |
| A | 0 | 128 | 0 |
| B | 0 | 128 | 0 |
| C | 0 | 128 | 0 |
| D | 0 | 128 | 0 |
| Mode M9 | |||
|---|---|---|---|
| Quadrant | BADHDUFLAG | Total packets | Discarded packets |
| A | 0 | 14 | 0 |
| B | 0 | 14 | 0 |
| C | 0 | 14 | 0 |
| D | 0 | 15 | 0 |
| Quadrant | Total seconds | Saturated seconds | Saturation percentage |
|---|---|---|---|
| A | 6209 | 27 | 0.434853% |
| B | 6209 | 48 | 0.773071% |
| C | 6209 | 11 | 0.177162% |
| D | 6209 | 70 | 1.127396% |
Noise dominated data is calculated using 1-second bins in cleaned event files. If a bin has >2000 counts, and if more than 50% of those come from <1% of pixels, then it is considered to be noise-dominated and hence unusable.
| Quadrant | # 1 sec bins | Bins with >0 counts | Bins with >2000 counts | High rate bins dominated by noise | Noise dominated (total time) | Noise dominated (detector-on time) | Marked lightcurve |
|---|---|---|---|---|---|---|---|
| A | 7529 | 6210 | 0 | 0 | 0.00% | 0.00% | 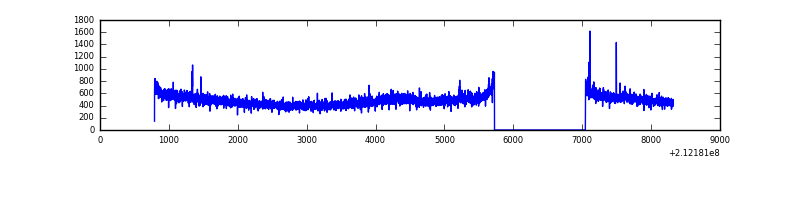 |
| B | 7529 | 6210 | 7 | 7 | 0.09% | 0.11% | 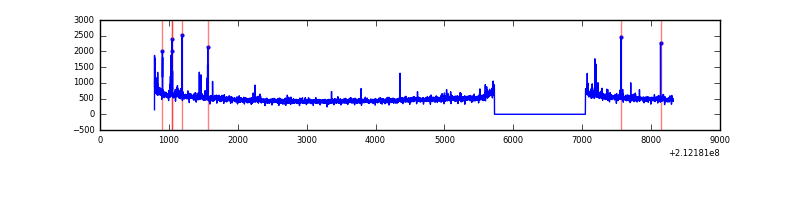 |
| C | 7529 | 6210 | 0 | 0 | 0.00% | 0.00% | 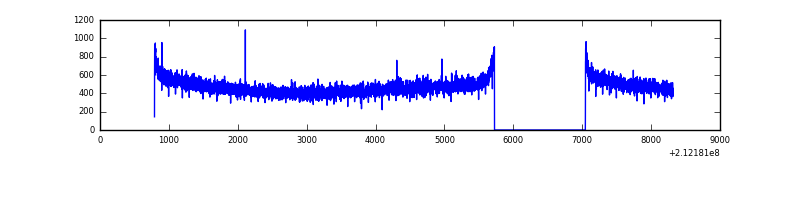 |
| D | 7529 | 6210 | 66 | 66 | 0.88% | 1.06% | 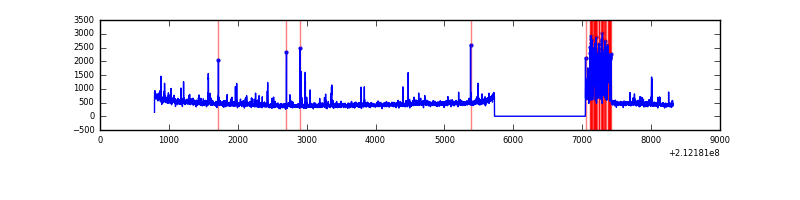 |
Top three noisy pixels from each quadrant. If the there are fewer than three noisy pixels in the level2.evt file, extra rows are filled as -1
| Pixel properties | Quadrant properties | ||||||
|---|---|---|---|---|---|---|---|
| Quadrant | DetID | PixID | Counts | Sigma | Mean | Median | Sigma |
| A | 14 | 111 | 72020 | 464.97 | 754 | 738 | 153.3 |
| A | 13 | 251 | 15531 | 96.49 | 754 | 738 | 153.3 |
| A | 0 | 50 | 12950 | 79.66 | 754 | 738 | 153.3 |
| B | 10 | 16 | 37059 | 250.86 | 773 | 757 | 144.7 |
| B | 15 | 54 | 24867 | 166.61 | 773 | 757 | 144.7 |
| B | 15 | 204 | 21563 | 143.78 | 773 | 757 | 144.7 |
| C | 1 | 16 | 22683 | 128.97 | 738 | 743 | 170.1 |
| C | 13 | 61 | 5966 | 30.7 | 738 | 743 | 170.1 |
| C | 14 | 67 | 5713 | 29.22 | 738 | 743 | 170.1 |
| D | 2 | 16 | 332878 | 1865.49 | 726 | 706 | 178.1 |
| D | 2 | 234 | 44510 | 246.01 | 726 | 706 | 178.1 |
| D | 2 | 14 | 42889 | 236.9 | 726 | 706 | 178.1 |
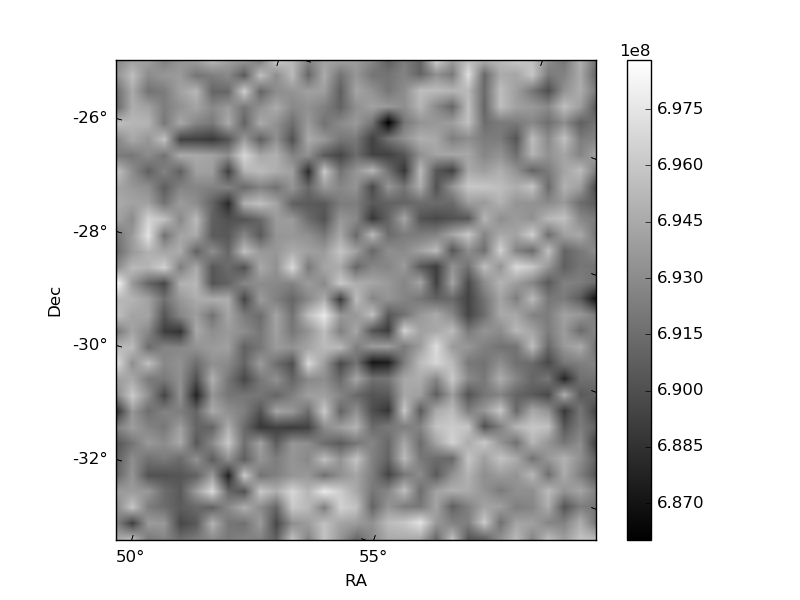
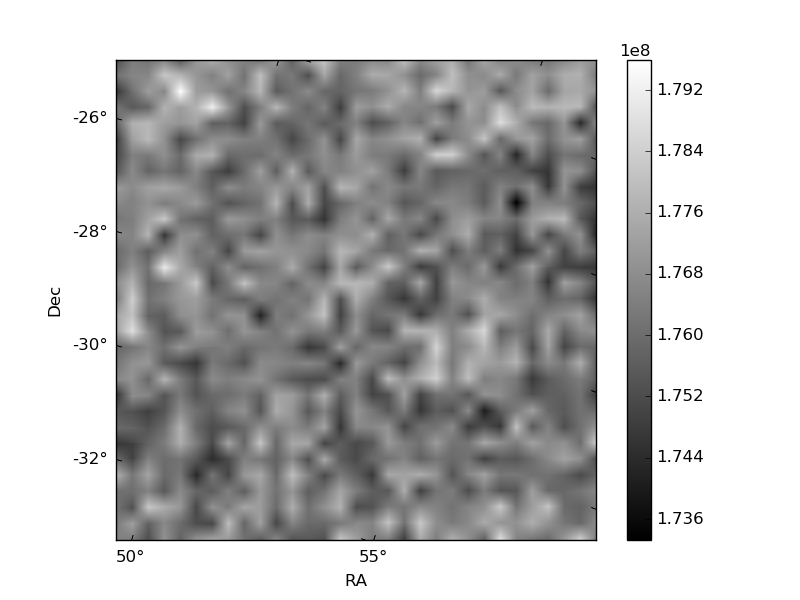
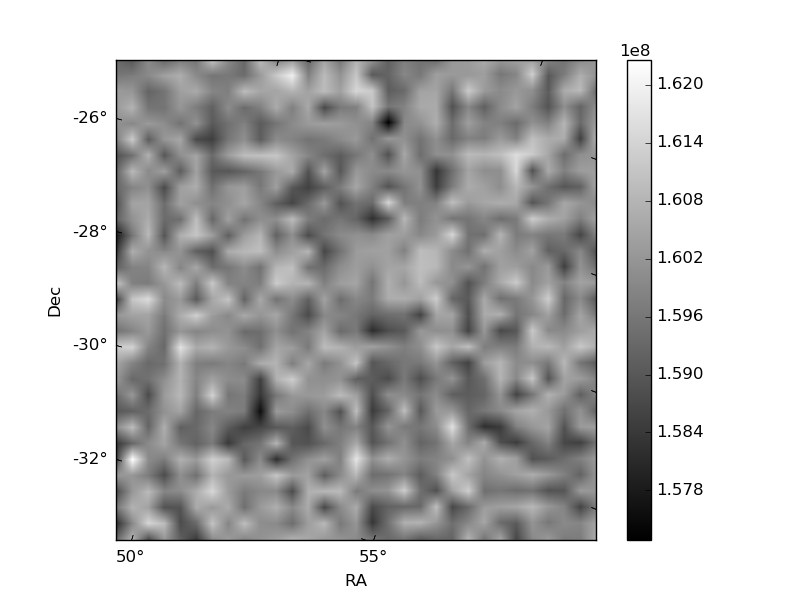
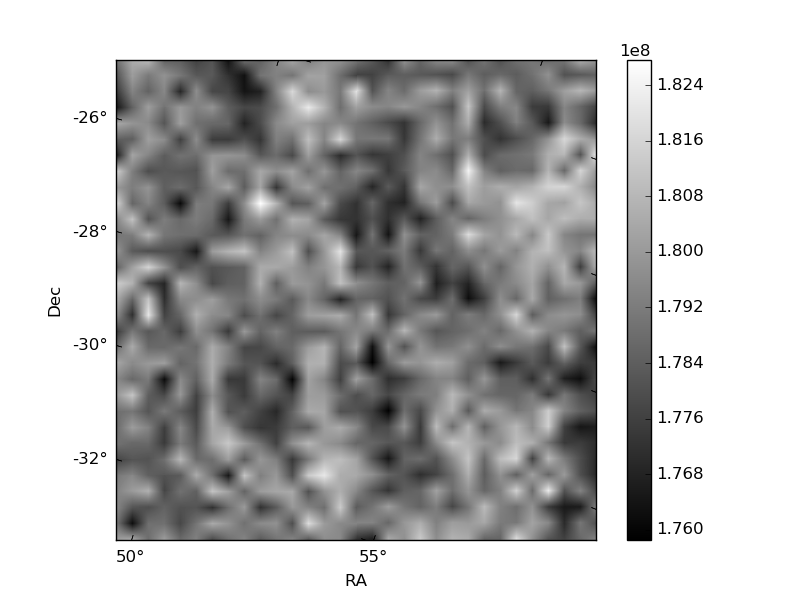
Histogram calculated using DETX and DETY for each event in the final _common_clean file
| Quadrant A | 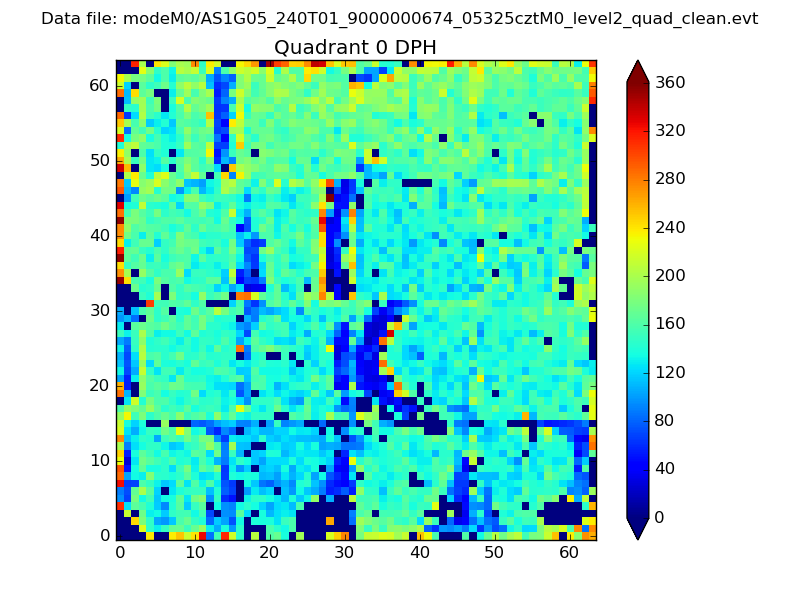 |
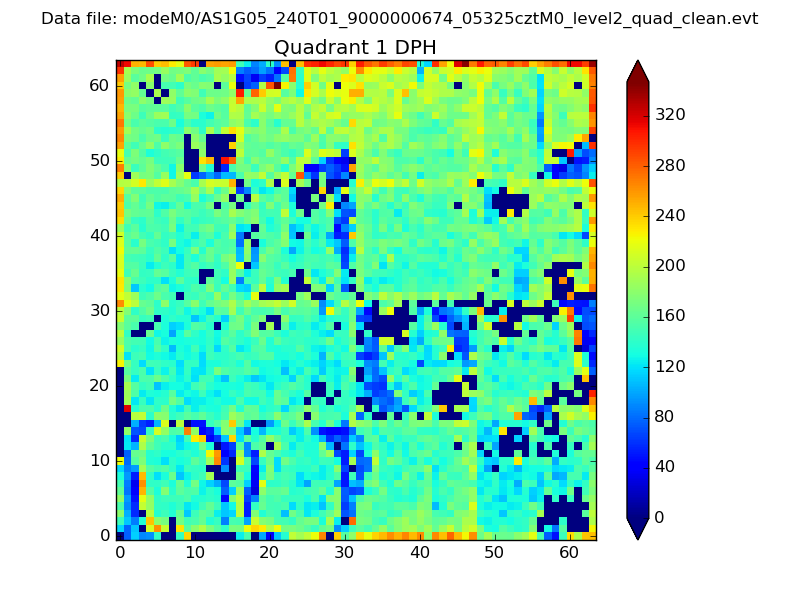 |
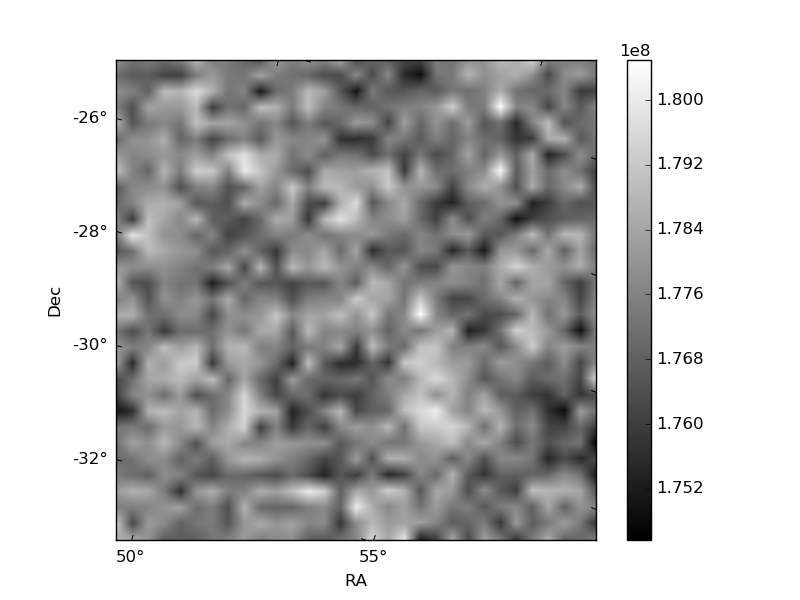
Quadrant B |
|---|---|---|---|
| Quadrant D | 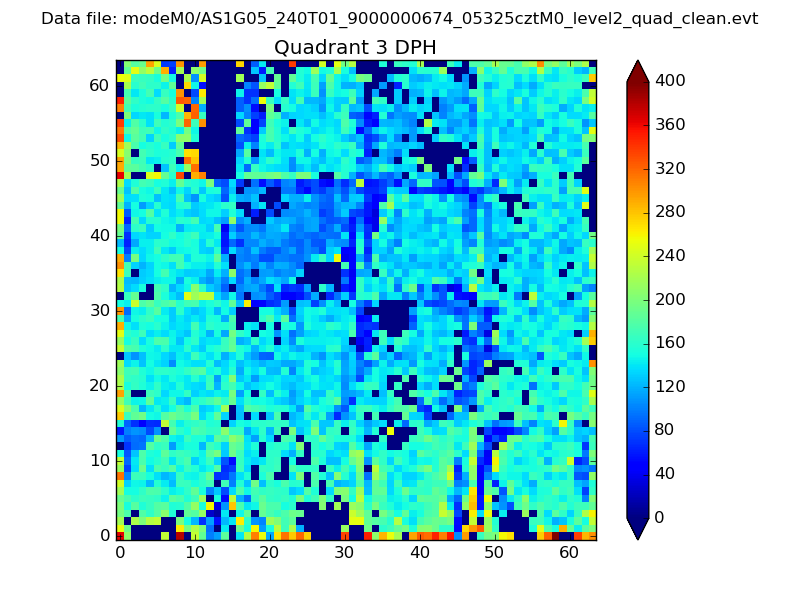 |
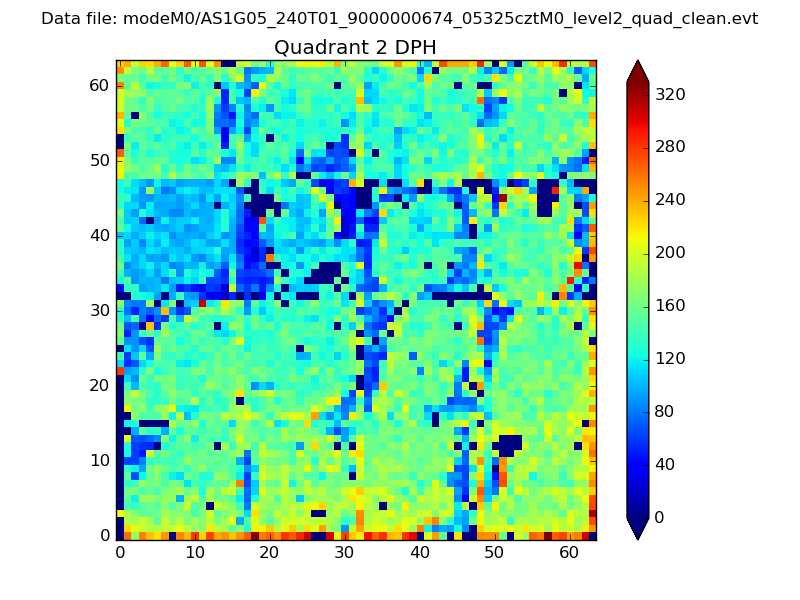 |
Quadrant C |
| Plot type | Count rate plots | Images |
|---|---|---|
| Comparison with Poisson distribution Blue bars denote a histogram of data divided into 1 sec bins. Red curve is a Poisson curve with rate = median count rate of data. |
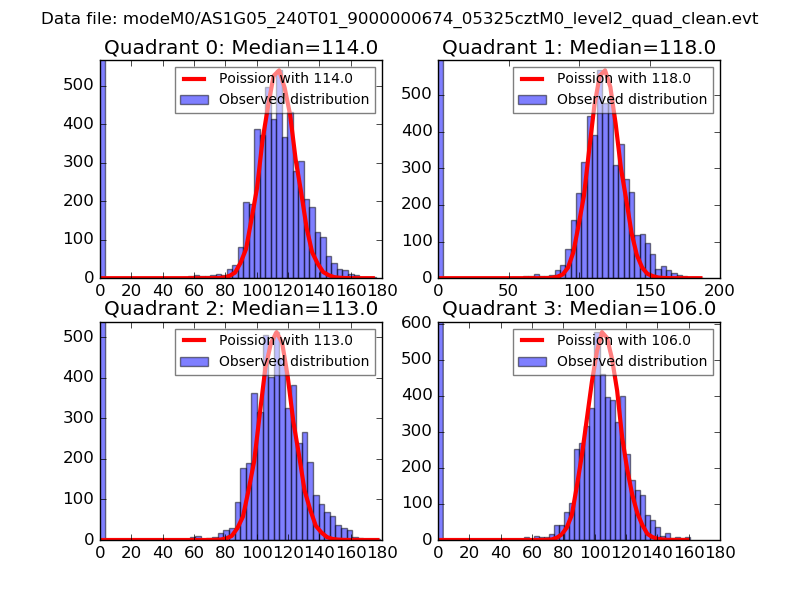 |
 |
| Quadrant-wise count rates Data is divided into 100 sec bins |
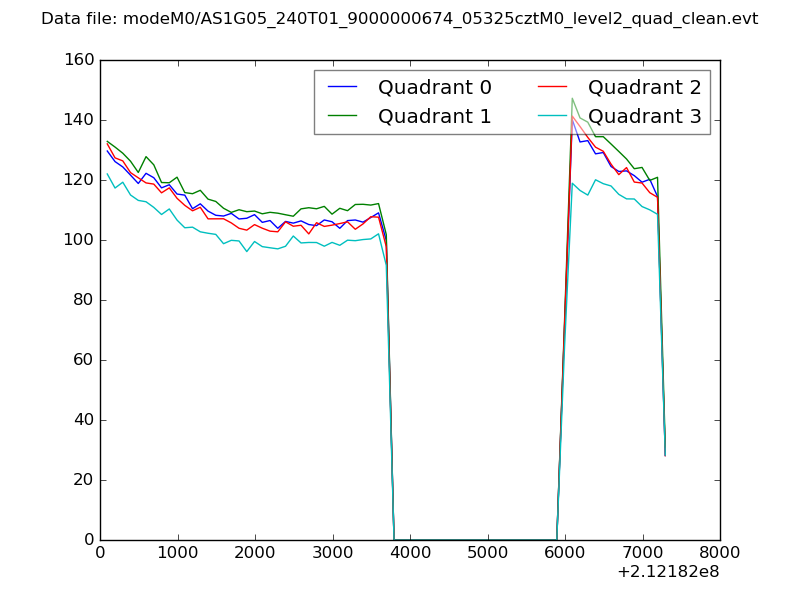 |
|
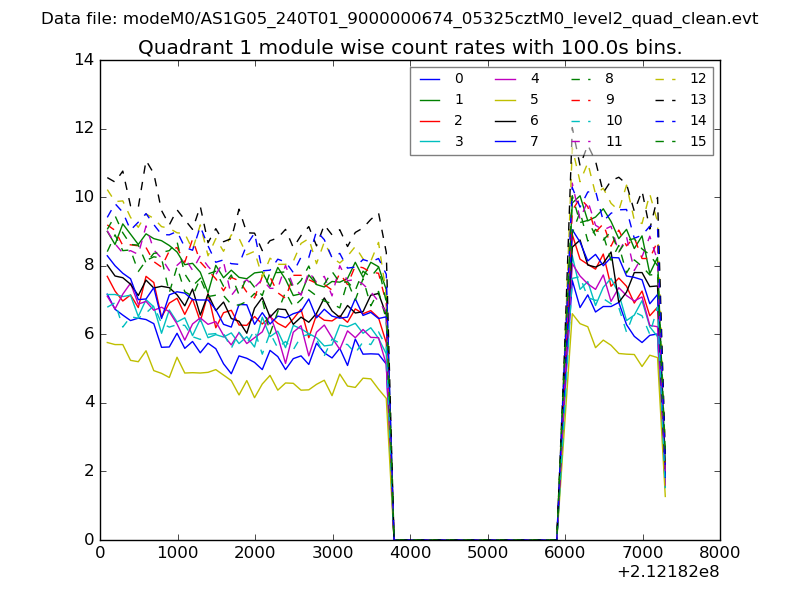
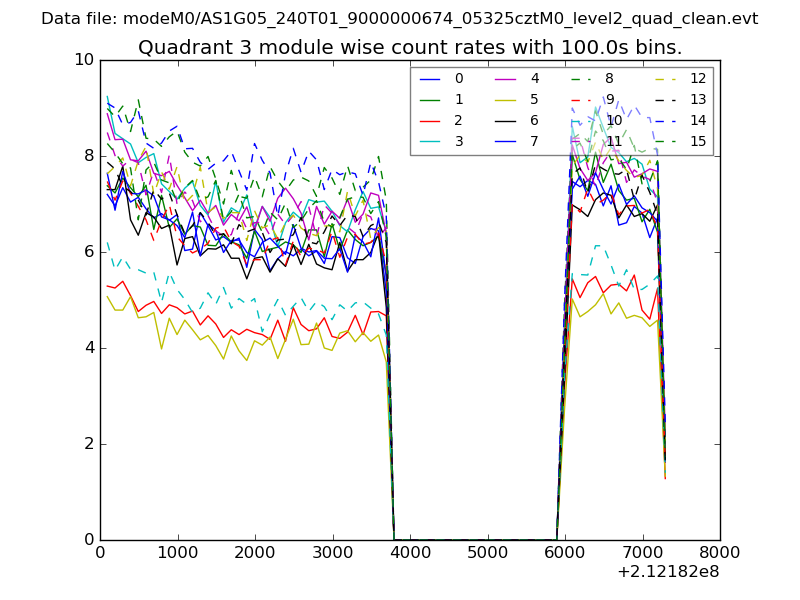
| Module-wise count rates for Quadrant A Data is divided into 100 sec bins |
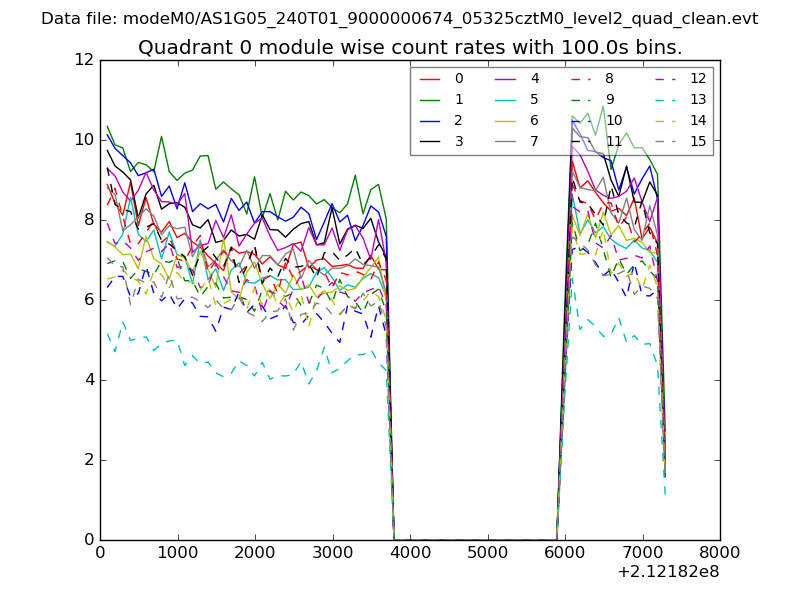 |
 |
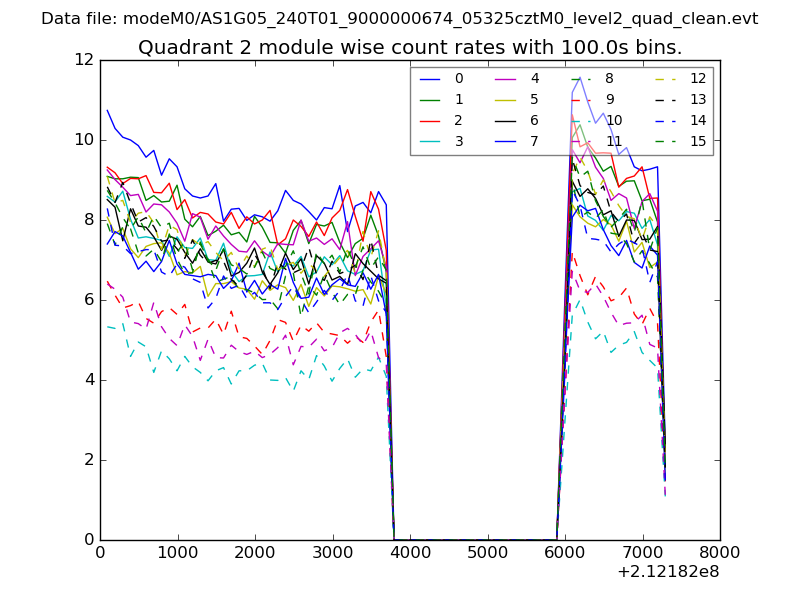
| Module-wise count rates for Quadrant B Data is divided into 100 sec bins |
 |
 |
| Module-wise count rates for Quadrant C Data is divided into 100 sec bins |
 |
 |
| Module-wise count rates for Quadrant D Data is divided into 100 sec bins |
 |
 |
| Parameter | Plot |
|---|---|
| CZT HV Monitor | 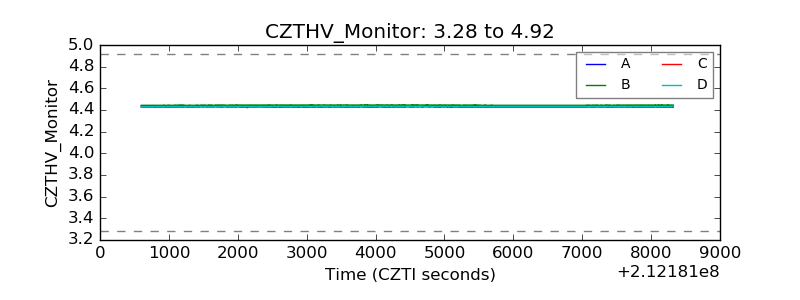 |
| D_VDD | 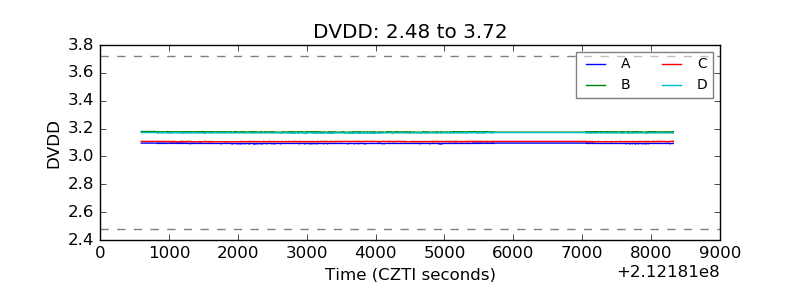 |
| Temperature 1 | 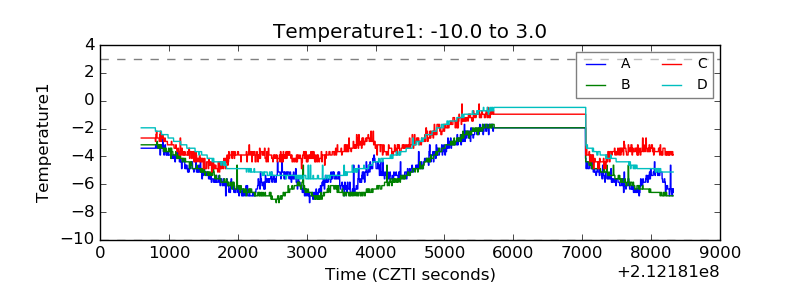 |
| Veto HV Monitor | 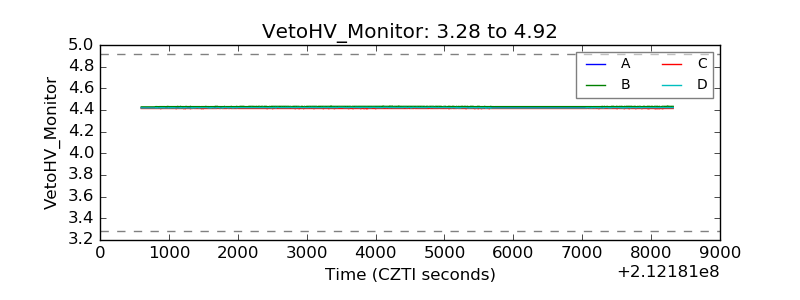 |
| Veto LLD | 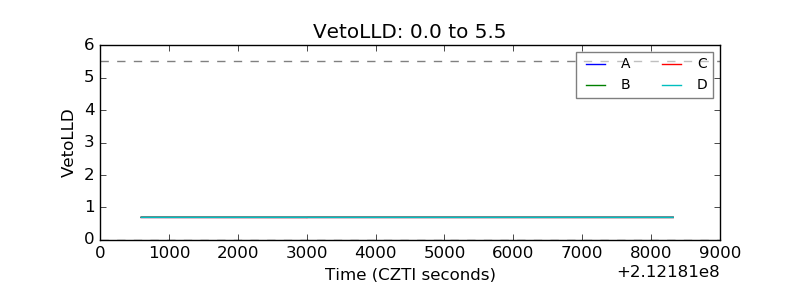 |
| Alpha Counter | 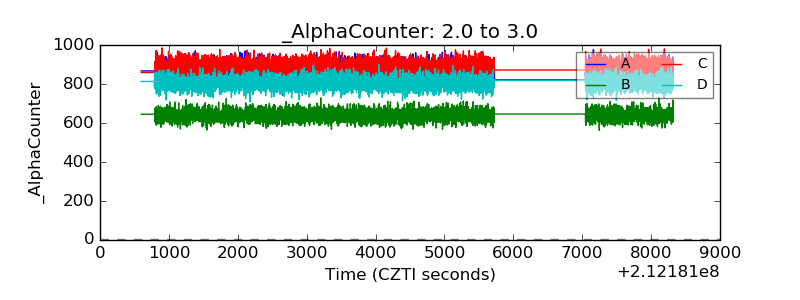 |
| _CPM_Rate | 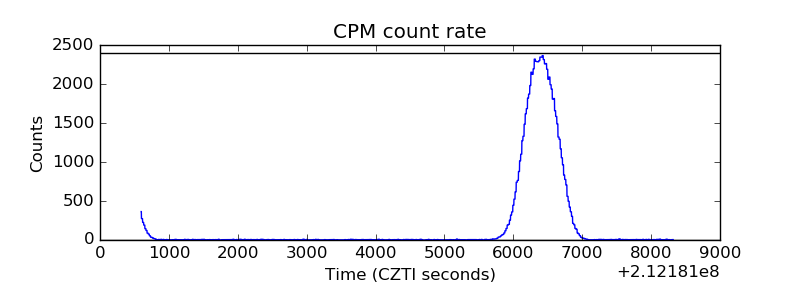 |
| CZT Counter | 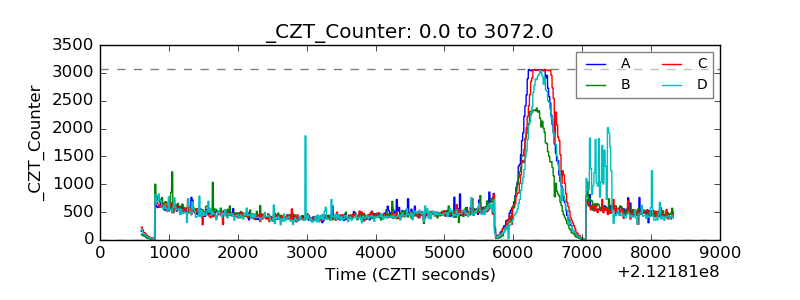 |
| +2.5 Volts monitor |  |
| +5 Volts monitor |  |
| _ROLL_ROT | 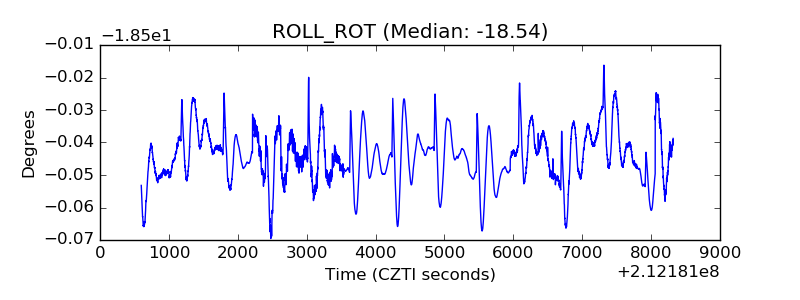 |
| _Roll_DEC | 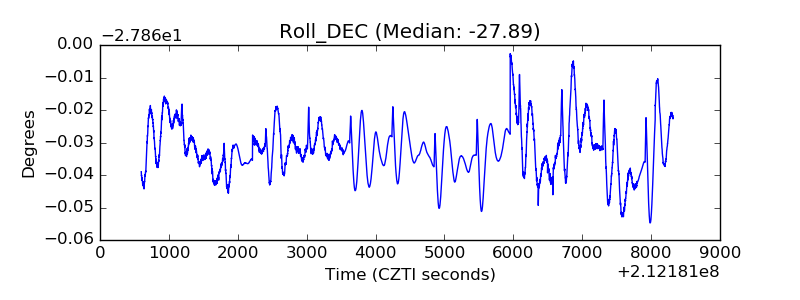 |
| _Roll_RA | 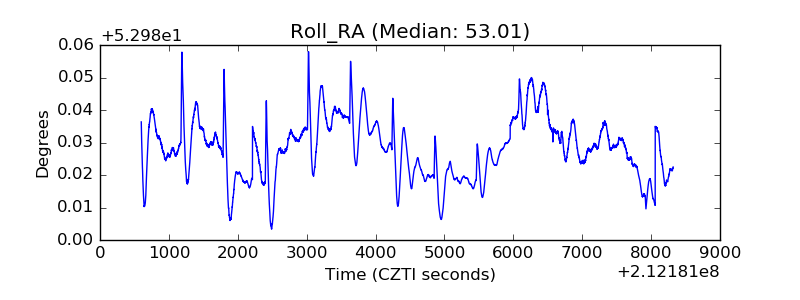 |
| Veto Counter | 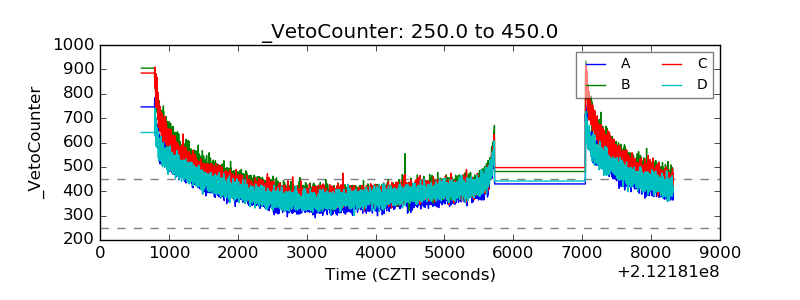 |