| Param | Original file | Final file |
|---|---|---|
| Filename | modeM0/AS1G05_240T01_9000000674_05326cztM0_level2.evt | modeM0/AS1G05_240T01_9000000674_05326cztM0_level2_quad_clean.evt |
| Size (bytes) | 431,222,400 | 88,297,920 |
| Size | 411.2 MB | 84.2 MB |
| Events in quadrant A | 2,931,623 | 566,355 |
| Events in quadrant B | 3,092,334 | 588,392 |
| Events in quadrant C | 2,916,297 | 563,995 |
| Events in quadrant D | 3,699,596 | 524,224 |
| Mode M0 | |||
|---|---|---|---|
| Quadrant | BADHDUFLAG | Total packets | Discarded packets |
| A | 0 | 12814 | 3 |
| B | 0 | 13187 | 2 |
| C | 0 | 12709 | 2 |
| D | 0 | 15383 | 2 |
| Mode SS | |||
|---|---|---|---|
| Quadrant | BADHDUFLAG | Total packets | Discarded packets |
| A | 0 | 126 | 0 |
| B | 0 | 126 | 0 |
| C | 0 | 126 | 0 |
| D | 0 | 126 | 0 |
| Mode M9 | |||
|---|---|---|---|
| Quadrant | BADHDUFLAG | Total packets | Discarded packets |
| A | 0 | 24 | 0 |
| B | 0 | 24 | 0 |
| C | 0 | 24 | 0 |
| D | 0 | 25 | 0 |
| Quadrant | Total seconds | Saturated seconds | Saturation percentage |
|---|---|---|---|
| A | 6173 | 33 | 0.534586% |
| B | 6173 | 43 | 0.696582% |
| C | 6173 | 15 | 0.242994% |
| D | 6173 | 135 | 2.186943% |
Noise dominated data is calculated using 1-second bins in cleaned event files. If a bin has >2000 counts, and if more than 50% of those come from <1% of pixels, then it is considered to be noise-dominated and hence unusable.
| Quadrant | # 1 sec bins | Bins with >0 counts | Bins with >2000 counts | High rate bins dominated by noise | Noise dominated (total time) | Noise dominated (detector-on time) | Marked lightcurve |
|---|---|---|---|---|---|---|---|
| A | 7518 | 6174 | 0 | 0 | 0.00% | 0.00% | 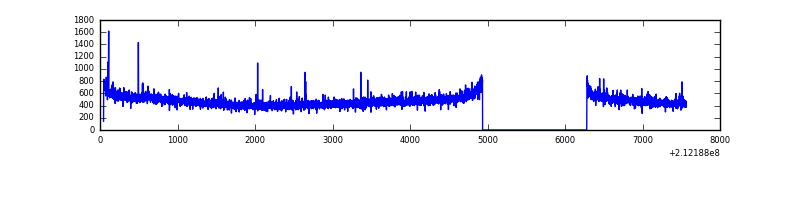 |
| B | 7518 | 6174 | 4 | 4 | 0.05% | 0.06% | 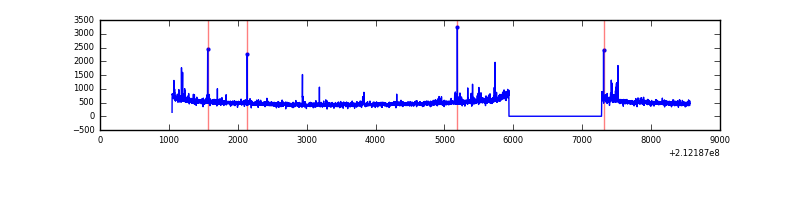 |
| C | 7518 | 6174 | 0 | 0 | 0.00% | 0.00% | 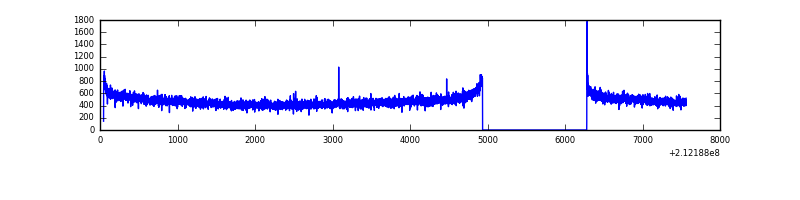 |
| D | 7518 | 6174 | 141 | 141 | 1.88% | 2.28% | 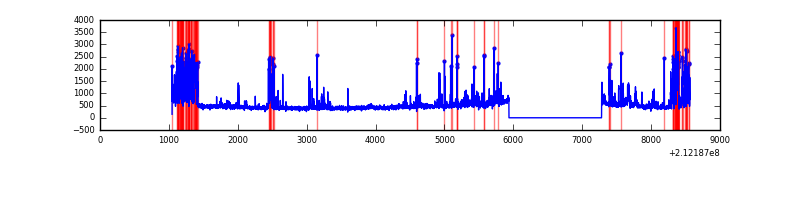 |
Top three noisy pixels from each quadrant. If the there are fewer than three noisy pixels in the level2.evt file, extra rows are filled as -1
| Pixel properties | Quadrant properties | ||||||
|---|---|---|---|---|---|---|---|
| Quadrant | DetID | PixID | Counts | Sigma | Mean | Median | Sigma |
| A | 14 | 111 | 33710 | 218.73 | 745 | 731 | 150.8 |
| A | 13 | 251 | 18269 | 116.32 | 745 | 731 | 150.8 |
| A | 0 | 50 | 8999 | 54.84 | 745 | 731 | 150.8 |
| B | 15 | 204 | 26500 | 179.1 | 767 | 750 | 143.8 |
| B | 4 | 80 | 21235 | 142.48 | 767 | 750 | 143.8 |
| B | 15 | 54 | 17452 | 116.17 | 767 | 750 | 143.8 |
| C | 1 | 16 | 22111 | 126.42 | 735 | 742 | 169.0 |
| C | 14 | 67 | 15006 | 84.39 | 735 | 742 | 169.0 |
| C | 13 | 61 | 6078 | 31.57 | 735 | 742 | 169.0 |
| D | 2 | 16 | 405302 | 2278.63 | 719 | 697 | 177.6 |
| D | 7 | 203 | 315473 | 1772.74 | 719 | 697 | 177.6 |
| D | 2 | 234 | 143220 | 802.65 | 719 | 697 | 177.6 |
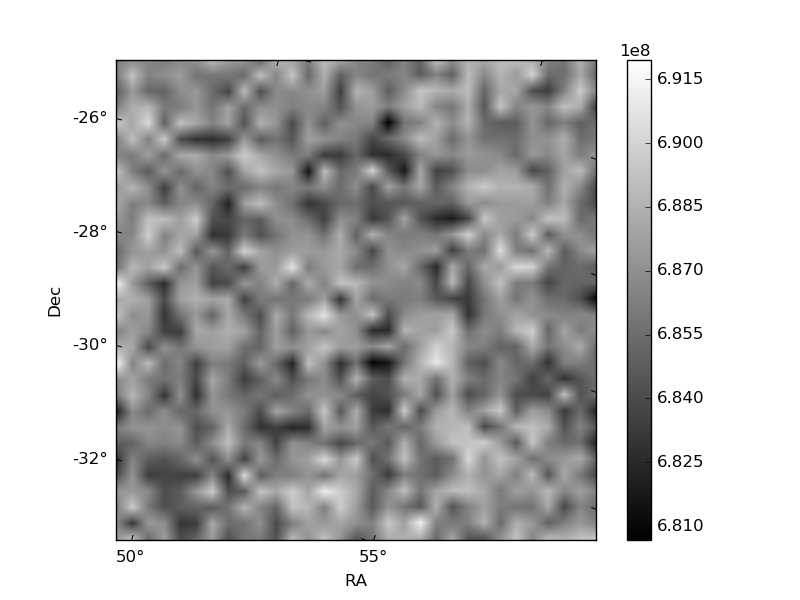
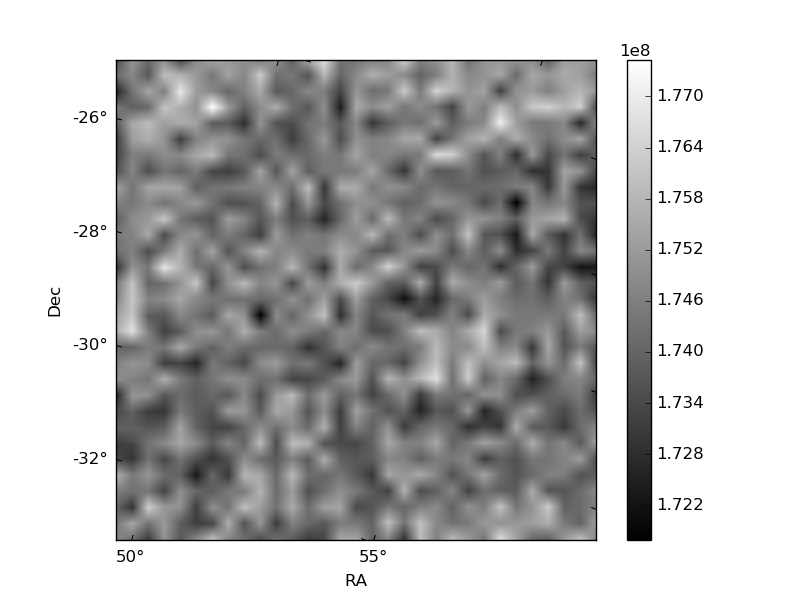
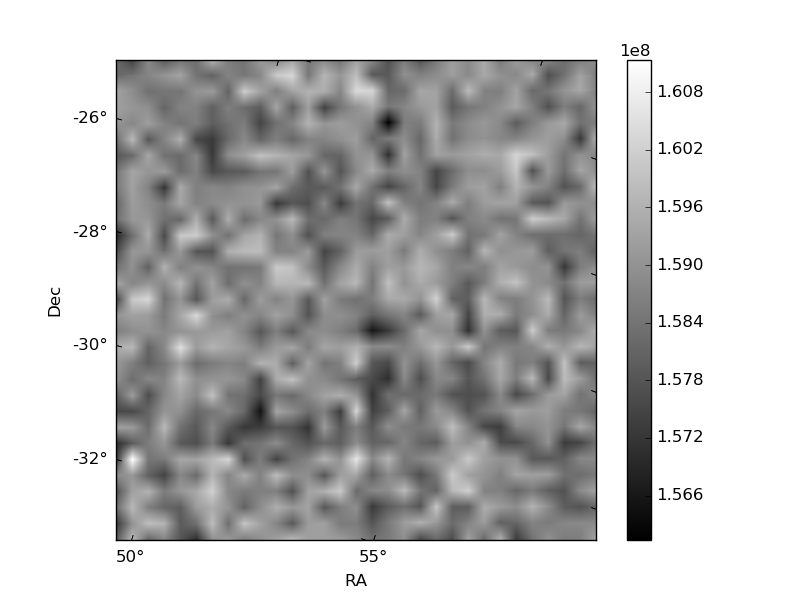
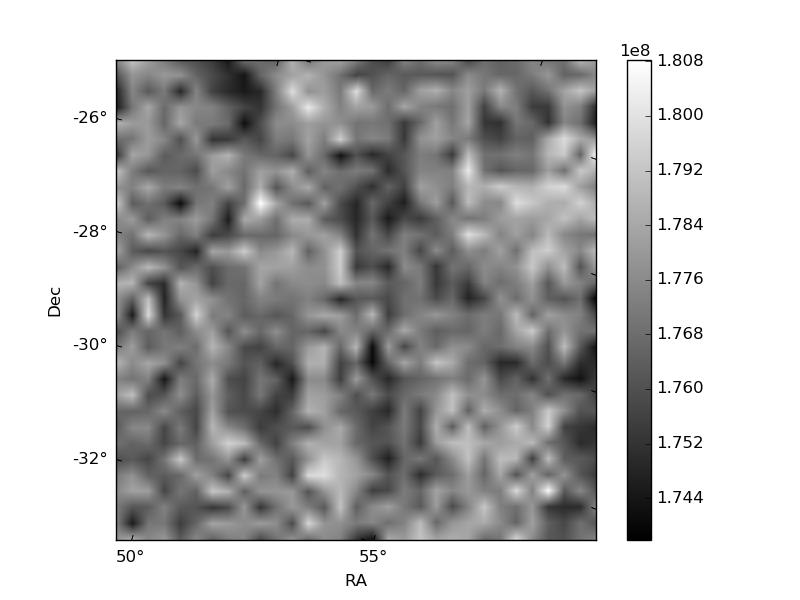
Histogram calculated using DETX and DETY for each event in the final _common_clean file
| Quadrant A | 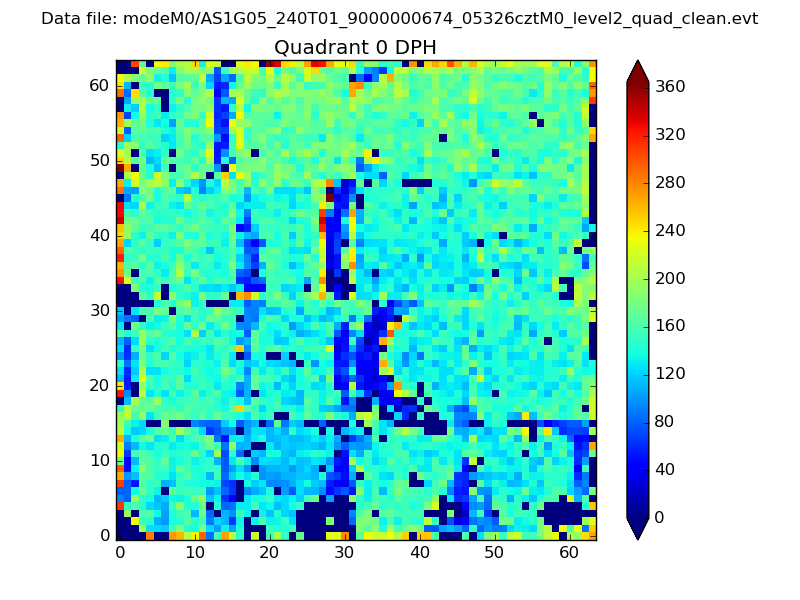 |
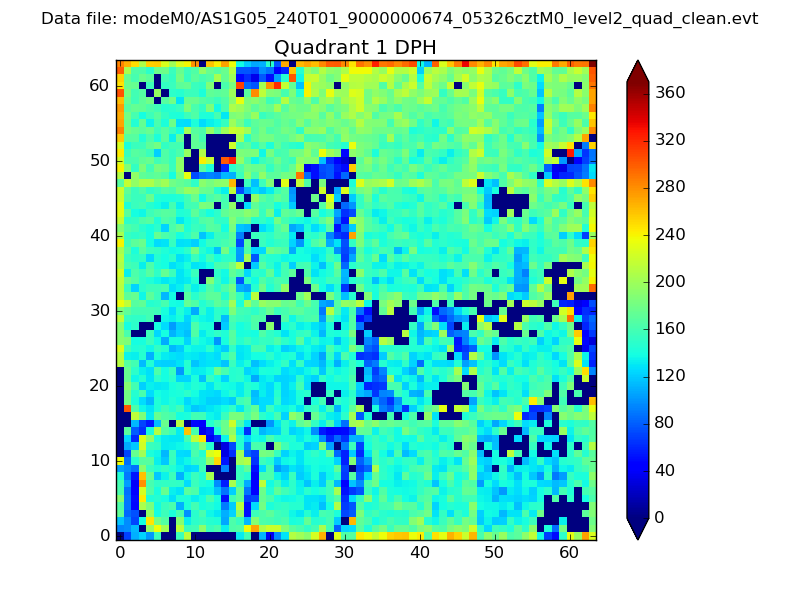 |
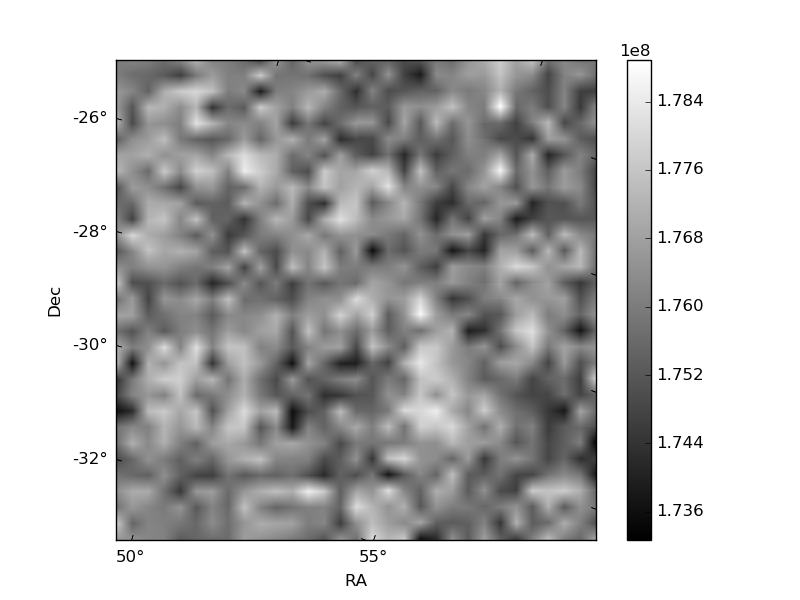
Quadrant B |
|---|---|---|---|
| Quadrant D | 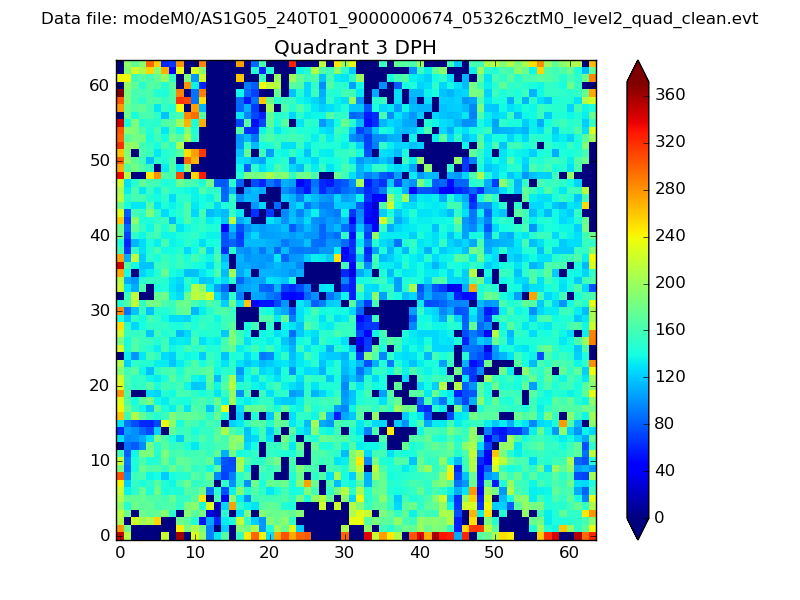 |
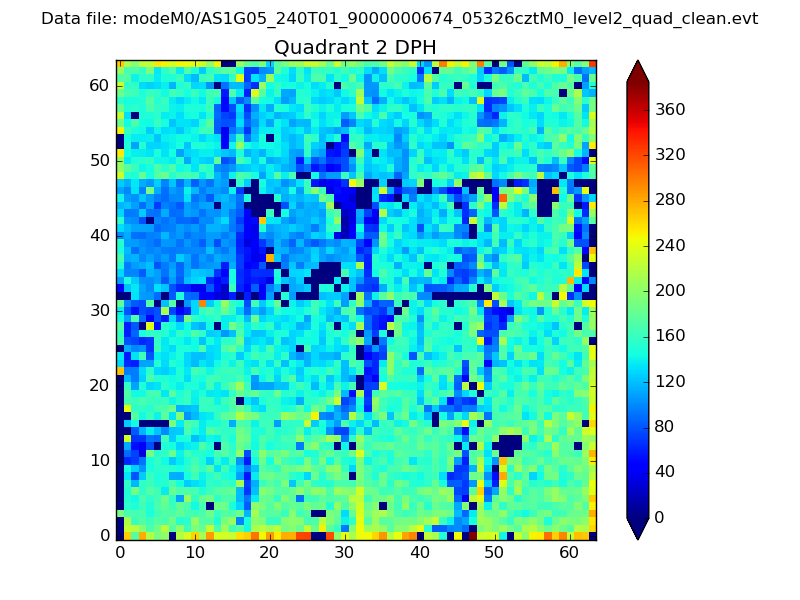 |
Quadrant C |
| Plot type | Count rate plots | Images |
|---|---|---|
| Comparison with Poisson distribution Blue bars denote a histogram of data divided into 1 sec bins. Red curve is a Poisson curve with rate = median count rate of data. |
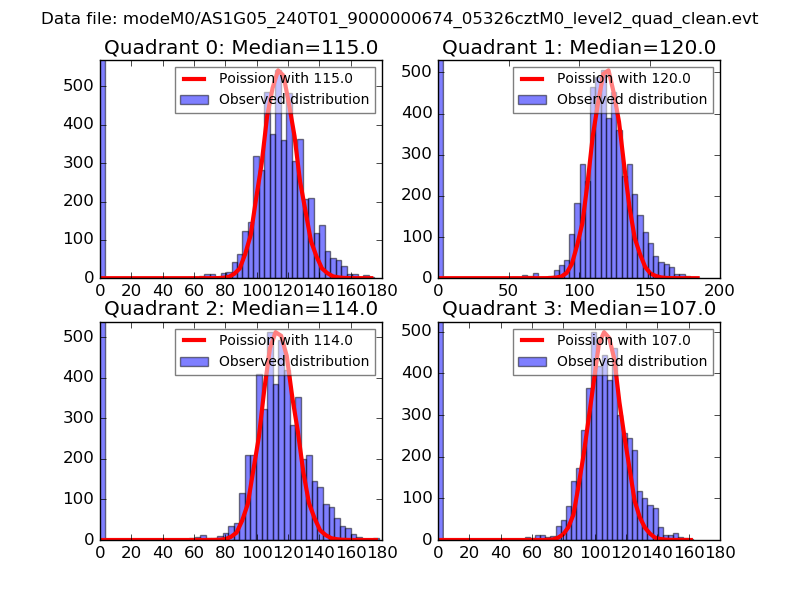 |
 |
| Quadrant-wise count rates Data is divided into 100 sec bins |
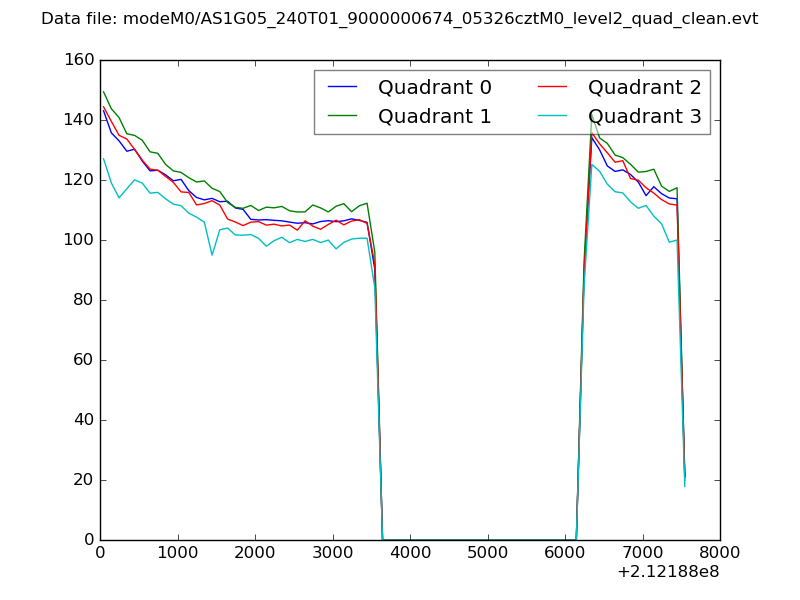 |
|
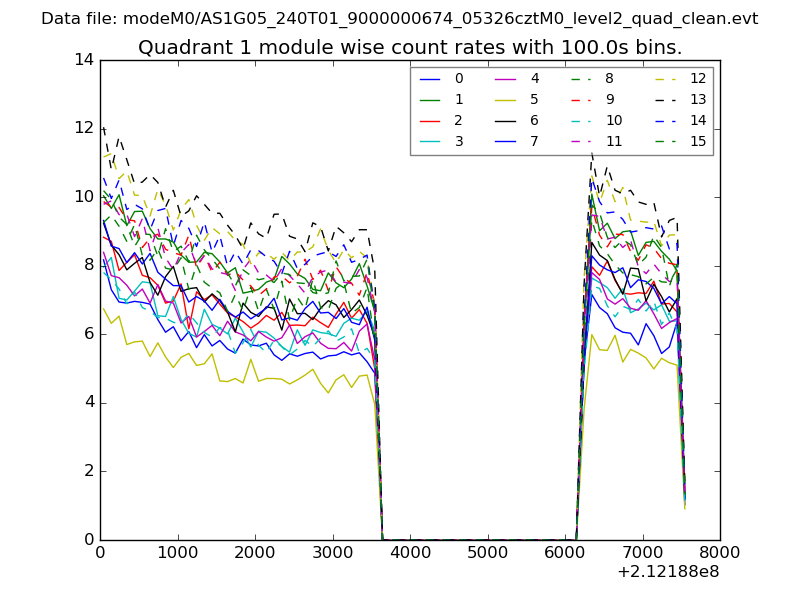
| Module-wise count rates for Quadrant A Data is divided into 100 sec bins |
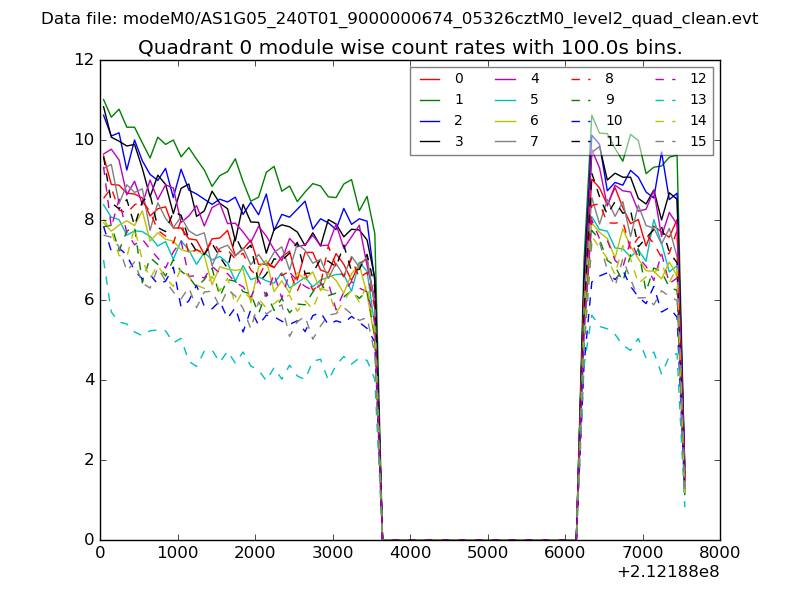 |
 |
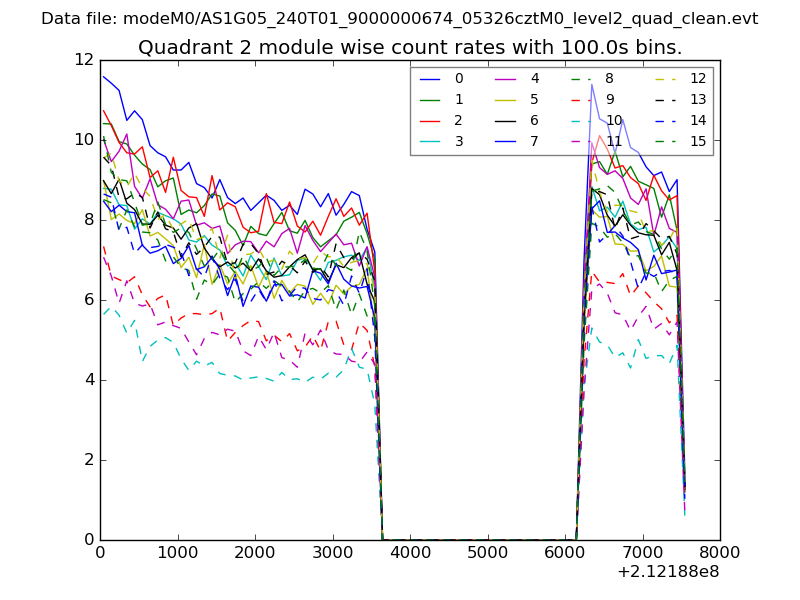
| Module-wise count rates for Quadrant B Data is divided into 100 sec bins |
 |
 |
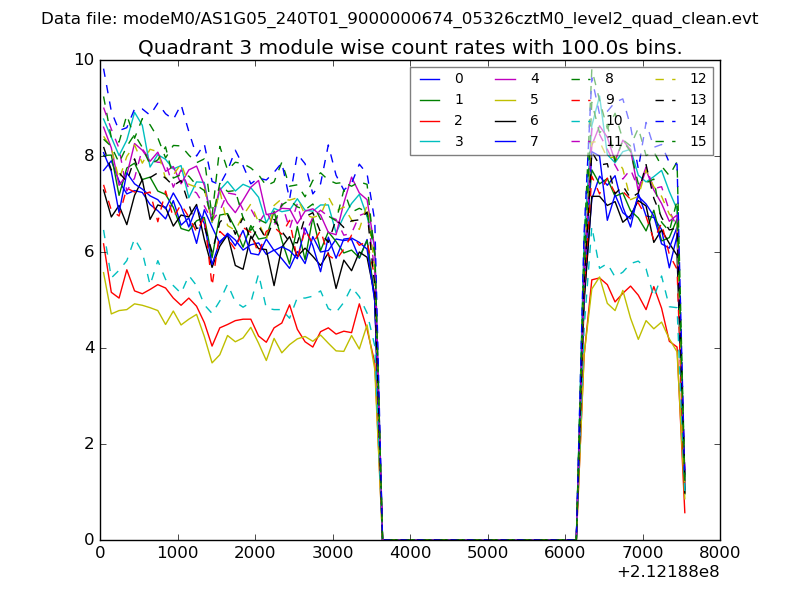
| Module-wise count rates for Quadrant C Data is divided into 100 sec bins |
 |
 |
| Module-wise count rates for Quadrant D Data is divided into 100 sec bins |
 |
 |
| Parameter | Plot |
|---|---|
| CZT HV Monitor | 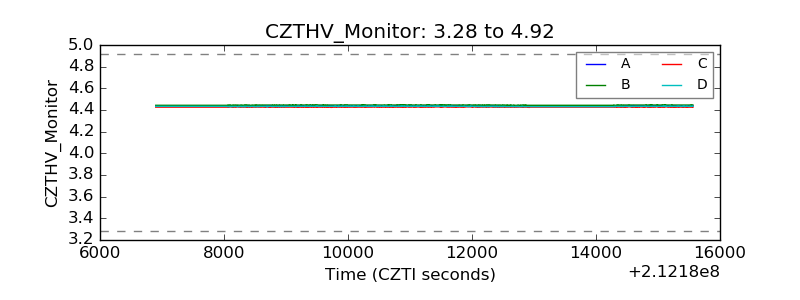 |
| D_VDD |  |
| Temperature 1 | 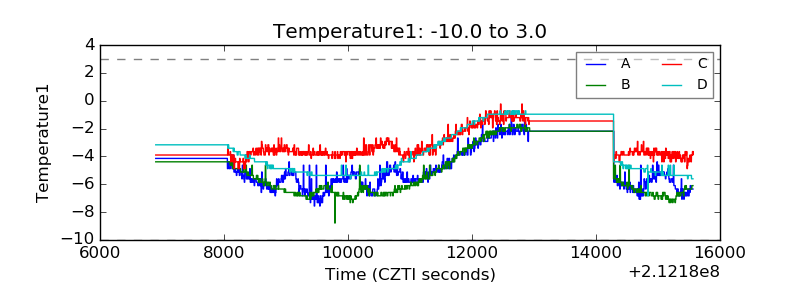 |
| Veto HV Monitor | 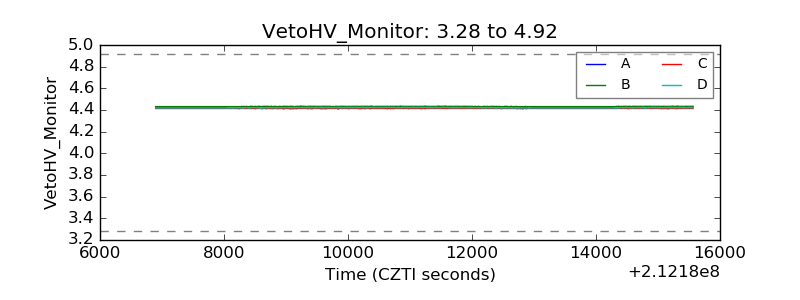 |
| Veto LLD | 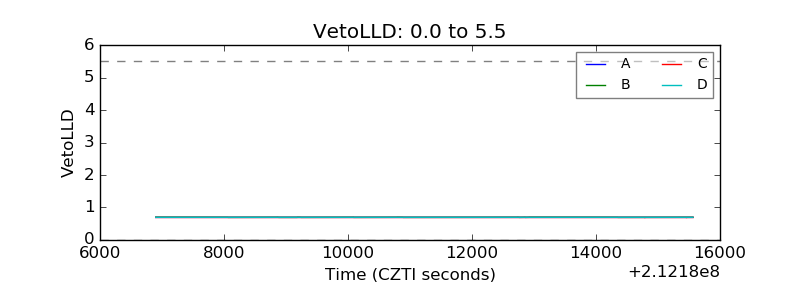 |
| Alpha Counter | 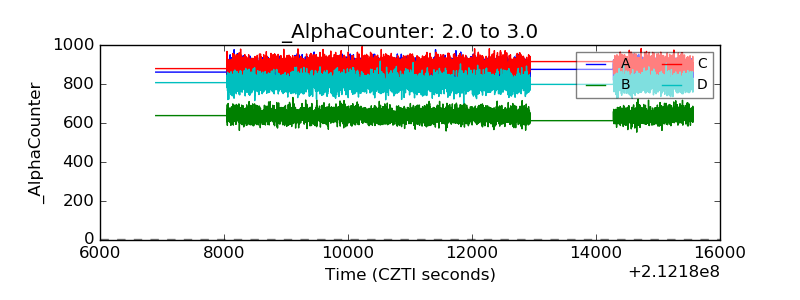 |
| _CPM_Rate | 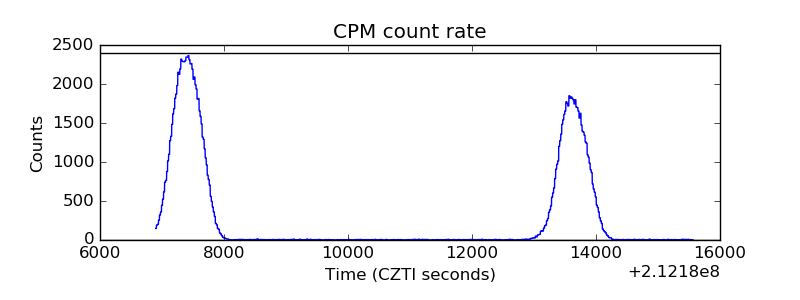 |
| CZT Counter | 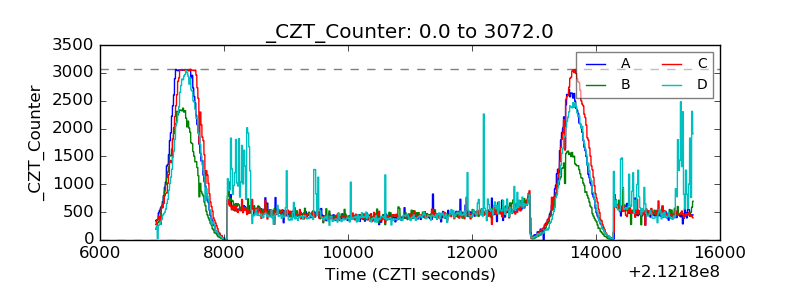 |
| +2.5 Volts monitor |  |
| +5 Volts monitor |  |
| _ROLL_ROT |  |
| _Roll_DEC | 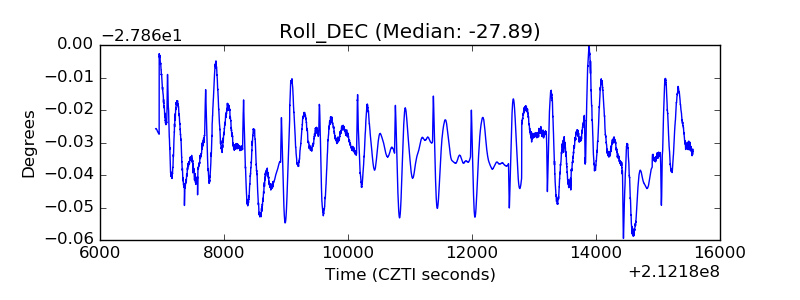 |
| _Roll_RA | 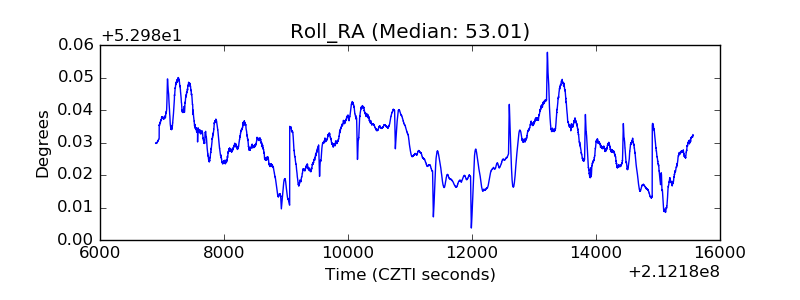 |
| Veto Counter |  |