| Param | Original file | Final file |
|---|---|---|
| Filename | modeM0/AS1G05_240T01_9000000674_05327cztM0_level2.evt | modeM0/AS1G05_240T01_9000000674_05327cztM0_level2_quad_clean.evt |
| Size (bytes) | 445,334,400 | 87,419,520 |
| Size | 424.7 MB | 83.4 MB |
| Events in quadrant A | 3,084,019 | 550,082 |
| Events in quadrant B | 3,216,476 | 569,898 |
| Events in quadrant C | 3,108,182 | 549,719 |
| Events in quadrant D | 3,625,599 | 513,333 |
| Mode M0 | |||
|---|---|---|---|
| Quadrant | BADHDUFLAG | Total packets | Discarded packets |
| A | 0 | 13782 | 3 |
| B | 0 | 13926 | 2 |
| C | 0 | 13687 | 2 |
| D | 0 | 15353 | 2 |
| Mode SS | |||
|---|---|---|---|
| Quadrant | BADHDUFLAG | Total packets | Discarded packets |
| A | 0 | 136 | 0 |
| B | 0 | 136 | 0 |
| C | 0 | 136 | 0 |
| D | 0 | 136 | 0 |
| Mode M9 | |||
|---|---|---|---|
| Quadrant | BADHDUFLAG | Total packets | Discarded packets |
| A | 0 | 16 | 0 |
| B | 0 | 16 | 0 |
| C | 0 | 16 | 0 |
| D | 0 | 17 | 0 |
| Quadrant | Total seconds | Saturated seconds | Saturation percentage |
|---|---|---|---|
| A | 6656 | 29 | 0.435697% |
| B | 6656 | 43 | 0.646034% |
| C | 6656 | 18 | 0.270433% |
| D | 6656 | 50 | 0.751202% |
Noise dominated data is calculated using 1-second bins in cleaned event files. If a bin has >2000 counts, and if more than 50% of those come from <1% of pixels, then it is considered to be noise-dominated and hence unusable.
| Quadrant | # 1 sec bins | Bins with >0 counts | Bins with >2000 counts | High rate bins dominated by noise | Noise dominated (total time) | Noise dominated (detector-on time) | Marked lightcurve |
|---|---|---|---|---|---|---|---|
| A | 7951 | 6657 | 0 | 0 | 0.00% | 0.00% | 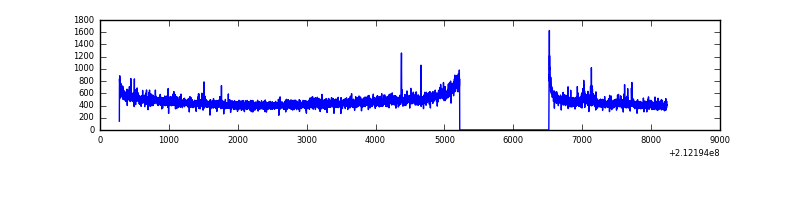 |
| B | 7951 | 6657 | 2 | 2 | 0.03% | 0.03% | 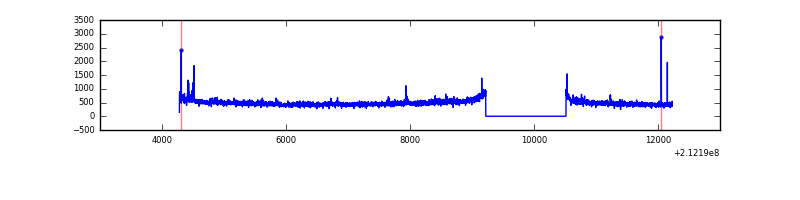 |
| C | 7951 | 6657 | 0 | 0 | 0.00% | 0.00% | 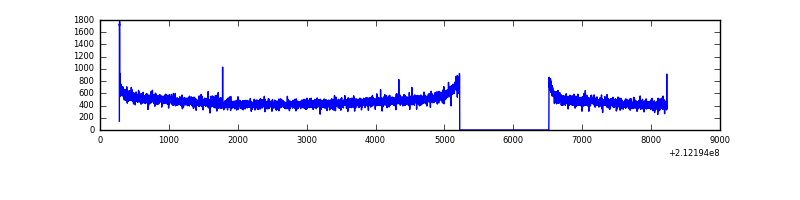 |
| D | 7951 | 6657 | 70 | 70 | 0.88% | 1.05% | 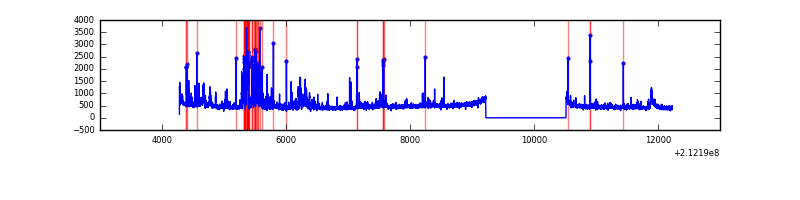 |
Top three noisy pixels from each quadrant. If the there are fewer than three noisy pixels in the level2.evt file, extra rows are filled as -1
| Pixel properties | Quadrant properties | ||||||
|---|---|---|---|---|---|---|---|
| Quadrant | DetID | PixID | Counts | Sigma | Mean | Median | Sigma |
| A | 13 | 251 | 36695 | 226.62 | 786 | 768 | 158.5 |
| A | 0 | 50 | 12400 | 73.37 | 786 | 768 | 158.5 |
| A | 12 | 194 | 7618 | 43.21 | 786 | 768 | 158.5 |
| B | 15 | 204 | 29032 | 186.8 | 805 | 786 | 151.2 |
| B | 4 | 80 | 17894 | 113.14 | 805 | 786 | 151.2 |
| B | 0 | 219 | 16765 | 105.68 | 805 | 786 | 151.2 |
| C | 14 | 67 | 23102 | 123.58 | 778 | 784 | 180.6 |
| C | 1 | 16 | 19592 | 104.14 | 778 | 784 | 180.6 |
| C | 8 | 128 | 17146 | 90.6 | 778 | 784 | 180.6 |
| D | 7 | 203 | 367417 | 1954.03 | 763 | 740 | 187.7 |
| D | 2 | 234 | 147955 | 784.51 | 763 | 740 | 187.7 |
| D | 2 | 136 | 79617 | 420.34 | 763 | 740 | 187.7 |
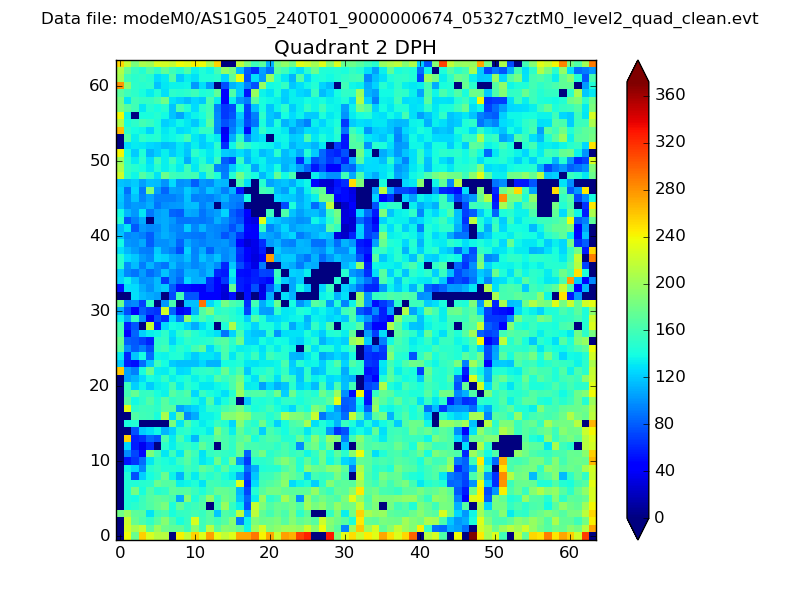
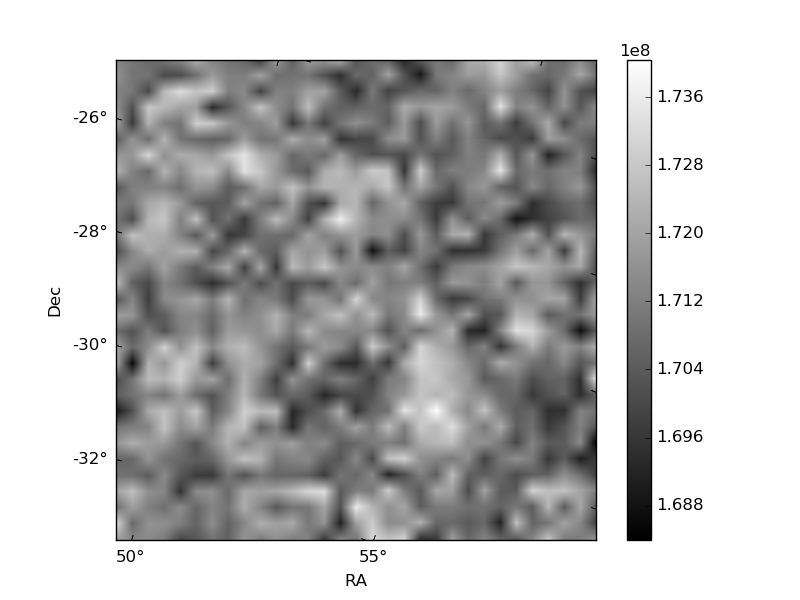
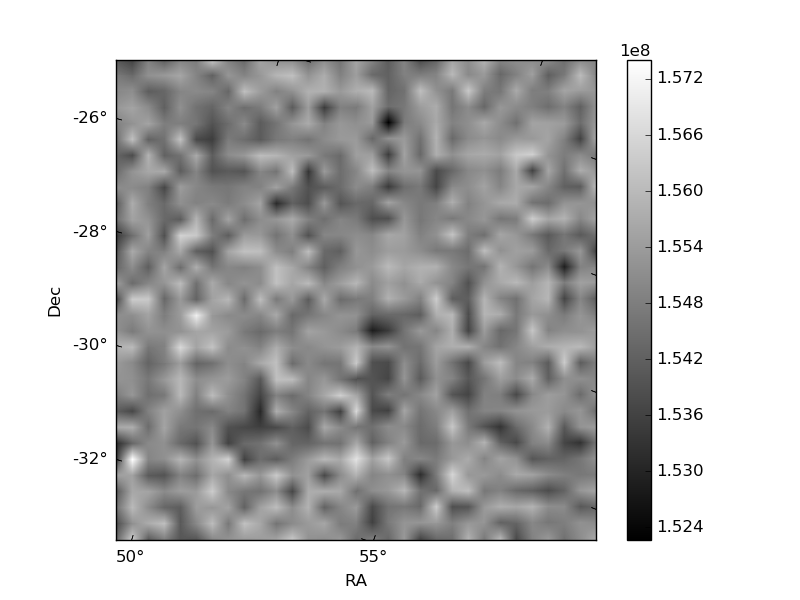
Histogram calculated using DETX and DETY for each event in the final _common_clean file
| Quadrant A | 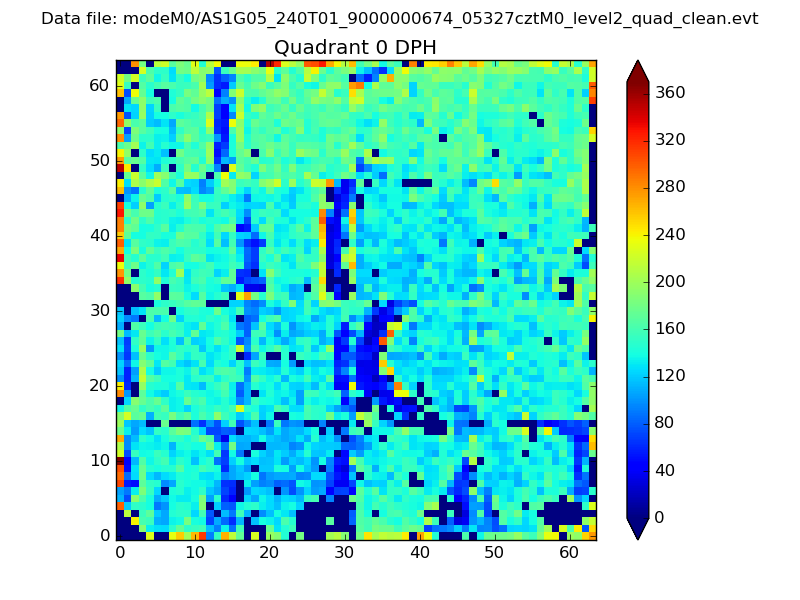 |
 |
Quadrant B |
|---|---|---|---|
| Quadrant D | 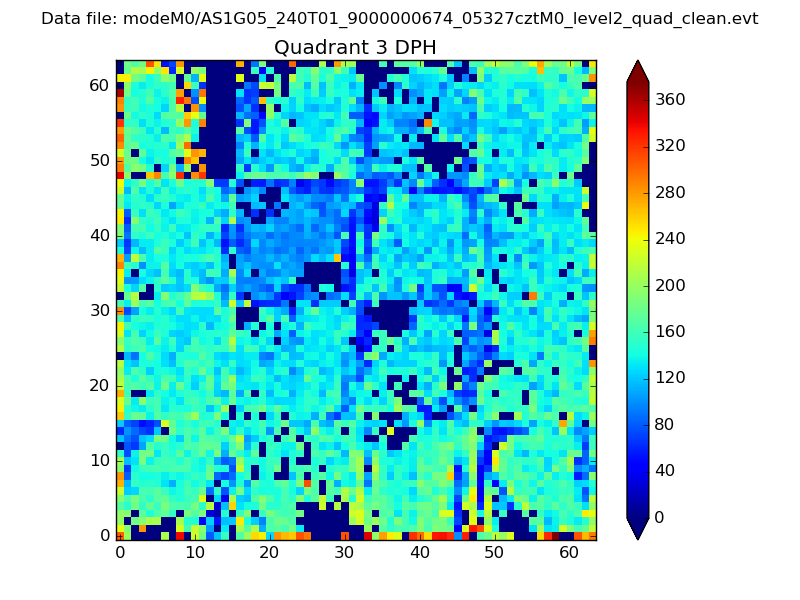 |
 |
Quadrant C |
| Plot type | Count rate plots | Images |
|---|---|---|
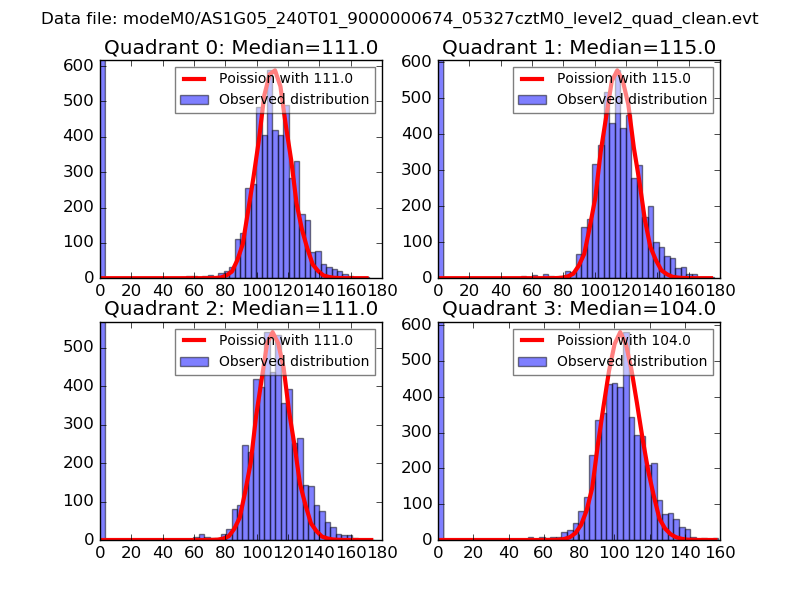
| Comparison with Poisson distribution Blue bars denote a histogram of data divided into 1 sec bins. Red curve is a Poisson curve with rate = median count rate of data. |
 |
 |
| Quadrant-wise count rates Data is divided into 100 sec bins |
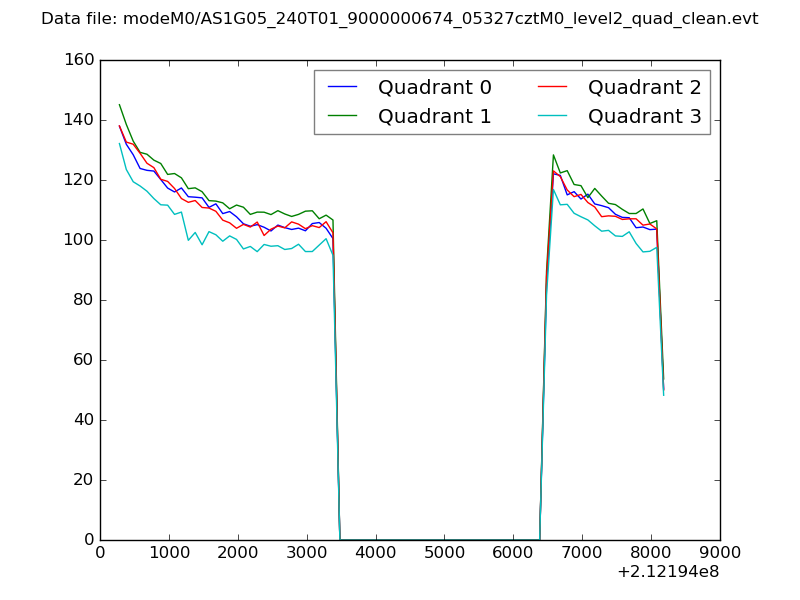 |
|
| Module-wise count rates for Quadrant A Data is divided into 100 sec bins |
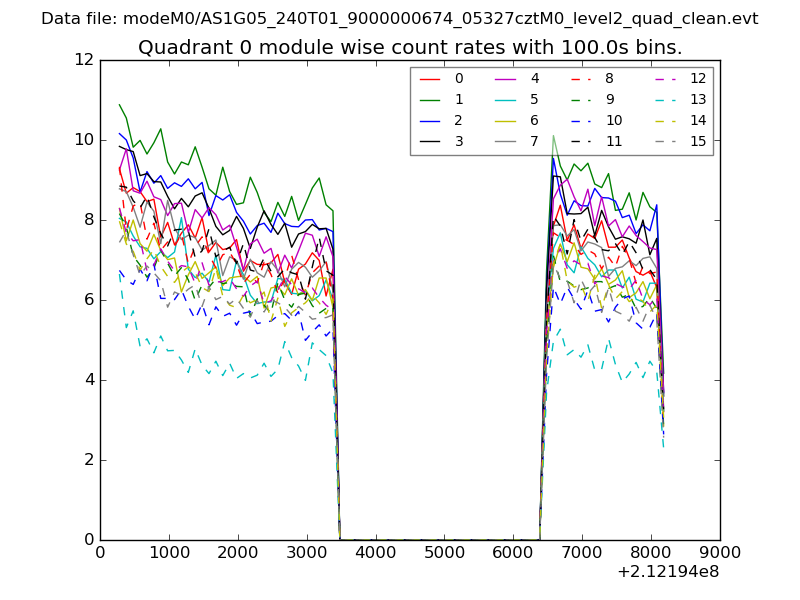 |
 |
| Module-wise count rates for Quadrant B Data is divided into 100 sec bins |
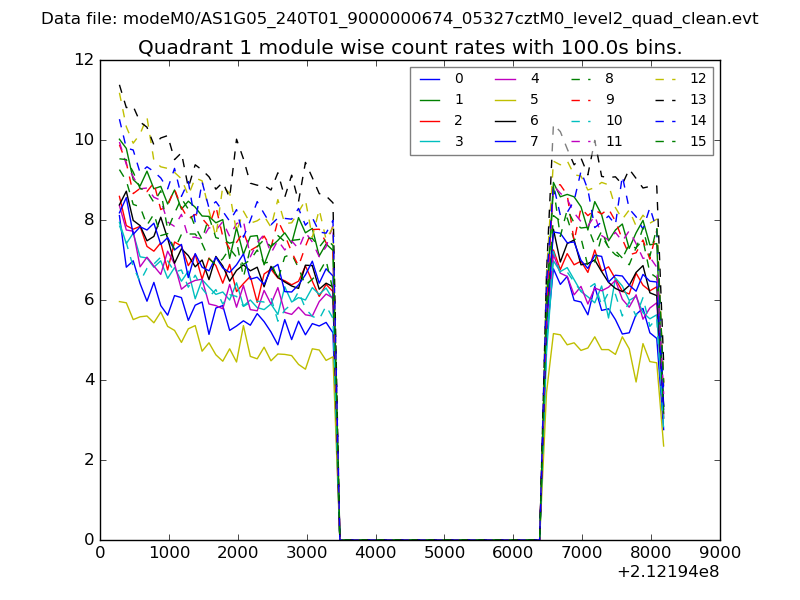 |
 |
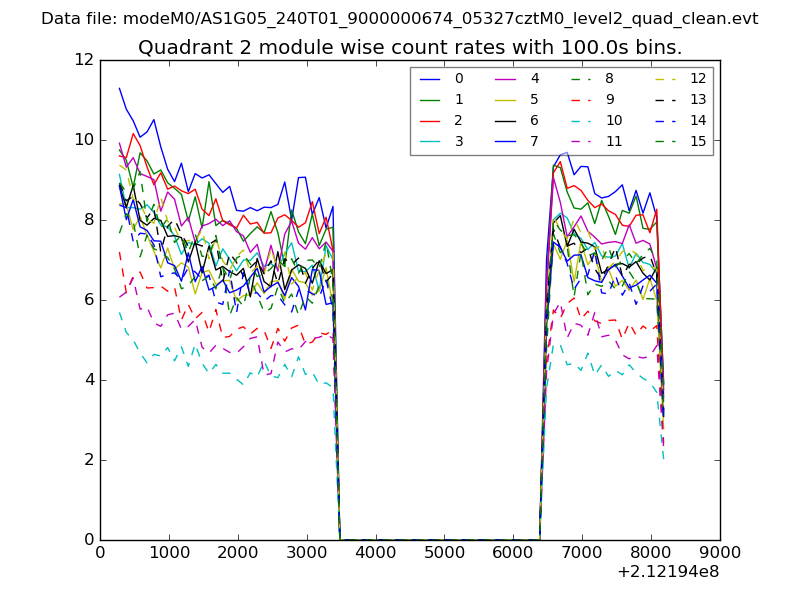
| Module-wise count rates for Quadrant C Data is divided into 100 sec bins |
 |
 |
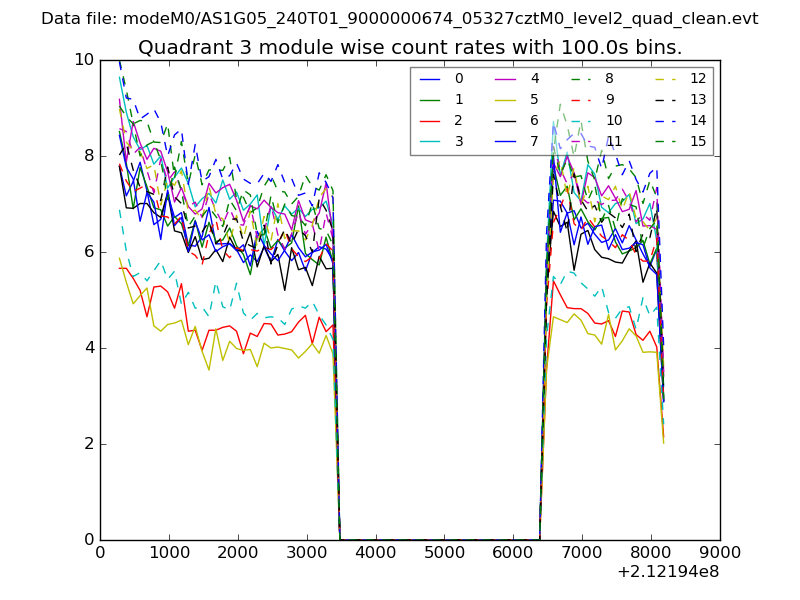
| Module-wise count rates for Quadrant D Data is divided into 100 sec bins |
 |
 |
| Parameter | Plot |
|---|---|
| CZT HV Monitor | 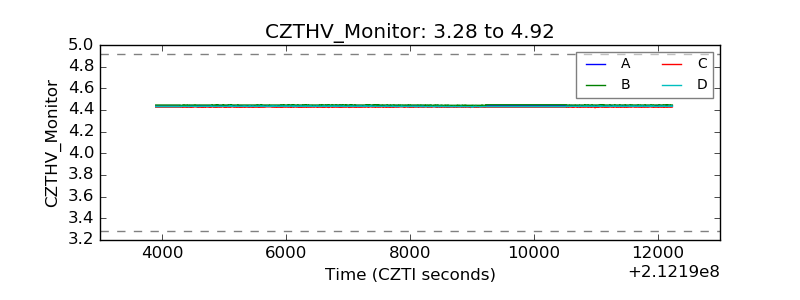 |
| D_VDD | 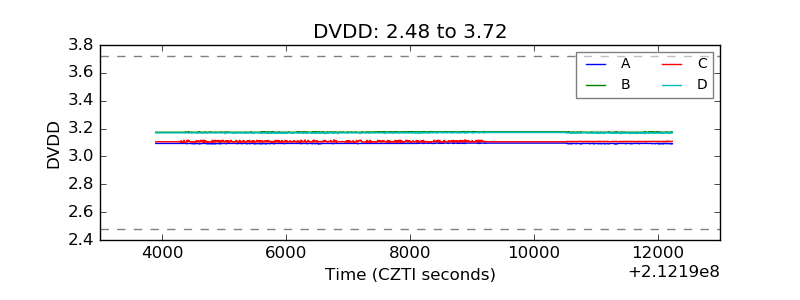 |
| Temperature 1 | 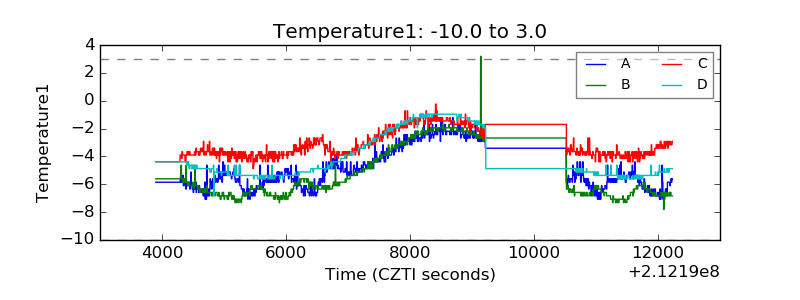 |
| Veto HV Monitor | 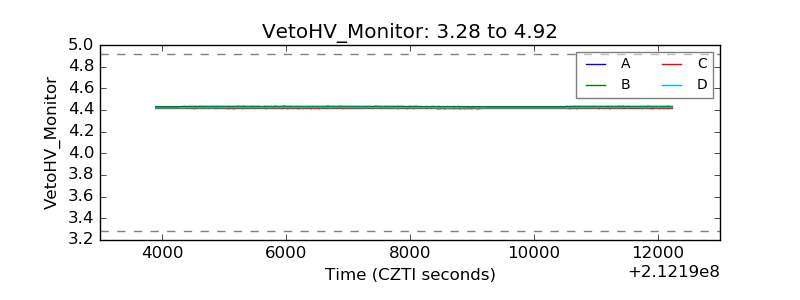 |
| Veto LLD | 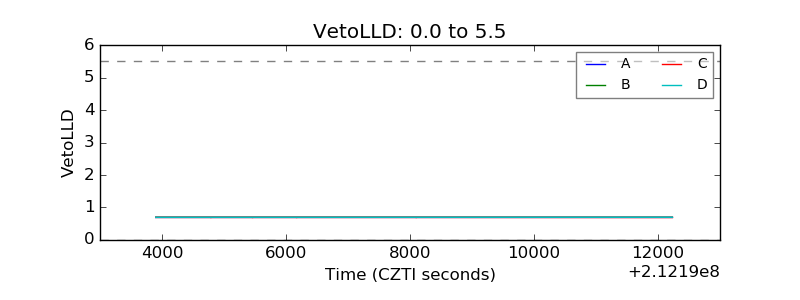 |
| Alpha Counter | 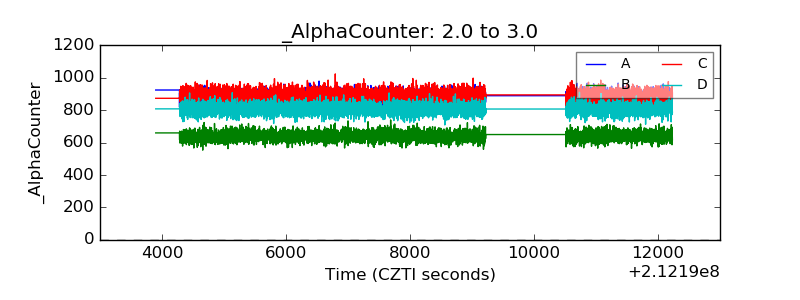 |
| _CPM_Rate | 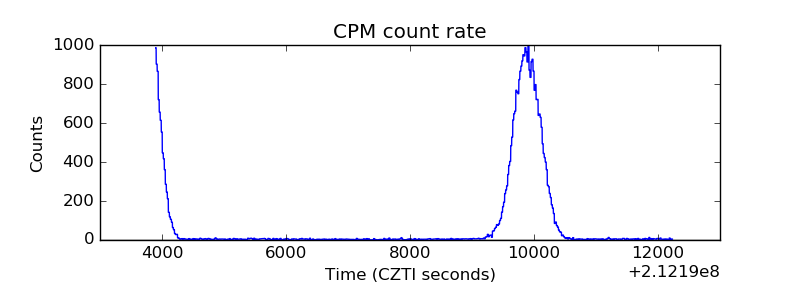 |
| CZT Counter | 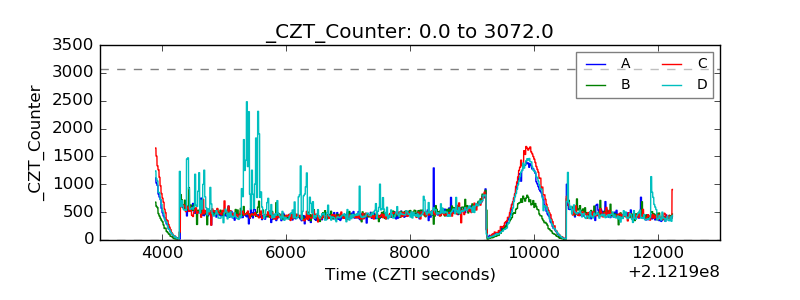 |
| +2.5 Volts monitor | 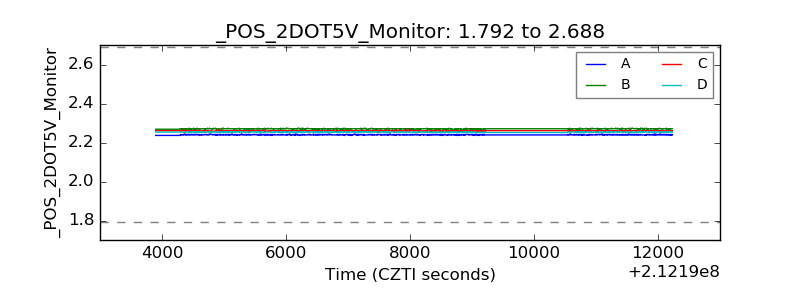 |
| +5 Volts monitor |  |
| _ROLL_ROT | 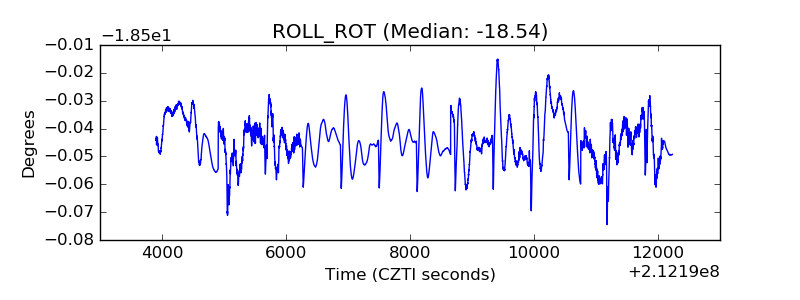 |
| _Roll_DEC | 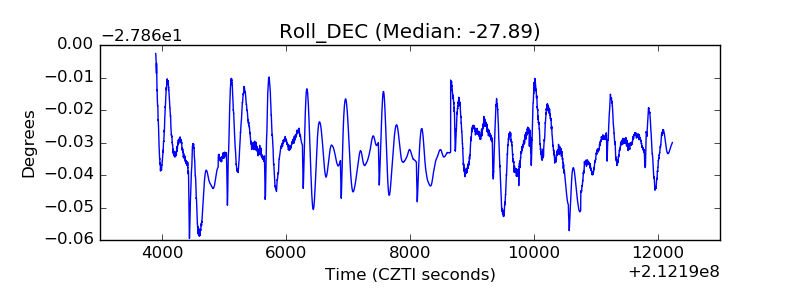 |
| _Roll_RA |  |
| Veto Counter | 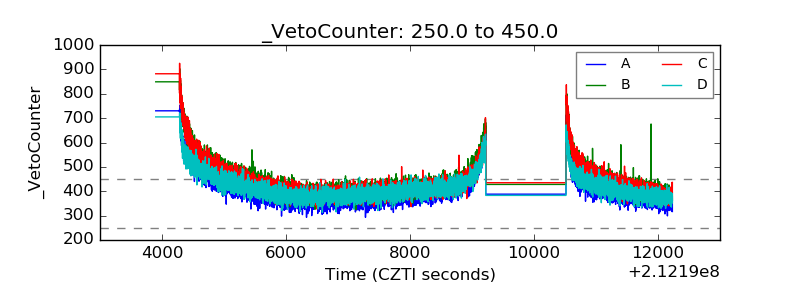 |