| Param | Original file | Final file |
|---|---|---|
| Filename | modeM0/AS1G05_240T01_9000000674_05328cztM0_level2.evt | modeM0/AS1G05_240T01_9000000674_05328cztM0_level2_quad_clean.evt |
| Size (bytes) | 495,820,800 | 81,656,640 |
| Size | 472.9 MB | 77.9 MB |
| Events in quadrant A | 3,168,088 | 502,801 |
| Events in quadrant B | 3,297,745 | 519,185 |
| Events in quadrant C | 3,800,778 | 496,532 |
| Events in quadrant D | 4,279,399 | 472,226 |
| Mode M0 | |||
|---|---|---|---|
| Quadrant | BADHDUFLAG | Total packets | Discarded packets |
| A | 0 | 14316 | 3 |
| B | 0 | 14464 | 2 |
| C | 0 | 16153 | 2 |
| D | 0 | 17660 | 2 |
| Mode SS | |||
|---|---|---|---|
| Quadrant | BADHDUFLAG | Total packets | Discarded packets |
| A | 0 | 142 | 0 |
| B | 0 | 142 | 0 |
| C | 0 | 142 | 0 |
| D | 0 | 142 | 0 |
| Mode M9 | |||
|---|---|---|---|
| Quadrant | BADHDUFLAG | Total packets | Discarded packets |
| A | 0 | 24 | 0 |
| B | 0 | 24 | 0 |
| C | 0 | 24 | 0 |
| D | 0 | 24 | 0 |
| Quadrant | Total seconds | Saturated seconds | Saturation percentage |
|---|---|---|---|
| A | 6919 | 38 | 0.549212% |
| B | 6919 | 47 | 0.679289% |
| C | 6919 | 53 | 0.766007% |
| D | 6919 | 477 | 6.894060% |
Noise dominated data is calculated using 1-second bins in cleaned event files. If a bin has >2000 counts, and if more than 50% of those come from <1% of pixels, then it is considered to be noise-dominated and hence unusable.
| Quadrant | # 1 sec bins | Bins with >0 counts | Bins with >2000 counts | High rate bins dominated by noise | Noise dominated (total time) | Noise dominated (detector-on time) | Marked lightcurve |
|---|---|---|---|---|---|---|---|
| A | 9304 | 6921 | 0 | 0 | 0.00% | 0.00% | 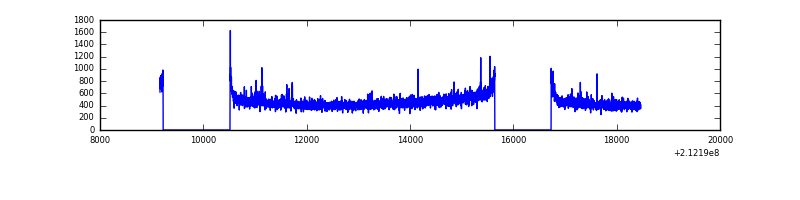 |
| B | 9304 | 6921 | 1 | 1 | 0.01% | 0.01% | 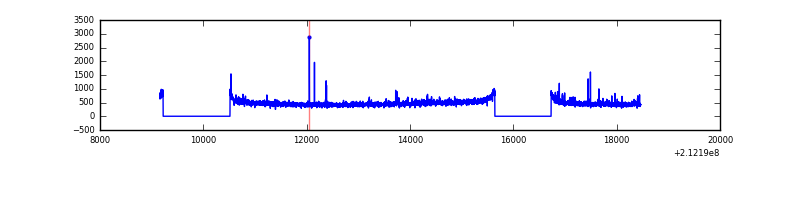 |
| C | 9304 | 6921 | 4 | 4 | 0.04% | 0.06% | 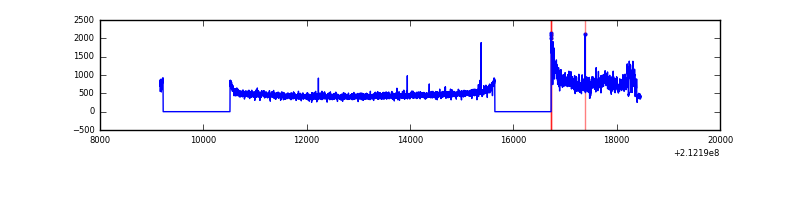 |
| D | 9304 | 6921 | 387 | 387 | 4.16% | 5.59% | 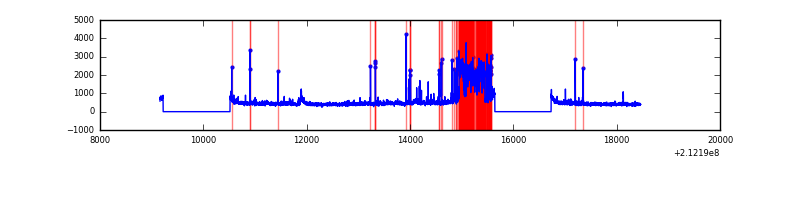 |
Top three noisy pixels from each quadrant. If the there are fewer than three noisy pixels in the level2.evt file, extra rows are filled as -1
| Pixel properties | Quadrant properties | ||||||
|---|---|---|---|---|---|---|---|
| Quadrant | DetID | PixID | Counts | Sigma | Mean | Median | Sigma |
| A | 13 | 251 | 40079 | 238.27 | 809 | 793 | 164.9 |
| A | 0 | 226 | 7806 | 42.53 | 809 | 793 | 164.9 |
| A | 12 | 194 | 7712 | 41.96 | 809 | 793 | 164.9 |
| B | 10 | 16 | 30617 | 190.27 | 823 | 801 | 156.7 |
| B | 4 | 80 | 29518 | 183.26 | 823 | 801 | 156.7 |
| B | 4 | 48 | 20476 | 125.56 | 823 | 801 | 156.7 |
| C | 1 | 16 | 670687 | 3613.31 | 797 | 799 | 185.4 |
| C | 14 | 67 | 8116 | 39.47 | 797 | 799 | 185.4 |
| C | 12 | 4 | 7863 | 38.1 | 797 | 799 | 185.4 |
| D | 2 | 136 | 1028715 | 5536.8 | 763 | 741 | 185.7 |
| D | 8 | 195 | 111350 | 595.75 | 763 | 741 | 185.7 |
| D | 2 | 234 | 58566 | 311.45 | 763 | 741 | 185.7 |
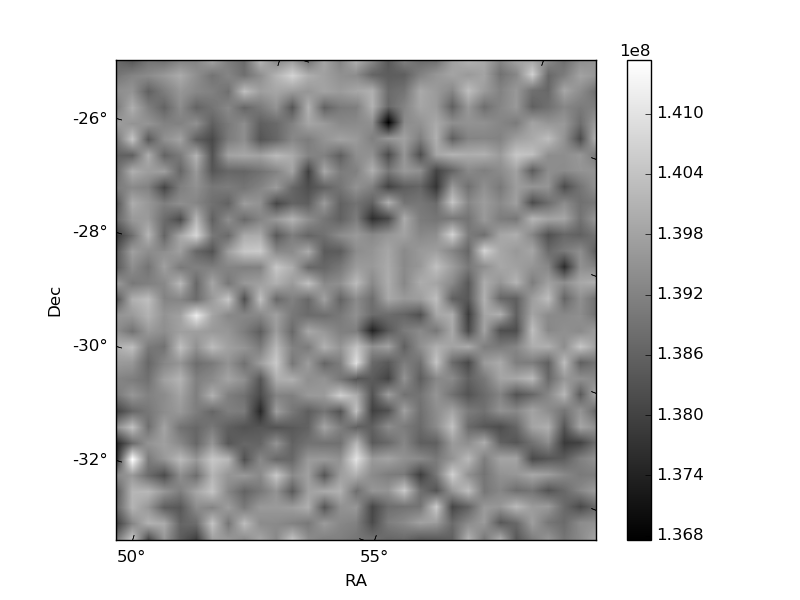
Histogram calculated using DETX and DETY for each event in the final _common_clean file
| Quadrant A | 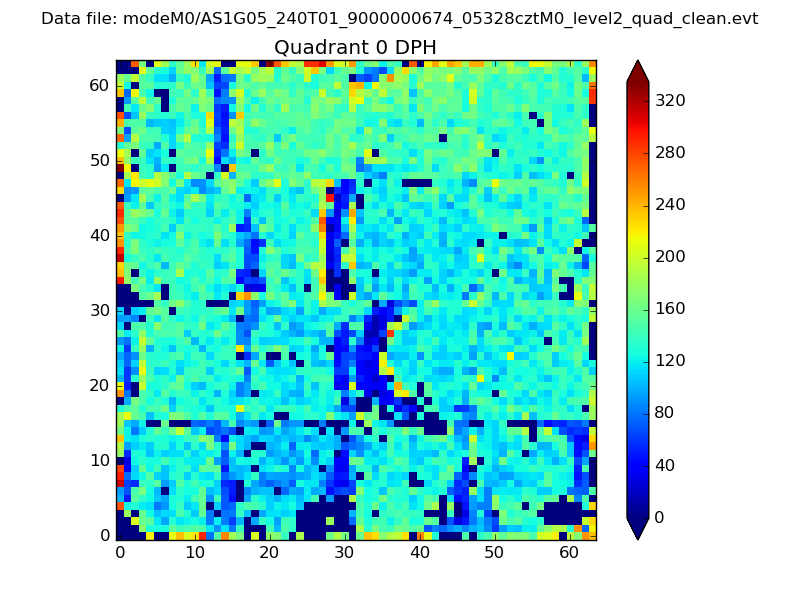 |
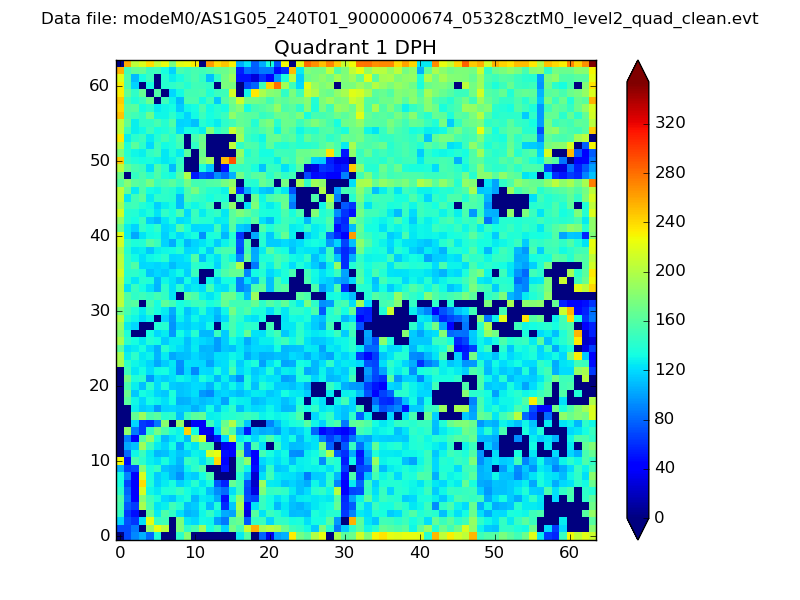 |
Quadrant B |
|---|---|---|---|
| Quadrant D |  |
 |
Quadrant C |
| Plot type | Count rate plots | Images |
|---|---|---|
| Comparison with Poisson distribution Blue bars denote a histogram of data divided into 1 sec bins. Red curve is a Poisson curve with rate = median count rate of data. |
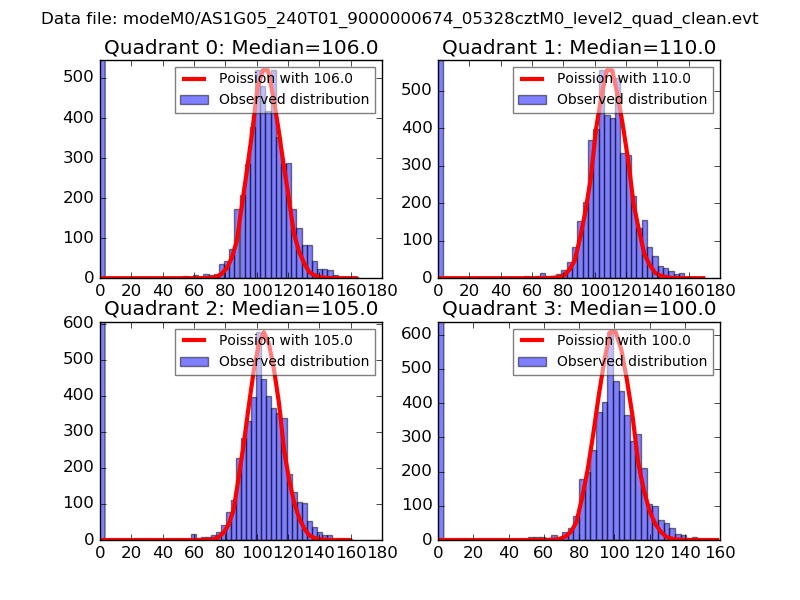 |
 |
| Quadrant-wise count rates Data is divided into 100 sec bins |
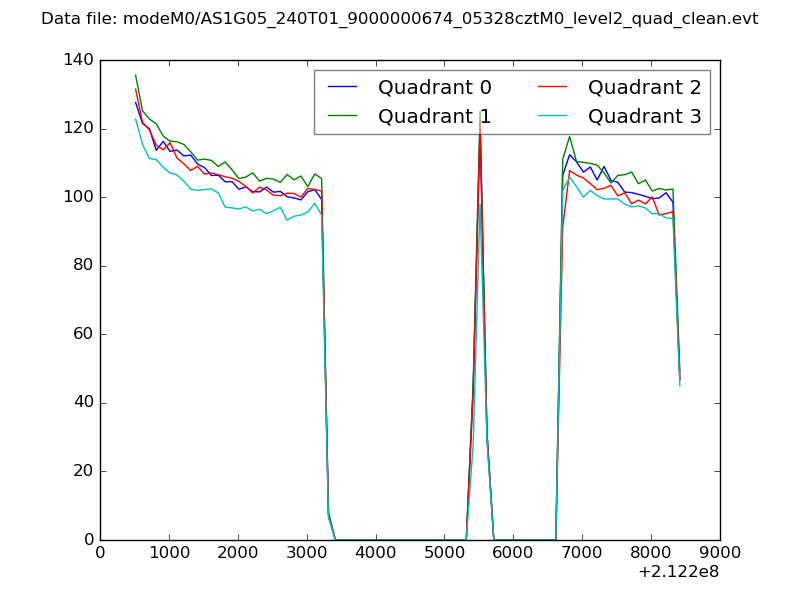 |
|
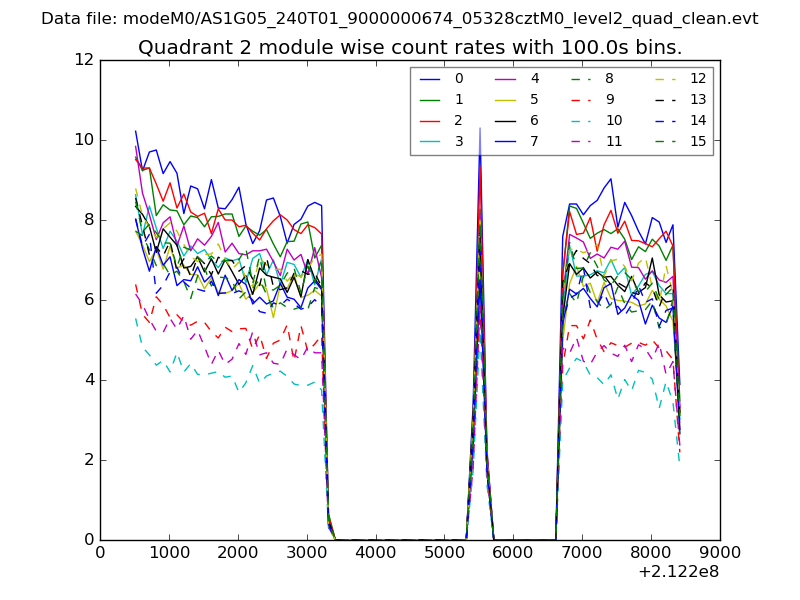
| Module-wise count rates for Quadrant A Data is divided into 100 sec bins |
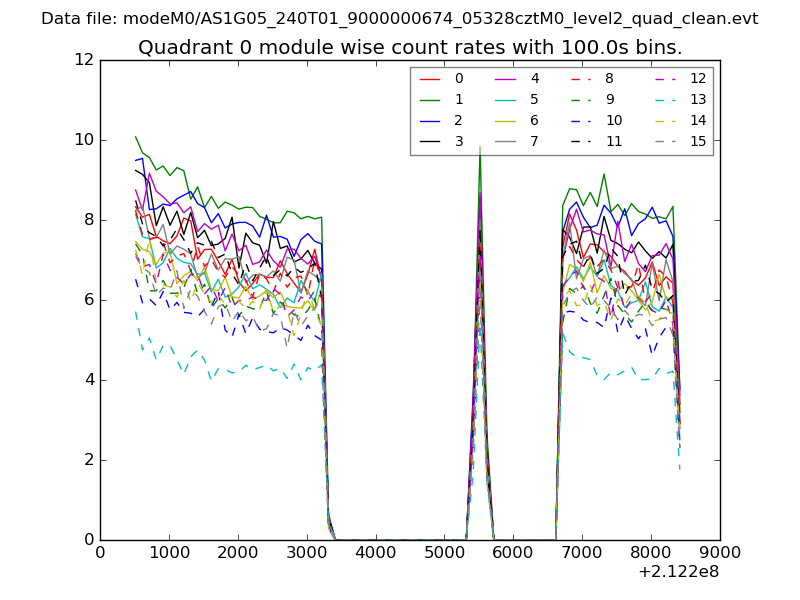 |
 |
| Module-wise count rates for Quadrant B Data is divided into 100 sec bins |
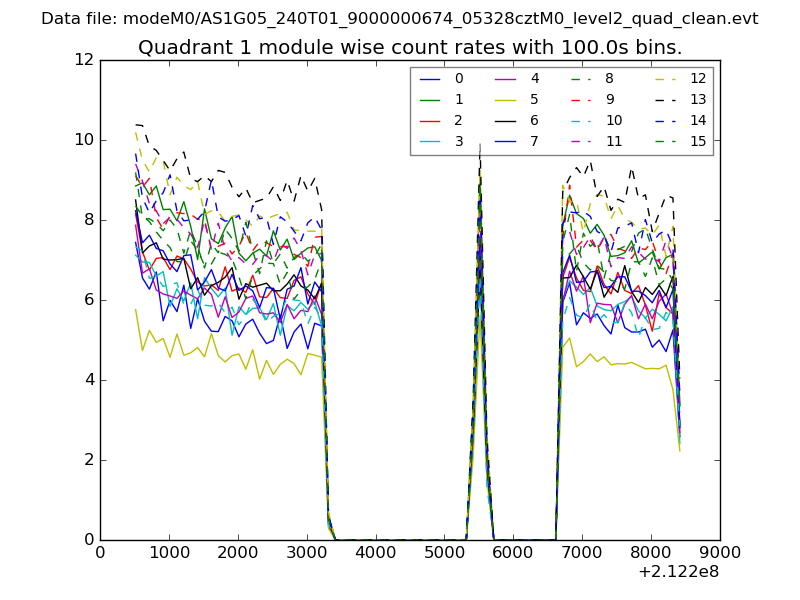 |
 |
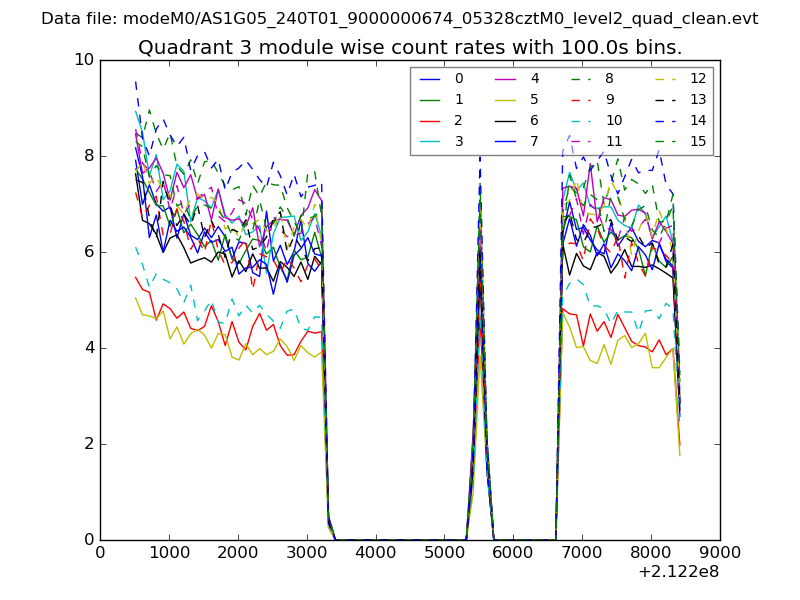
| Module-wise count rates for Quadrant C Data is divided into 100 sec bins |
 |
 |
| Module-wise count rates for Quadrant D Data is divided into 100 sec bins |
 |
 |
| Parameter | Plot |
|---|---|
| CZT HV Monitor | 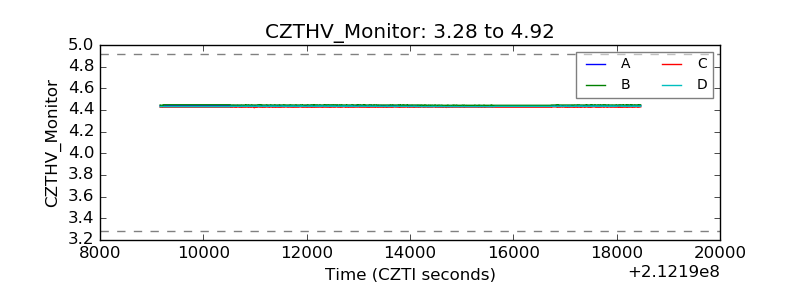 |
| D_VDD | 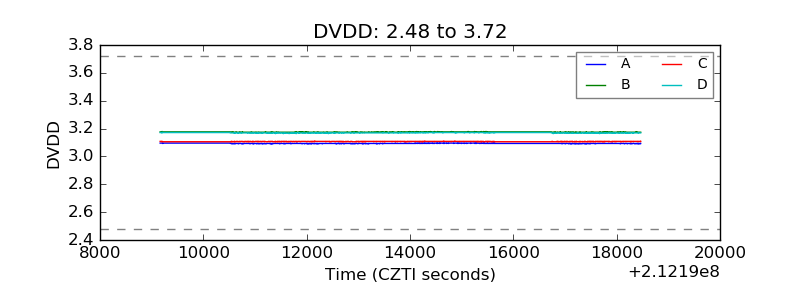 |
| Temperature 1 | 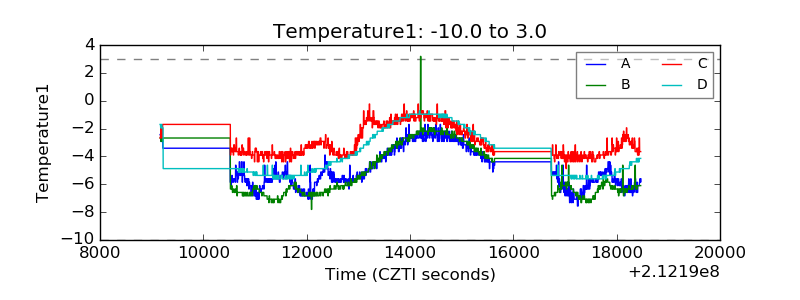 |
| Veto HV Monitor | 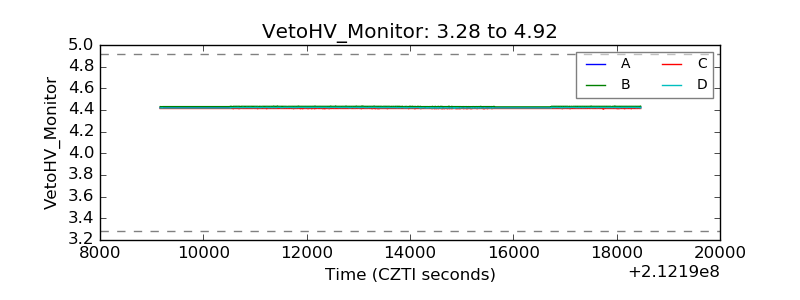 |
| Veto LLD | 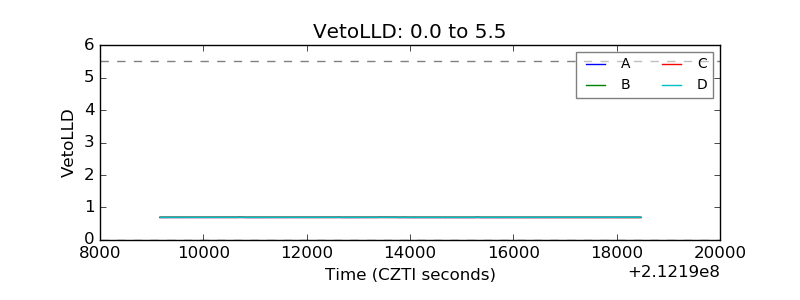 |
| Alpha Counter | 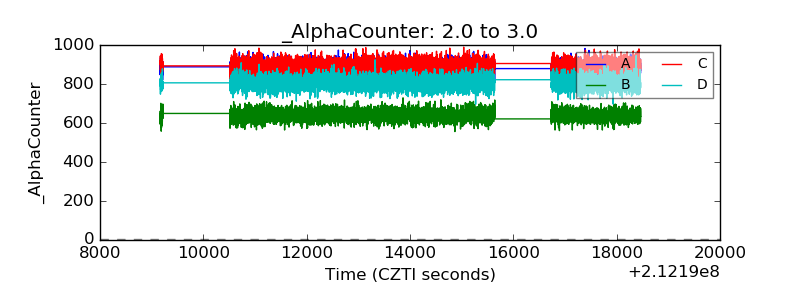 |
| _CPM_Rate | 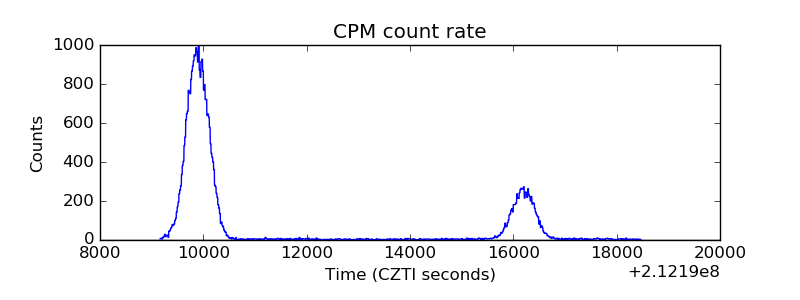 |
| CZT Counter | 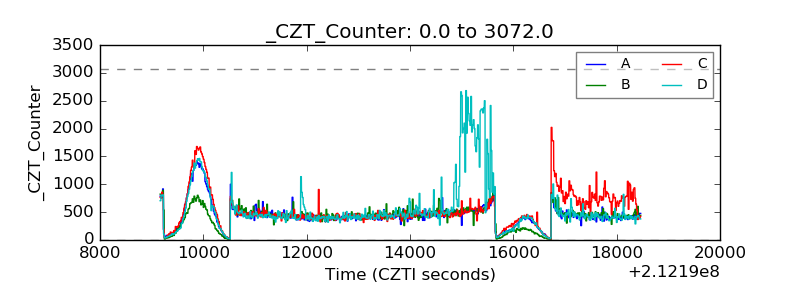 |
| +2.5 Volts monitor |  |
| +5 Volts monitor |  |
| _ROLL_ROT | 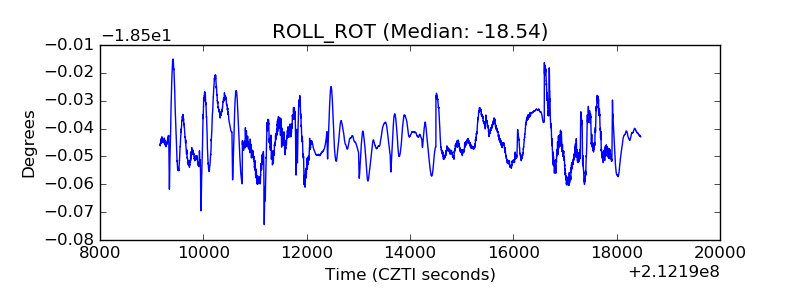 |
| _Roll_DEC | 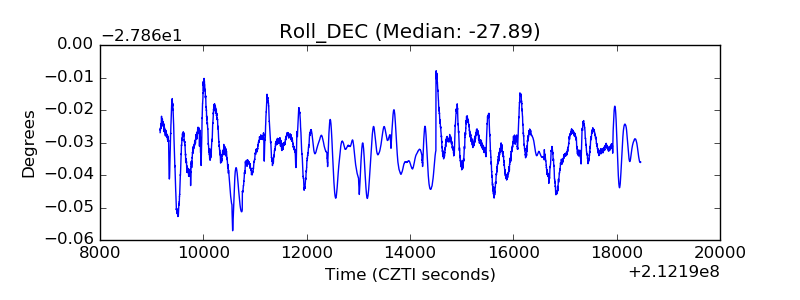 |
| _Roll_RA | 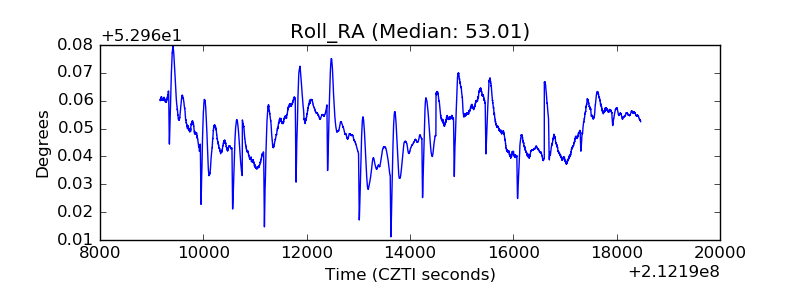 |
| Veto Counter | 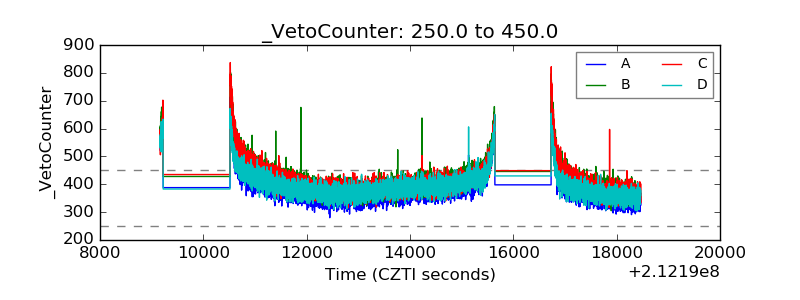 |