| Param | Original file | Final file |
|---|---|---|
| Filename | modeM0/AS1G05_240T01_9000000674_05329cztM0_level2.evt | modeM0/AS1G05_240T01_9000000674_05329cztM0_level2_quad_clean.evt |
| Size (bytes) | 526,124,160 | 85,253,760 |
| Size | 501.8 MB | 81.3 MB |
| Events in quadrant A | 3,318,028 | 527,942 |
| Events in quadrant B | 3,518,363 | 541,902 |
| Events in quadrant C | 4,142,509 | 519,126 |
| Events in quadrant D | 4,463,977 | 489,145 |
| Mode M0 | |||
|---|---|---|---|
| Quadrant | BADHDUFLAG | Total packets | Discarded packets |
| A | 0 | 15023 | 3 |
| B | 0 | 15325 | 2 |
| C | 0 | 17480 | 2 |
| D | 0 | 18385 | 2 |
| Mode SS | |||
|---|---|---|---|
| Quadrant | BADHDUFLAG | Total packets | Discarded packets |
| A | 0 | 146 | 0 |
| B | 0 | 146 | 0 |
| C | 0 | 146 | 0 |
| D | 0 | 146 | 0 |
| Mode M9 | |||
|---|---|---|---|
| Quadrant | BADHDUFLAG | Total packets | Discarded packets |
| A | 0 | 16 | 0 |
| B | 0 | 16 | 0 |
| C | 0 | 16 | 0 |
| D | 0 | 17 | 0 |
| Quadrant | Total seconds | Saturated seconds | Saturation percentage |
|---|---|---|---|
| A | 7232 | 90 | 1.244469% |
| B | 7232 | 75 | 1.037058% |
| C | 7232 | 79 | 1.092367% |
| D | 7232 | 395 | 5.461836% |
Noise dominated data is calculated using 1-second bins in cleaned event files. If a bin has >2000 counts, and if more than 50% of those come from <1% of pixels, then it is considered to be noise-dominated and hence unusable.
| Quadrant | # 1 sec bins | Bins with >0 counts | Bins with >2000 counts | High rate bins dominated by noise | Noise dominated (total time) | Noise dominated (detector-on time) | Marked lightcurve |
|---|---|---|---|---|---|---|---|
| A | 7887 | 7232 | 2 | 2 | 0.03% | 0.03% | 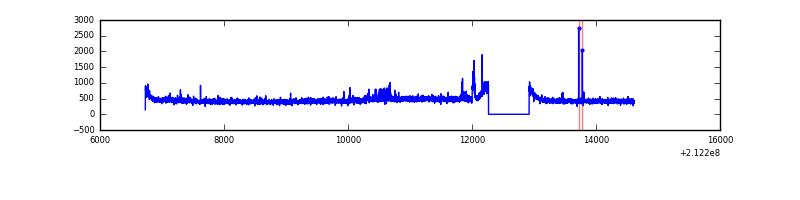 |
| B | 7887 | 7233 | 12 | 12 | 0.15% | 0.17% |  |
| C | 7887 | 7233 | 4 | 4 | 0.05% | 0.06% | 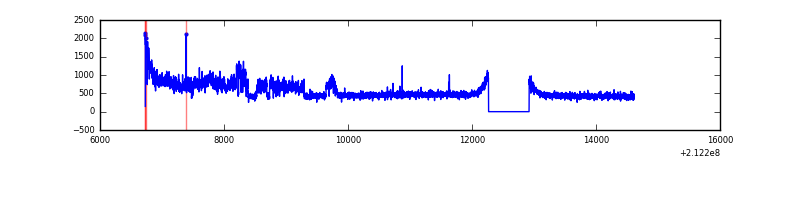 |
| D | 7887 | 7233 | 339 | 339 | 4.30% | 4.69% | 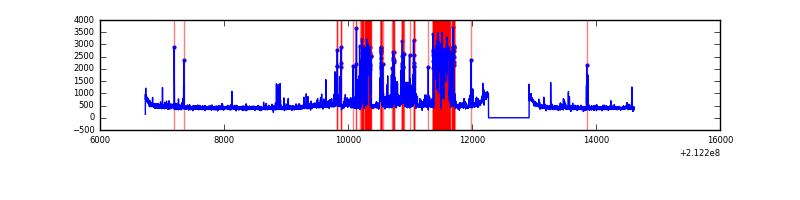 |
Top three noisy pixels from each quadrant. If the there are fewer than three noisy pixels in the level2.evt file, extra rows are filled as -1
| Pixel properties | Quadrant properties | ||||||
|---|---|---|---|---|---|---|---|
| Quadrant | DetID | PixID | Counts | Sigma | Mean | Median | Sigma |
| A | 14 | 111 | 45331 | 259.78 | 833 | 813 | 171.4 |
| A | 0 | 50 | 42390 | 242.61 | 833 | 813 | 171.4 |
| A | 13 | 251 | 20416 | 114.39 | 833 | 813 | 171.4 |
| B | 10 | 16 | 142450 | 871.15 | 847 | 827 | 162.6 |
| B | 4 | 80 | 43255 | 260.98 | 847 | 827 | 162.6 |
| B | 4 | 48 | 28026 | 167.31 | 847 | 827 | 162.6 |
| C | 1 | 16 | 931942 | 4857.41 | 821 | 825 | 191.7 |
| C | 13 | 61 | 6498 | 29.59 | 821 | 825 | 191.7 |
| C | 12 | 4 | 4911 | 21.32 | 821 | 825 | 191.7 |
| D | 7 | 203 | 1017588 | 5171.07 | 800 | 773 | 196.6 |
| D | 8 | 195 | 104649 | 528.26 | 800 | 773 | 196.6 |
| D | 2 | 16 | 79923 | 402.52 | 800 | 773 | 196.6 |
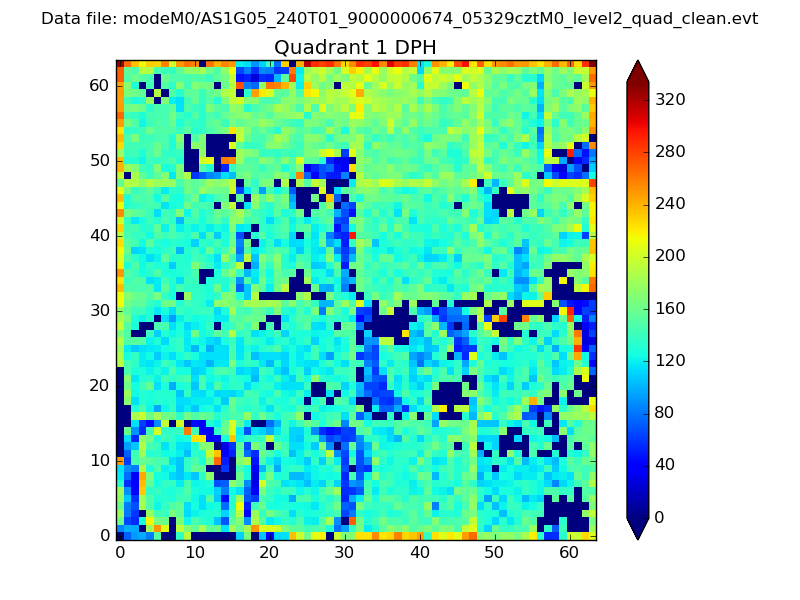
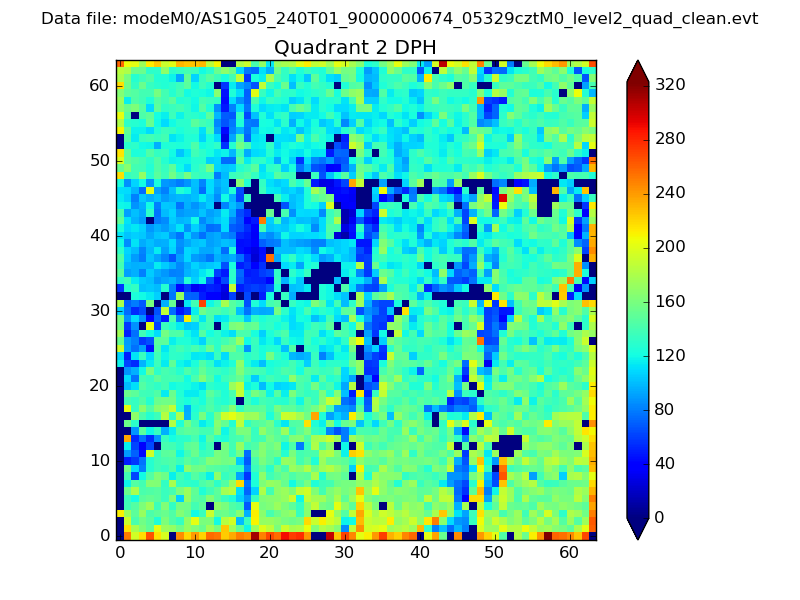
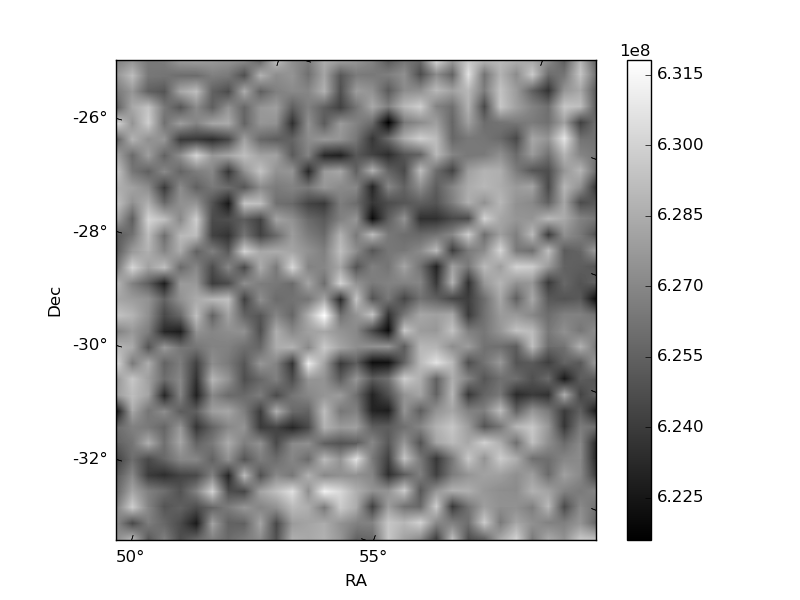
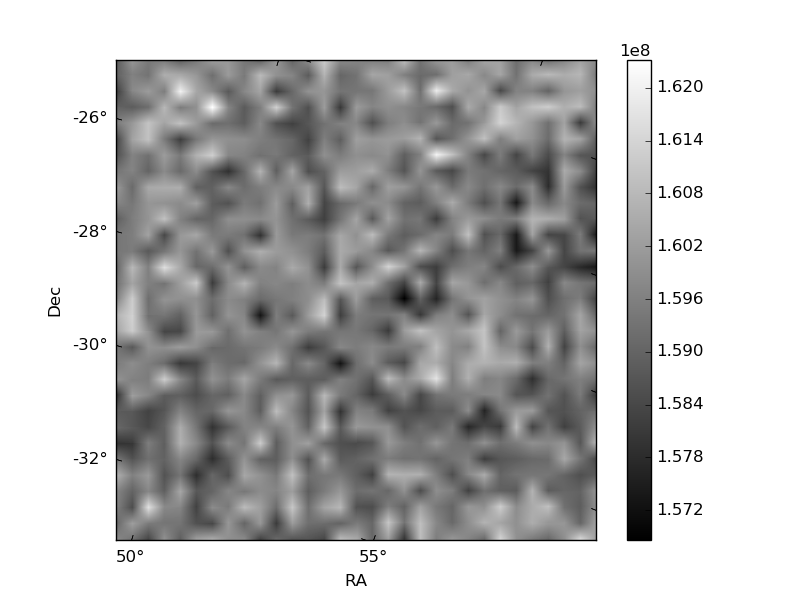
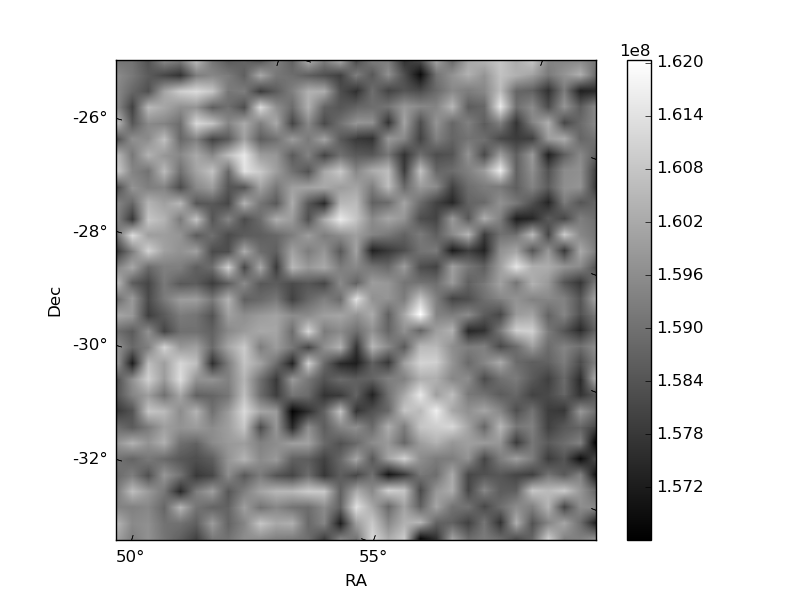
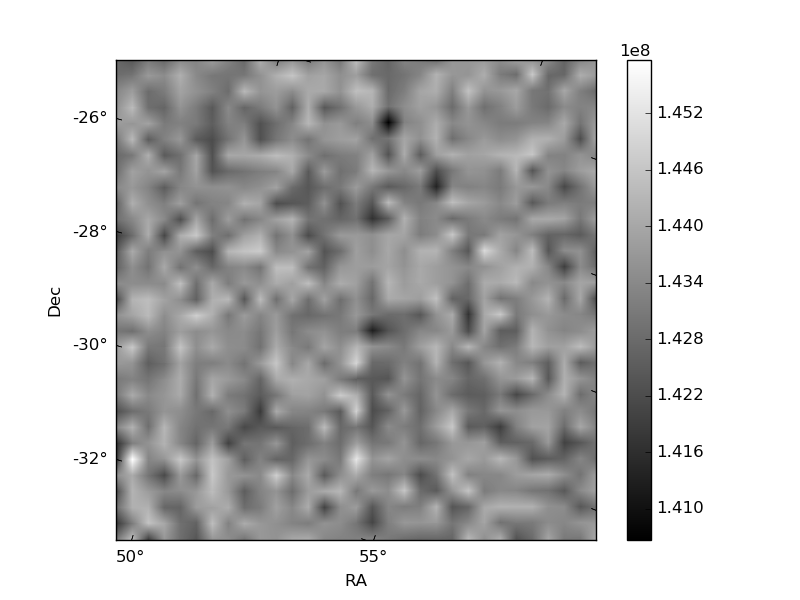
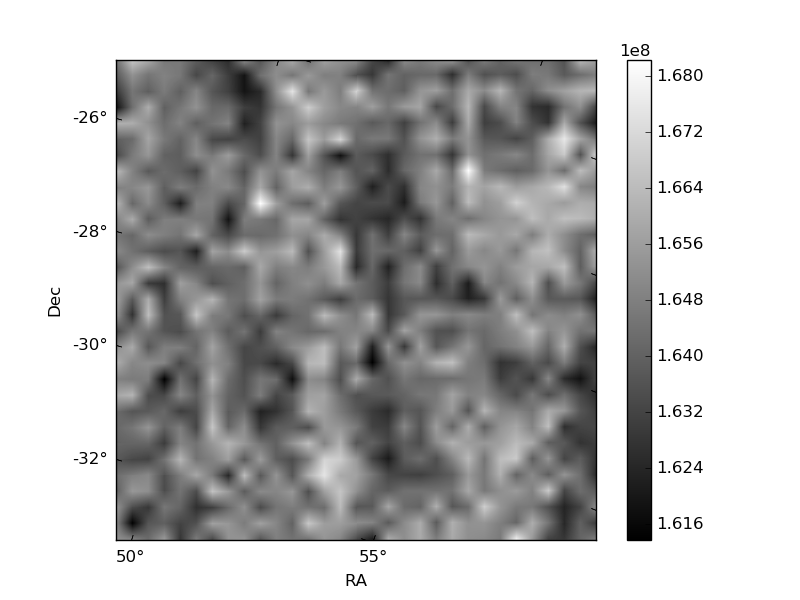
Histogram calculated using DETX and DETY for each event in the final _common_clean file
| Quadrant A | 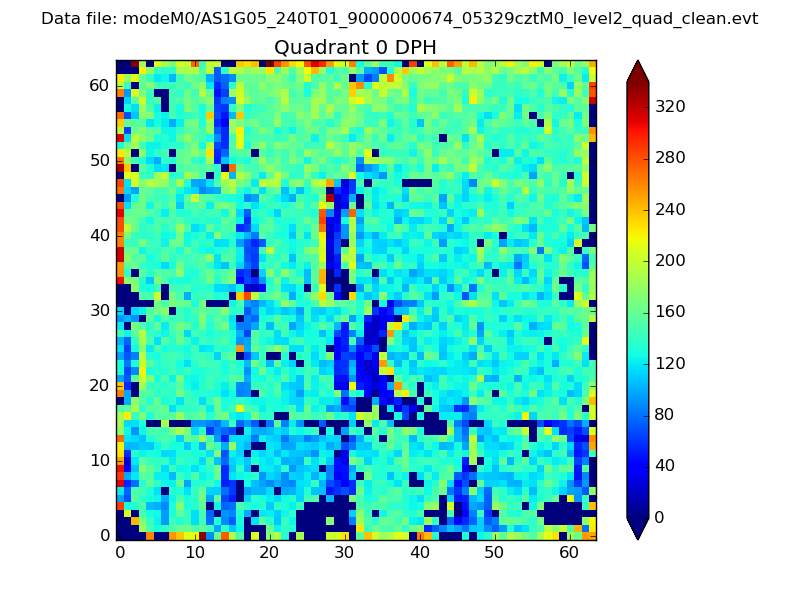 |
 |
Quadrant B |
|---|---|---|---|
| Quadrant D | 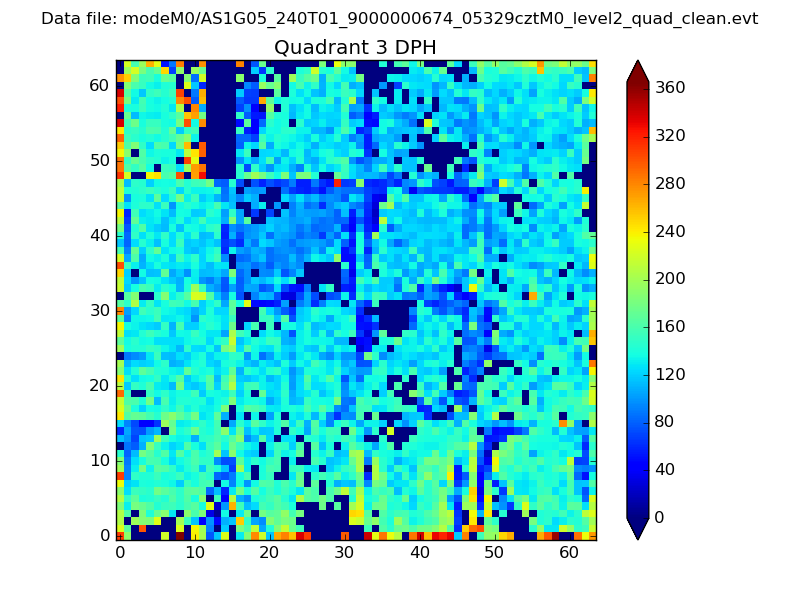 |
 |
Quadrant C |
| Plot type | Count rate plots | Images |
|---|---|---|
| Comparison with Poisson distribution Blue bars denote a histogram of data divided into 1 sec bins. Red curve is a Poisson curve with rate = median count rate of data. |
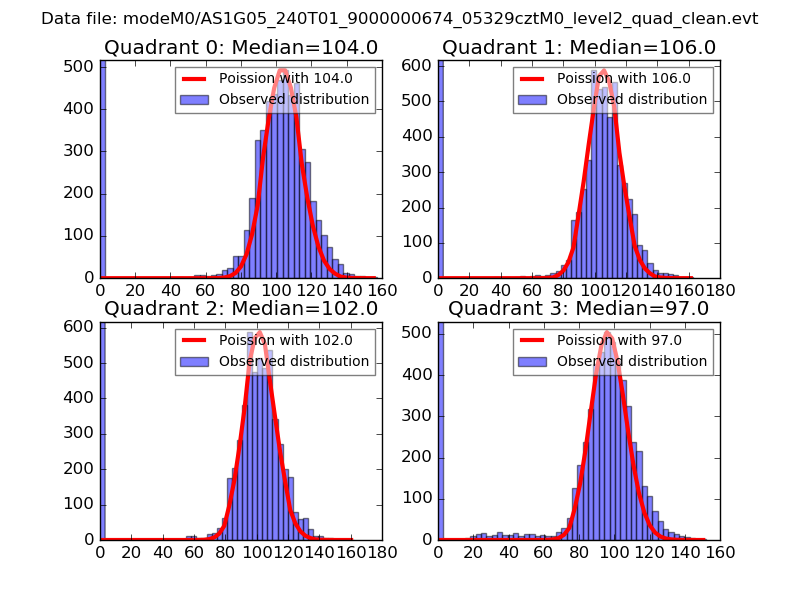 |
 |
| Quadrant-wise count rates Data is divided into 100 sec bins |
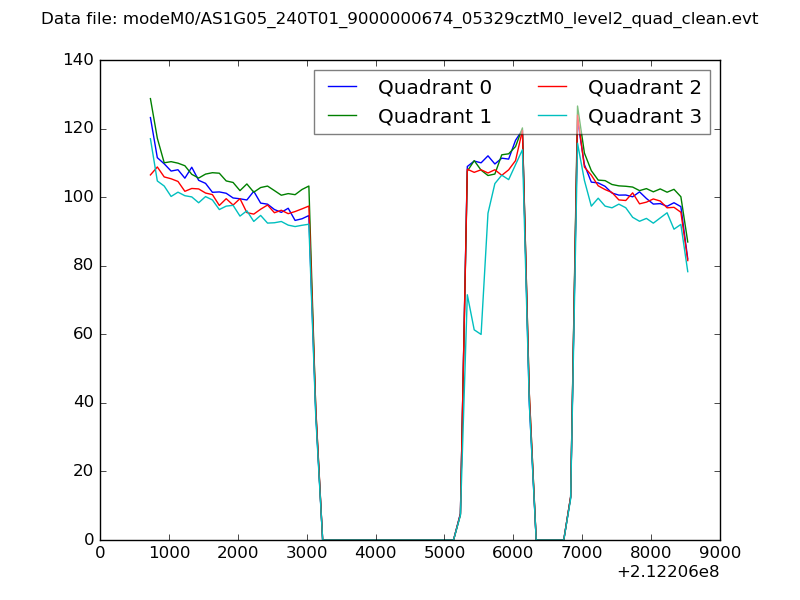 |
|
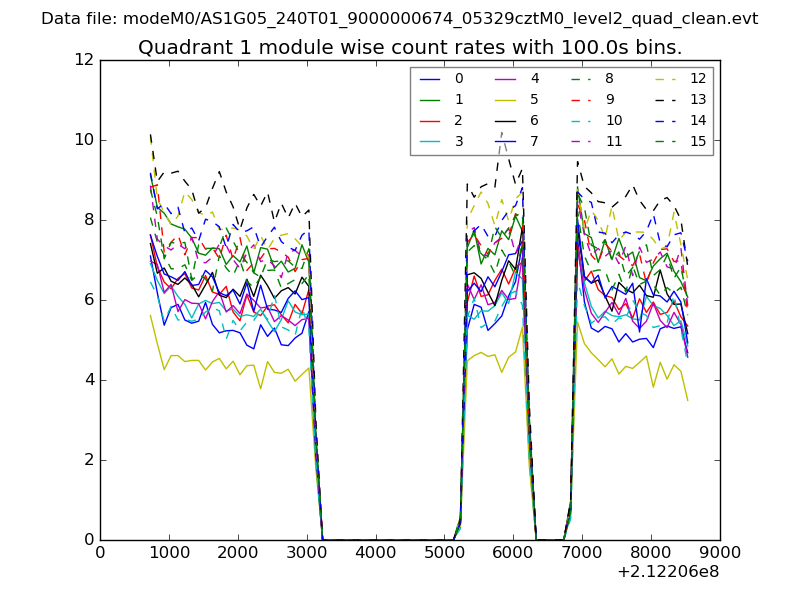
| Module-wise count rates for Quadrant A Data is divided into 100 sec bins |
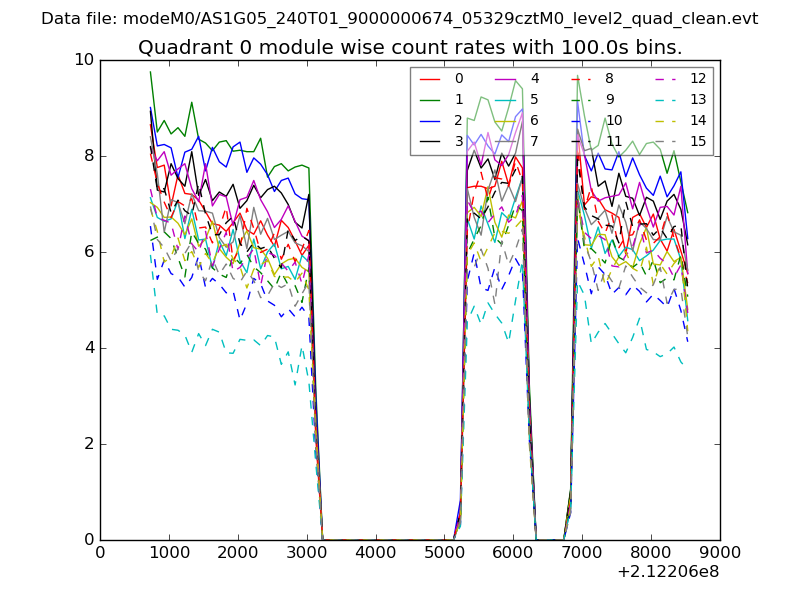 |
 |
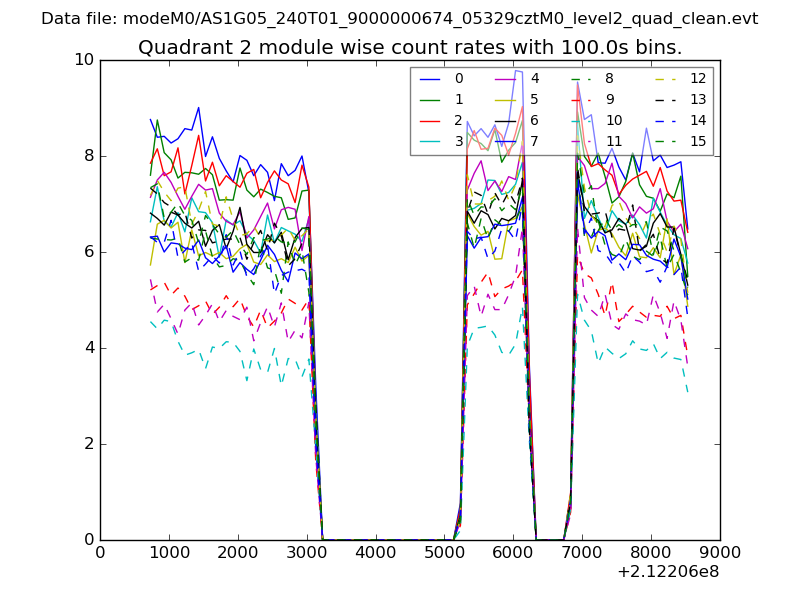
| Module-wise count rates for Quadrant B Data is divided into 100 sec bins |
 |
 |
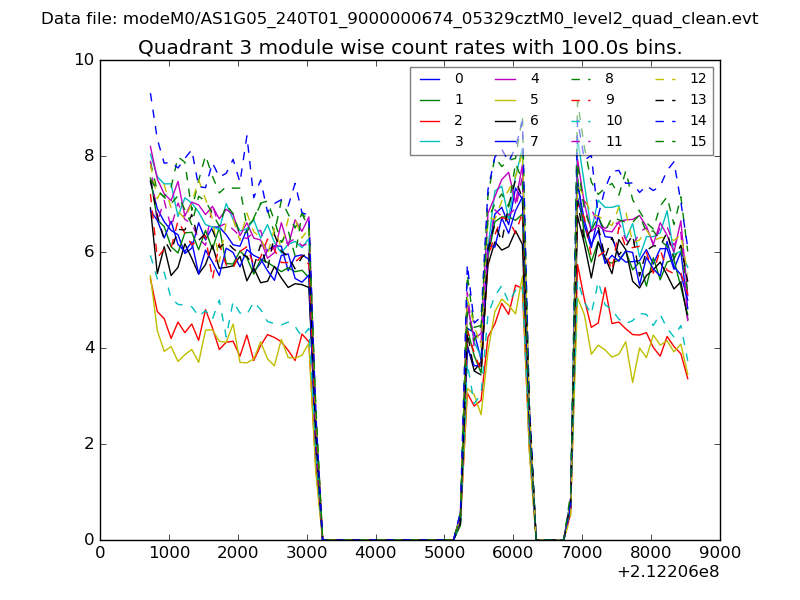
| Module-wise count rates for Quadrant C Data is divided into 100 sec bins |
 |
 |
| Module-wise count rates for Quadrant D Data is divided into 100 sec bins |
 |
 |
| Parameter | Plot |
|---|---|
| CZT HV Monitor | 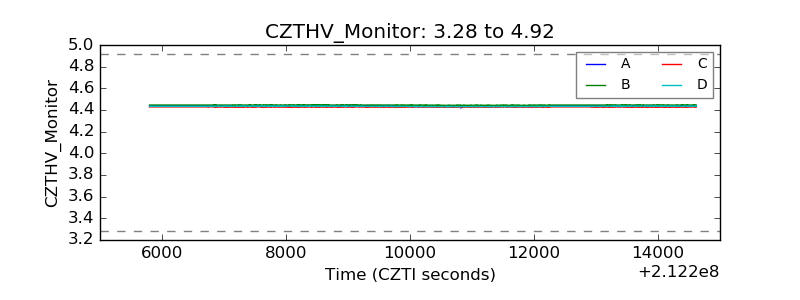 |
| D_VDD | 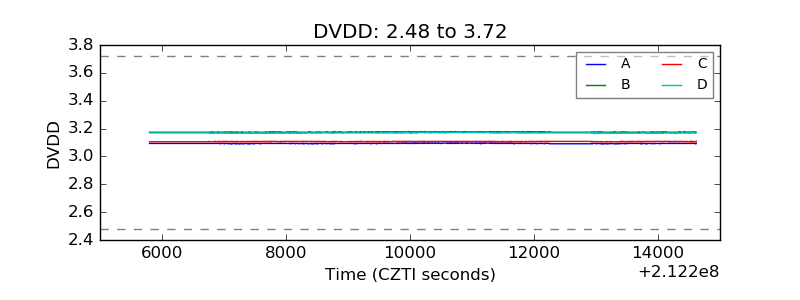 |
| Temperature 1 |  |
| Veto HV Monitor | 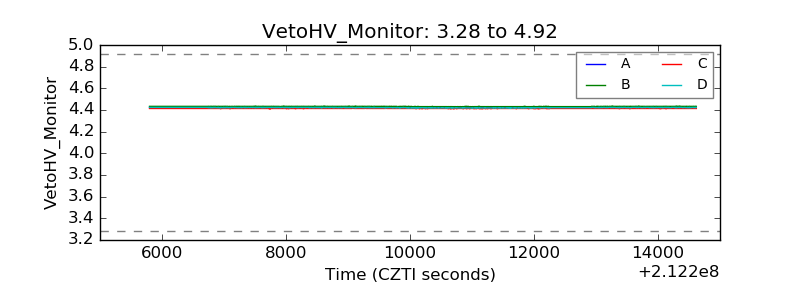 |
| Veto LLD | 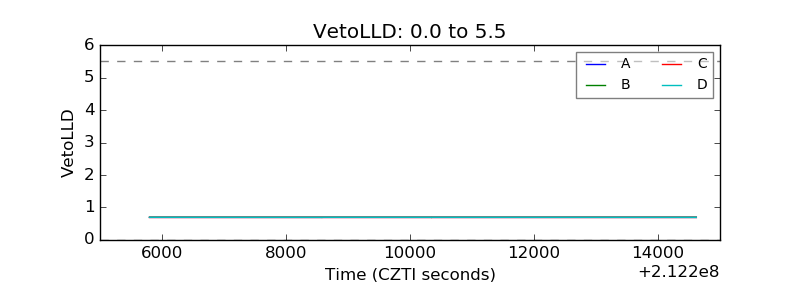 |
| Alpha Counter | 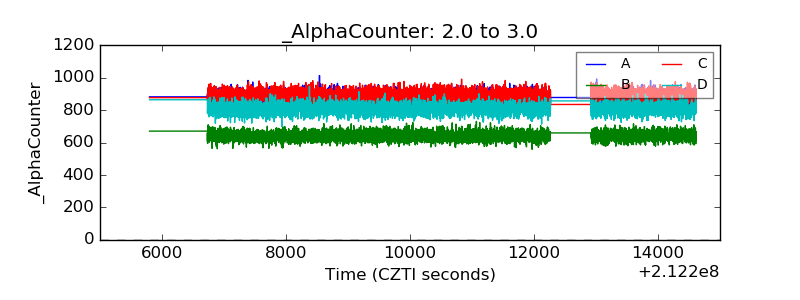 |
| _CPM_Rate | 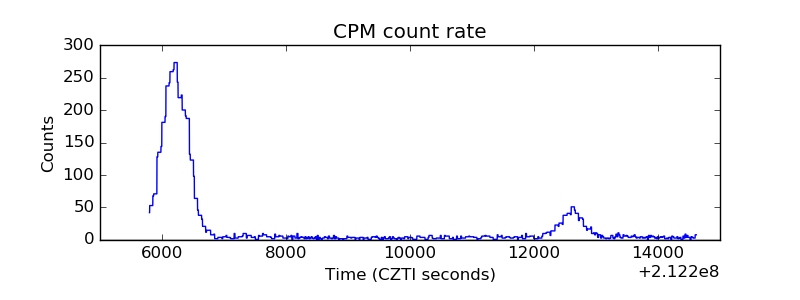 |
| CZT Counter | 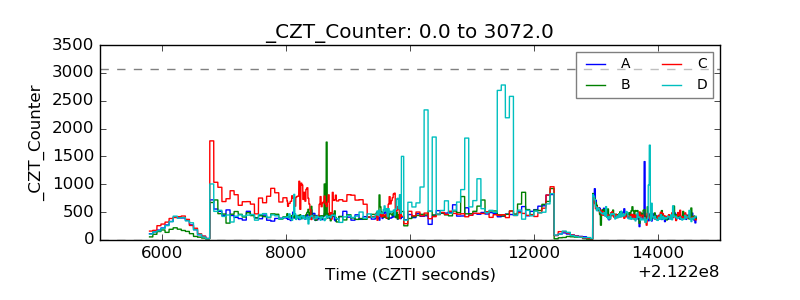 |
| +2.5 Volts monitor |  |
| +5 Volts monitor |  |
| _ROLL_ROT | 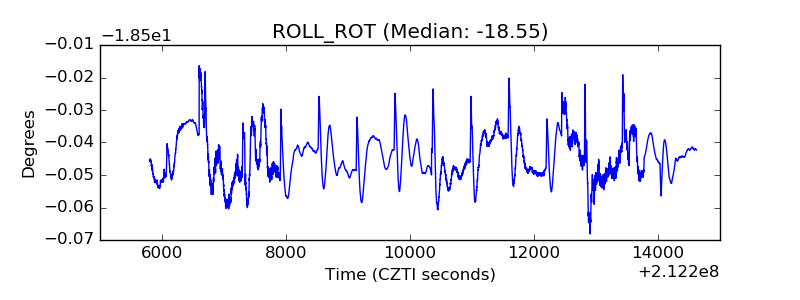 |
| _Roll_DEC |  |
| _Roll_RA | 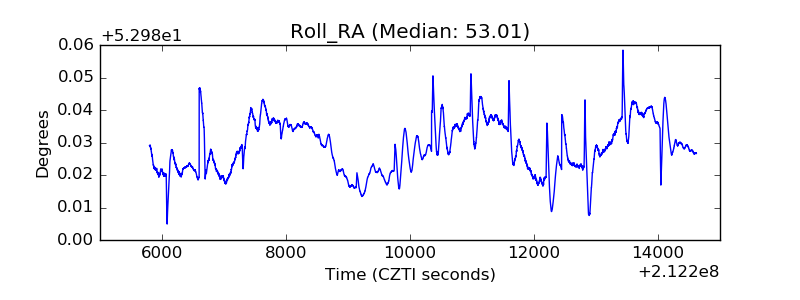 |
| Veto Counter | 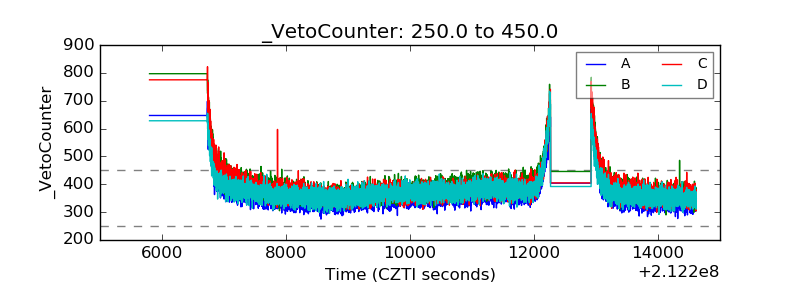 |