| Param | Original file | Final file |
|---|---|---|
| Filename | modeM0/AS1G05_240T01_9000000674_05330cztM0_level2.evt | modeM0/AS1G05_240T01_9000000674_05330cztM0_level2_quad_clean.evt |
| Size (bytes) | 486,239,040 | 92,384,640 |
| Size | 463.7 MB | 88.1 MB |
| Events in quadrant A | 3,479,181 | 569,365 |
| Events in quadrant B | 3,730,860 | 585,906 |
| Events in quadrant C | 3,471,002 | 567,989 |
| Events in quadrant D | 3,524,820 | 542,792 |
| Mode M0 | |||
|---|---|---|---|
| Quadrant | BADHDUFLAG | Total packets | Discarded packets |
| A | 0 | 16171 | 299 |
| B | 0 | 16571 | 310 |
| C | 0 | 16068 | 299 |
| D | 0 | 16488 | 284 |
| Mode SS | |||
|---|---|---|---|
| Quadrant | BADHDUFLAG | Total packets | Discarded packets |
| A | 0 | 156 | 4 |
| B | 0 | 156 | 2 |
| C | 0 | 156 | 2 |
| D | 0 | 156 | 2 |
| Quadrant | Total seconds | Saturated seconds | Saturation percentage |
|---|---|---|---|
| A | 7630 | 244 | 3.197903% |
| B | 7633 | 230 | 3.013232% |
| C | 7631 | 183 | 2.398113% |
| D | 7644 | 188 | 2.459445% |
Noise dominated data is calculated using 1-second bins in cleaned event files. If a bin has >2000 counts, and if more than 50% of those come from <1% of pixels, then it is considered to be noise-dominated and hence unusable.
| Quadrant | # 1 sec bins | Bins with >0 counts | Bins with >2000 counts | High rate bins dominated by noise | Noise dominated (total time) | Noise dominated (detector-on time) | Marked lightcurve |
|---|---|---|---|---|---|---|---|
| A | 7818 | 7771 | 6 | 6 | 0.08% | 0.08% | 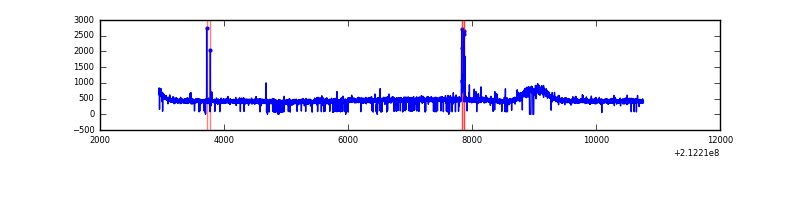 |
| B | 7818 | 7767 | 9 | 9 | 0.12% | 0.12% | 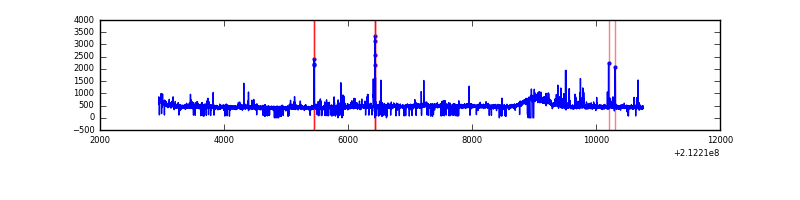 |
| C | 7818 | 7772 | 0 | 0 | 0.00% | 0.00% | 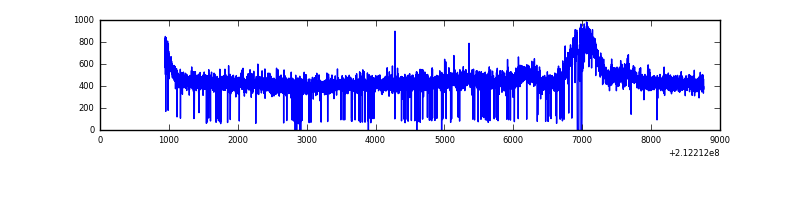 |
| D | 7818 | 7769 | 3 | 3 | 0.04% | 0.04% | 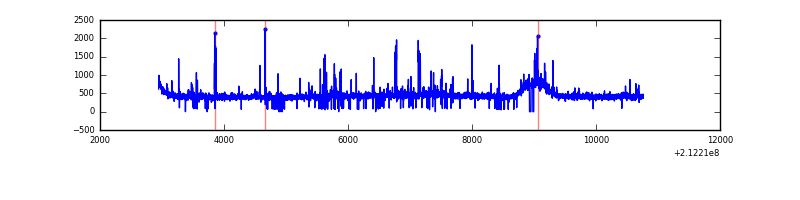 |
Top three noisy pixels from each quadrant. If the there are fewer than three noisy pixels in the level2.evt file, extra rows are filled as -1
| Pixel properties | Quadrant properties | ||||||
|---|---|---|---|---|---|---|---|
| Quadrant | DetID | PixID | Counts | Sigma | Mean | Median | Sigma |
| A | 0 | 50 | 39223 | 208.21 | 888 | 865 | 184.2 |
| A | 13 | 251 | 16376 | 84.19 | 888 | 865 | 184.2 |
| A | 12 | 194 | 8737 | 42.73 | 888 | 865 | 184.2 |
| B | 4 | 80 | 118735 | 679.47 | 899 | 875 | 173.5 |
| B | 4 | 48 | 40181 | 226.6 | 899 | 875 | 173.5 |
| B | 10 | 16 | 35358 | 198.8 | 899 | 875 | 173.5 |
| C | 1 | 16 | 48964 | 236.47 | 876 | 877 | 203.4 |
| C | 13 | 61 | 7112 | 30.66 | 876 | 877 | 203.4 |
| C | 7 | 159 | 3110 | 10.98 | 876 | 877 | 203.4 |
| D | 2 | 16 | 57683 | 265.44 | 872 | 841 | 214.1 |
| D | 13 | 137 | 43377 | 198.63 | 872 | 841 | 214.1 |
| D | 8 | 195 | 35889 | 163.67 | 872 | 841 | 214.1 |
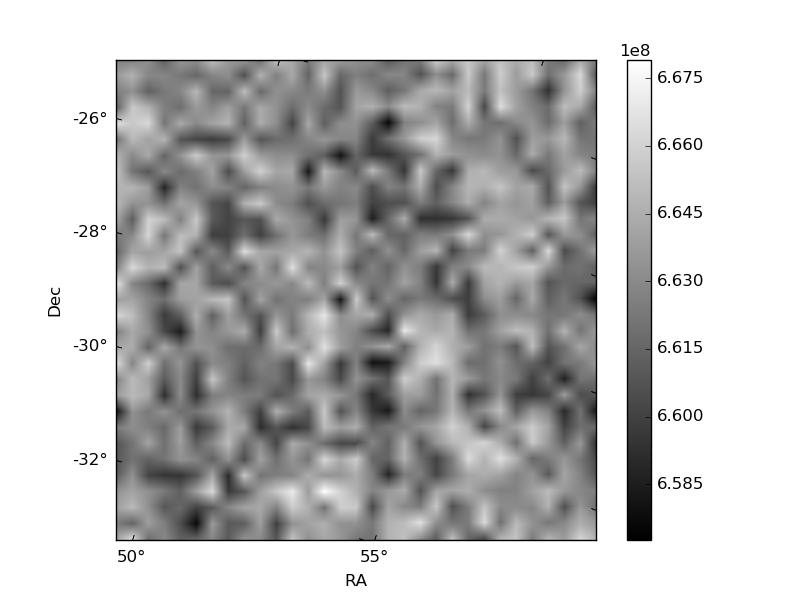
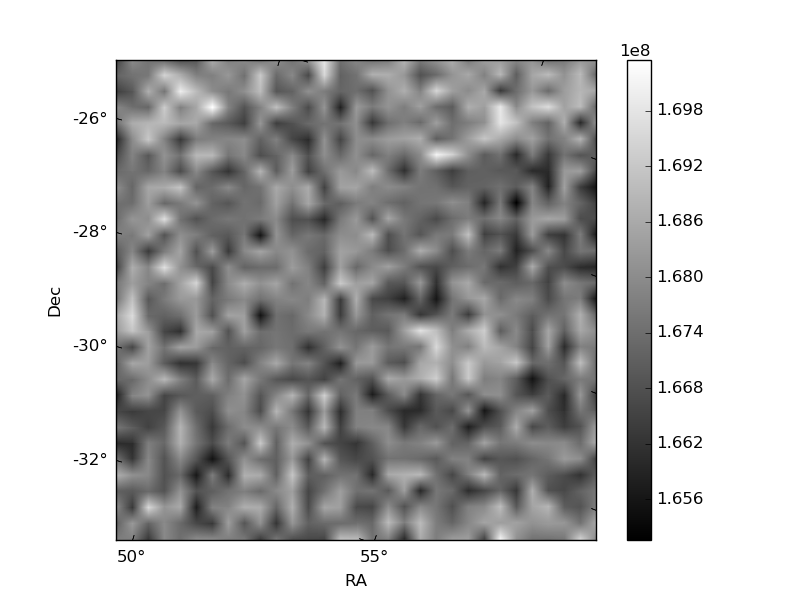
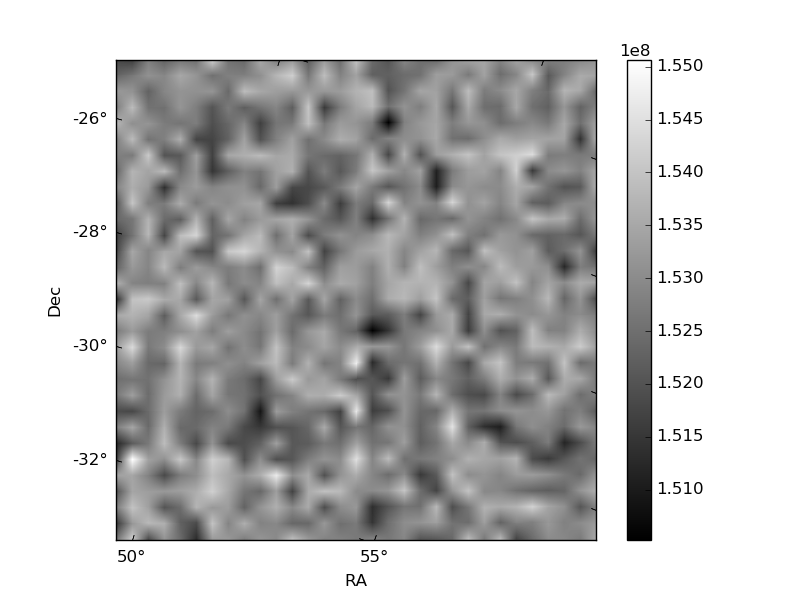
Histogram calculated using DETX and DETY for each event in the final _common_clean file
| Quadrant A | 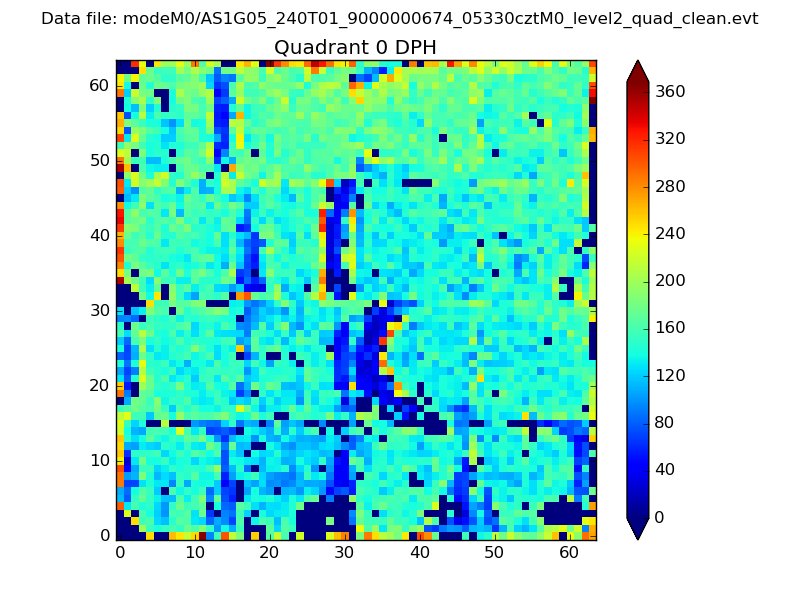 |
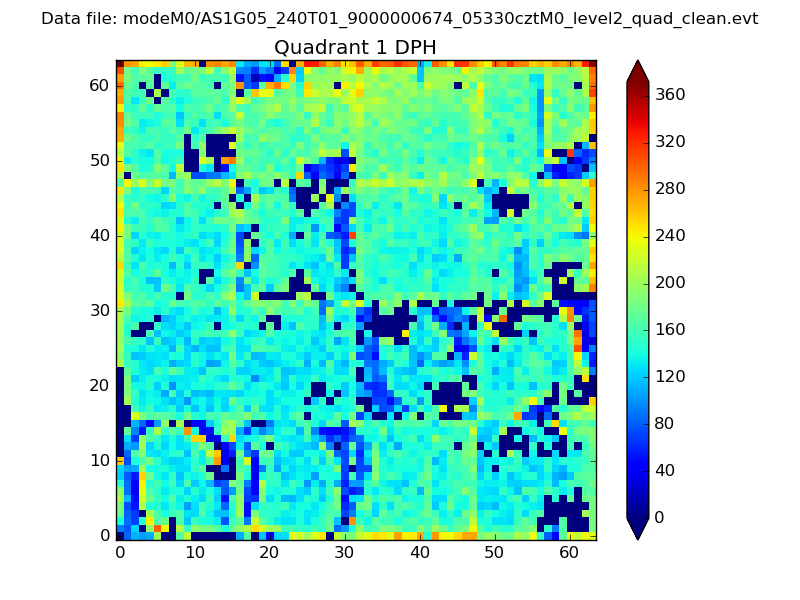 |
Quadrant B |
|---|---|---|---|
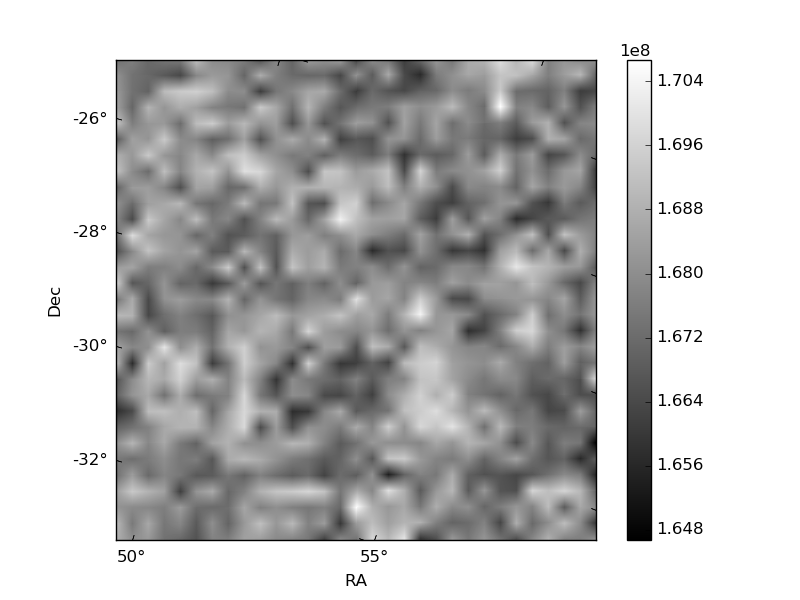
| Quadrant D | 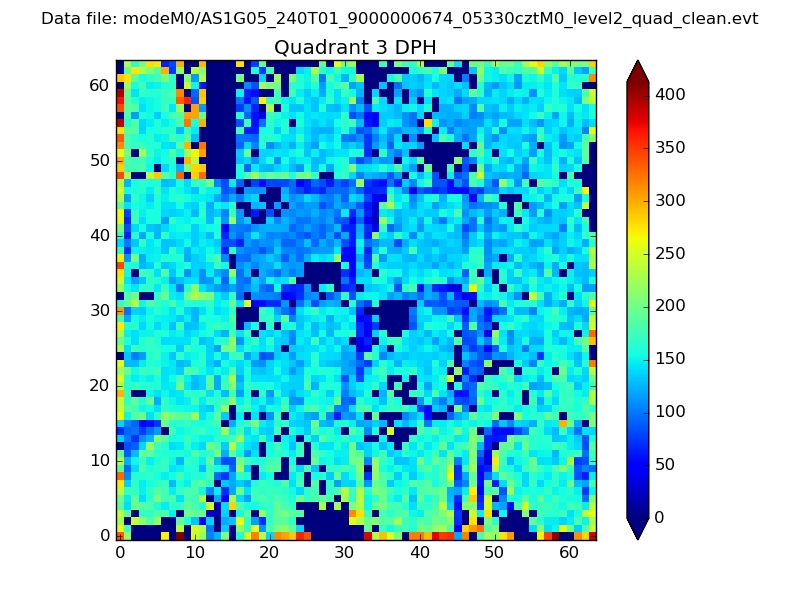 |
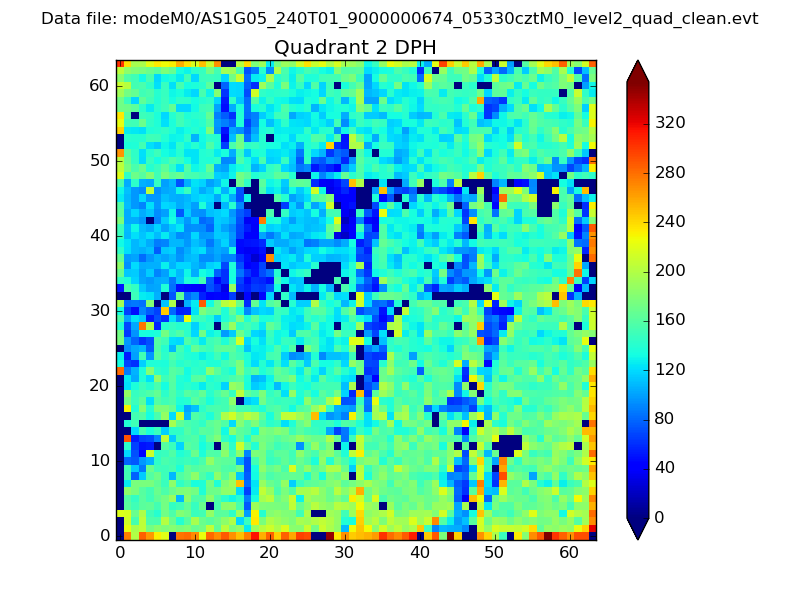 |
Quadrant C |
| Plot type | Count rate plots | Images |
|---|---|---|
| Comparison with Poisson distribution Blue bars denote a histogram of data divided into 1 sec bins. Red curve is a Poisson curve with rate = median count rate of data. |
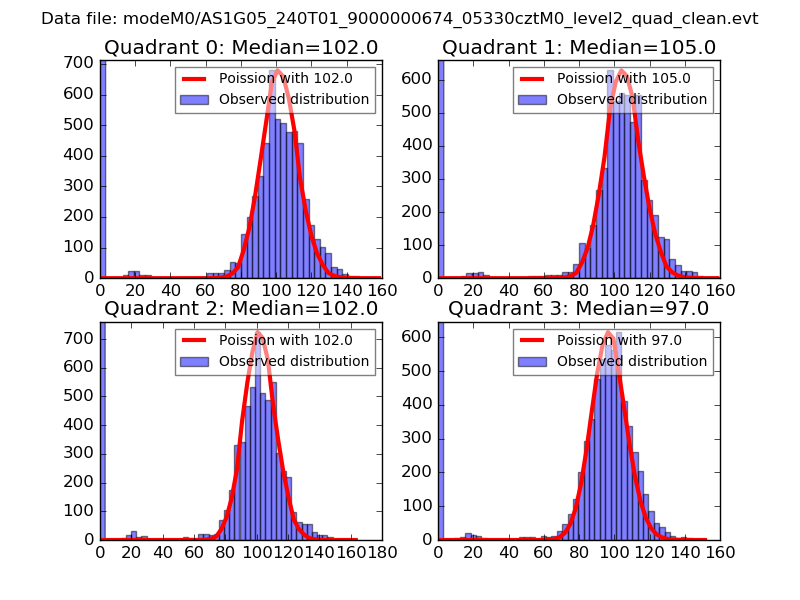 |
 |
| Quadrant-wise count rates Data is divided into 100 sec bins |
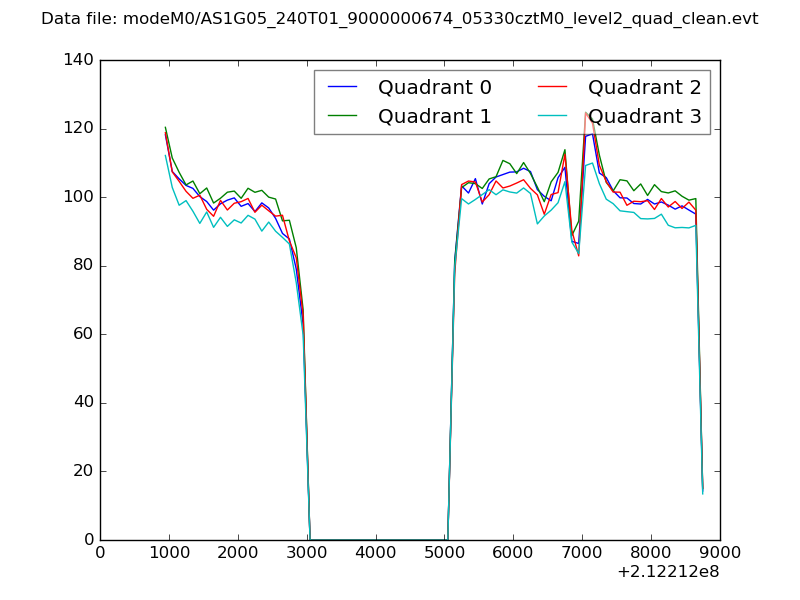 |
|
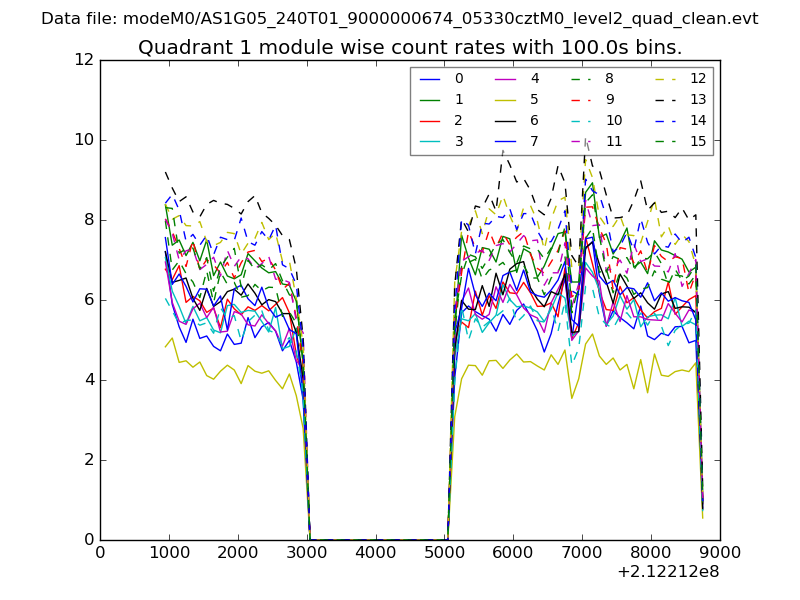
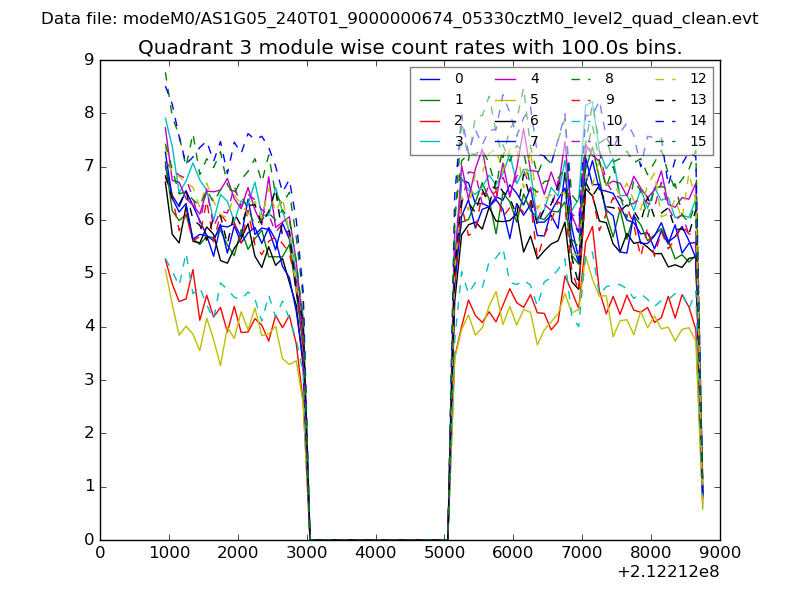
| Module-wise count rates for Quadrant A Data is divided into 100 sec bins |
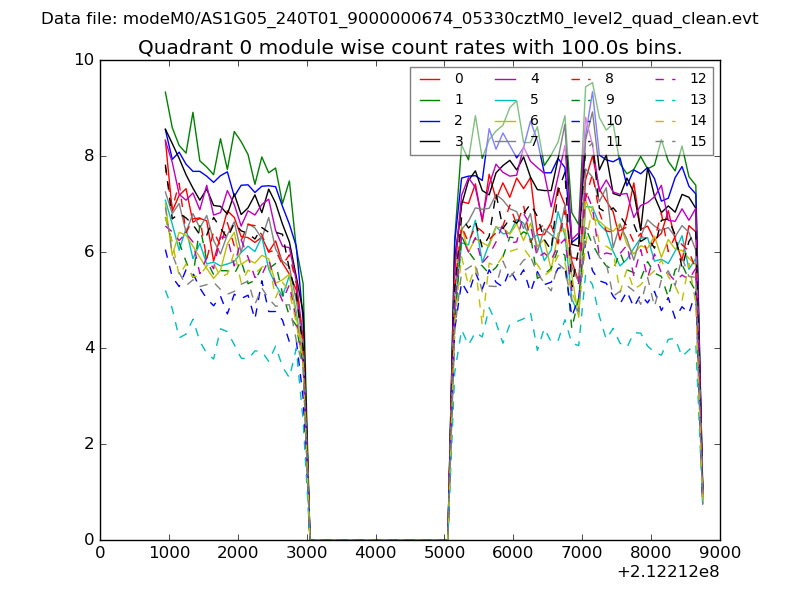 |
 |
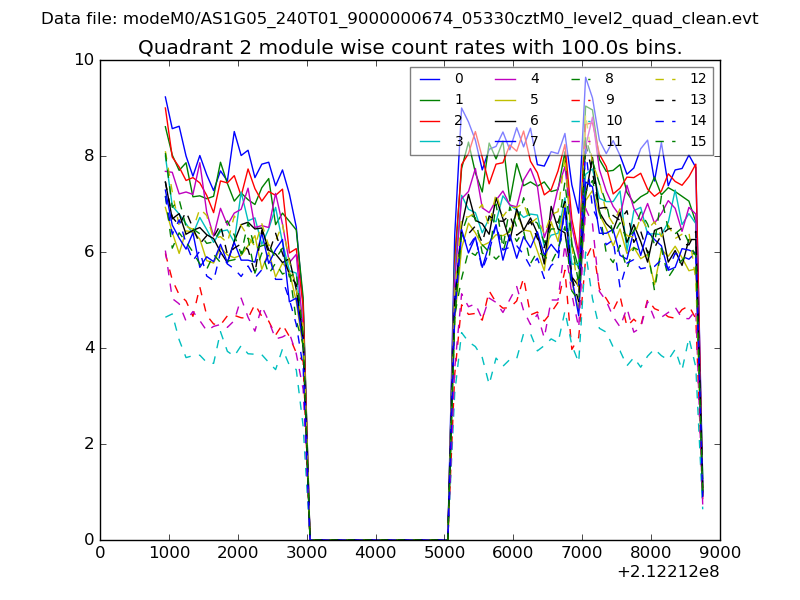
| Module-wise count rates for Quadrant B Data is divided into 100 sec bins |
 |
 |
| Module-wise count rates for Quadrant C Data is divided into 100 sec bins |
 |
 |
| Module-wise count rates for Quadrant D Data is divided into 100 sec bins |
 |
 |
| Parameter | Plot |
|---|---|
| CZT HV Monitor | 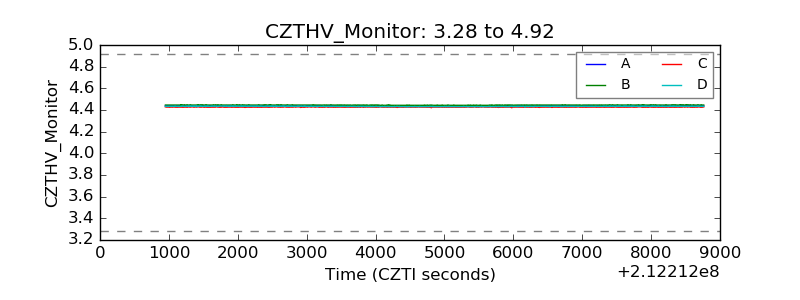 |
| D_VDD | 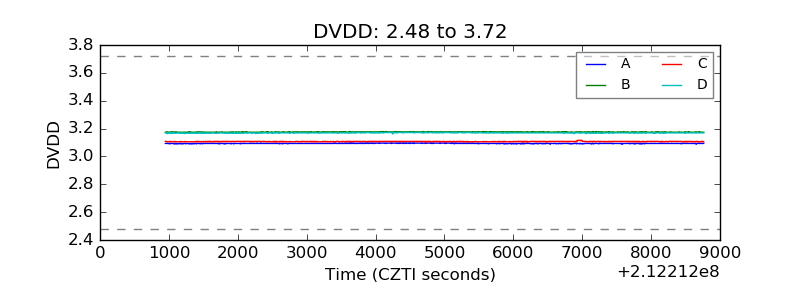 |
| Temperature 1 | 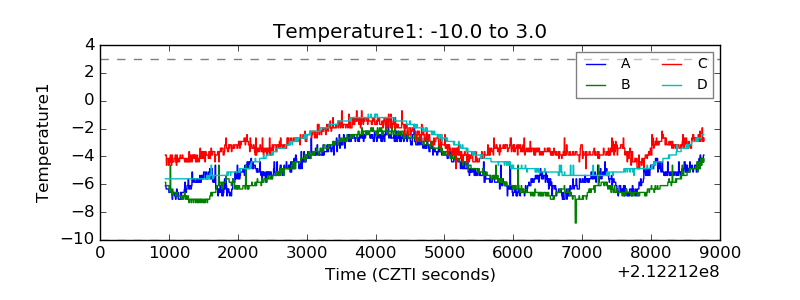 |
| Veto HV Monitor | 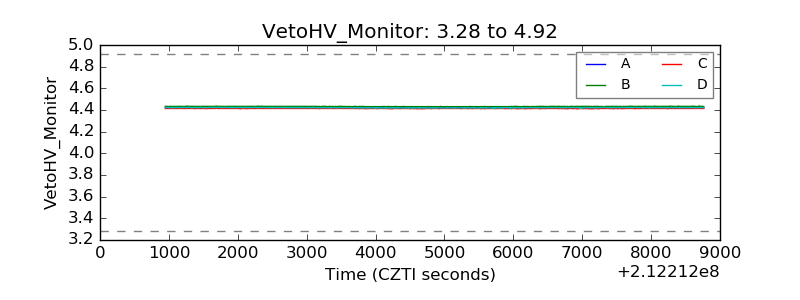 |
| Veto LLD | 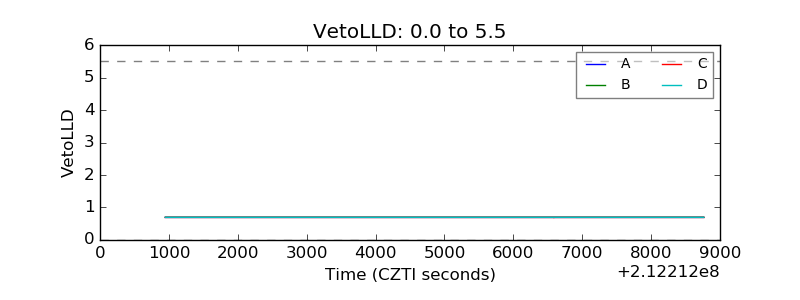 |
| Alpha Counter | 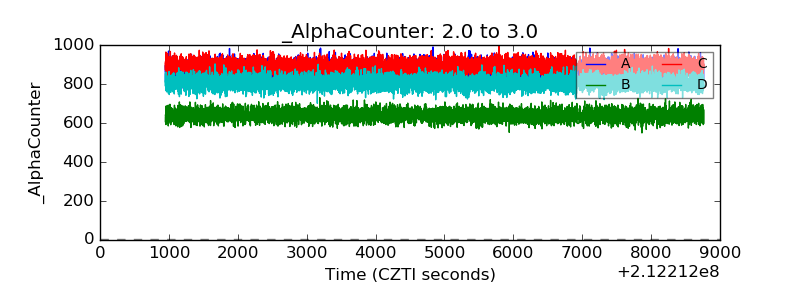 |
| _CPM_Rate | 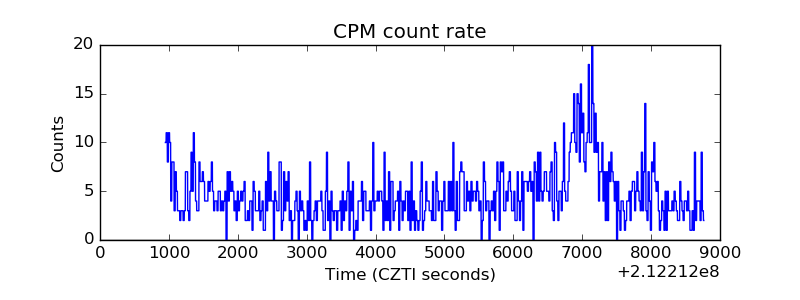 |
| CZT Counter | 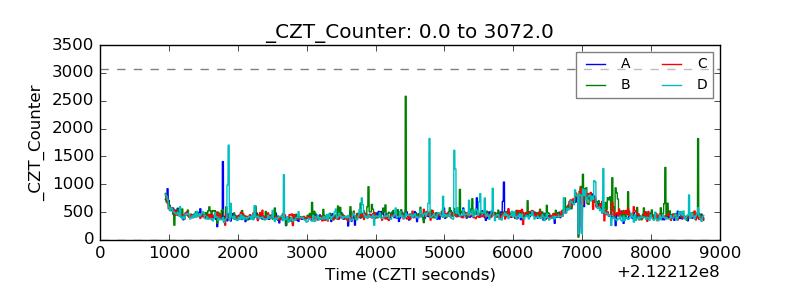 |
| +2.5 Volts monitor |  |
| +5 Volts monitor |  |
| _ROLL_ROT | 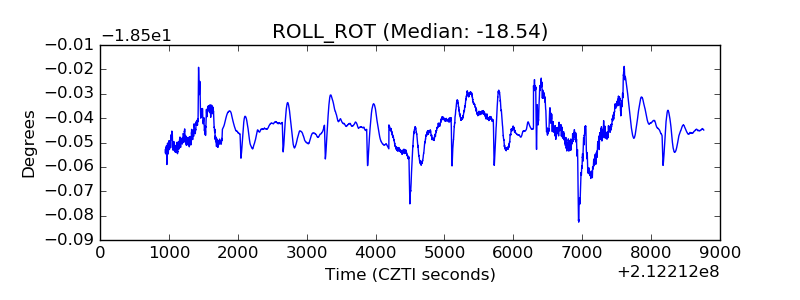 |
| _Roll_DEC | 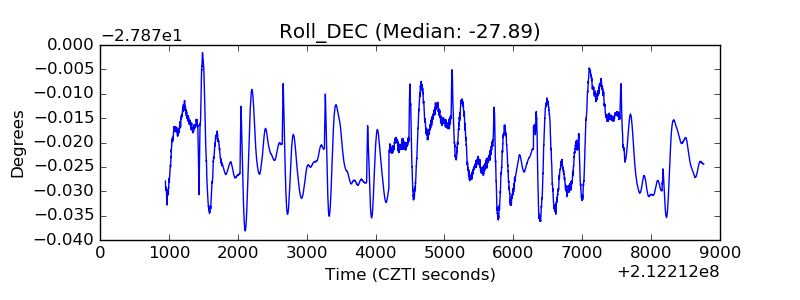 |
| _Roll_RA | 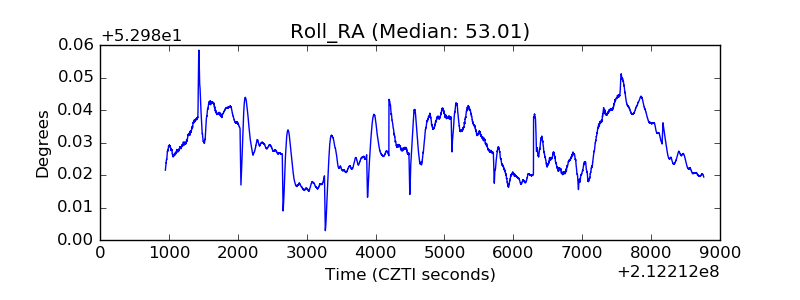 |
| Veto Counter | 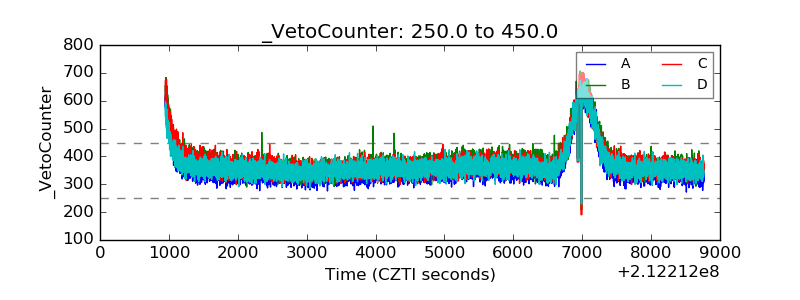 |