| Param | Original file | Final file |
|---|---|---|
| Filename | modeM0/AS1G05_240T01_9000000674_05331cztM0_level2.evt | modeM0/AS1G05_240T01_9000000674_05331cztM0_level2_quad_clean.evt |
| Size (bytes) | 167,290,560 | 19,831,680 |
| Size | 159.5 MB | 18.9 MB |
| Events in quadrant A | 1,153,857 | 99,894 |
| Events in quadrant B | 1,292,768 | 104,448 |
| Events in quadrant C | 1,179,472 | 101,780 |
| Events in quadrant D | 1,250,594 | 96,702 |
| Mode M0 | |||
|---|---|---|---|
| Quadrant | BADHDUFLAG | Total packets | Discarded packets |
| A | 0 | 5649 | 175 |
| B | 0 | 5920 | 165 |
| C | 0 | 5674 | 119 |
| D | 0 | 5883 | 140 |
| Mode SS | |||
|---|---|---|---|
| Quadrant | BADHDUFLAG | Total packets | Discarded packets |
| A | 0 | 58 | 4 |
| B | 0 | 58 | 0 |
| C | 0 | 58 | 2 |
| D | 0 | 58 | 0 |
| Quadrant | Total seconds | Saturated seconds | Saturation percentage |
|---|---|---|---|
| A | 2735 | 3 | 0.109689% |
| B | 2742 | 8 | 0.291758% |
| C | 2761 | 2 | 0.072438% |
| D | 2753 | 6 | 0.217944% |
Noise dominated data is calculated using 1-second bins in cleaned event files. If a bin has >2000 counts, and if more than 50% of those come from <1% of pixels, then it is considered to be noise-dominated and hence unusable.
| Quadrant | # 1 sec bins | Bins with >0 counts | Bins with >2000 counts | High rate bins dominated by noise | Noise dominated (total time) | Noise dominated (detector-on time) | Marked lightcurve |
|---|---|---|---|---|---|---|---|
| A | 2821 | 2812 | 0 | 0 | 0.00% | 0.00% | 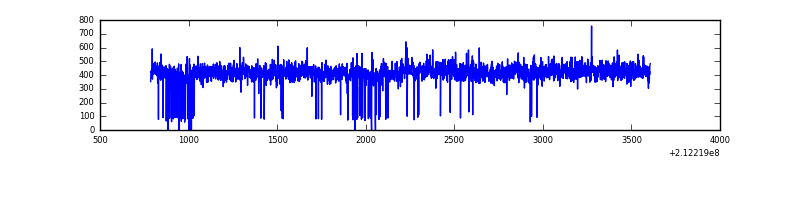 |
| B | 2821 | 2814 | 2 | 2 | 0.07% | 0.07% | 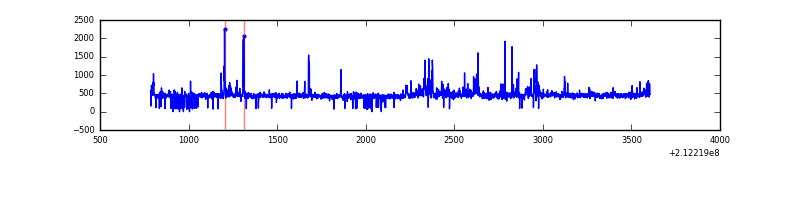 |
| C | 2821 | 2818 | 0 | 0 | 0.00% | 0.00% | 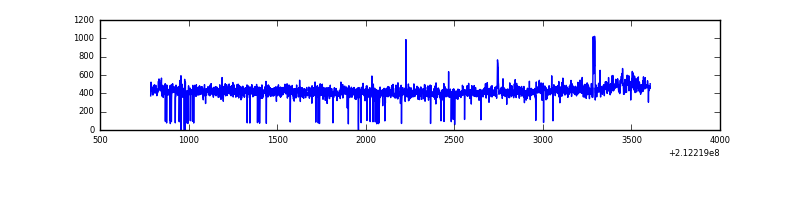 |
| D | 2821 | 2816 | 6 | 6 | 0.21% | 0.21% | 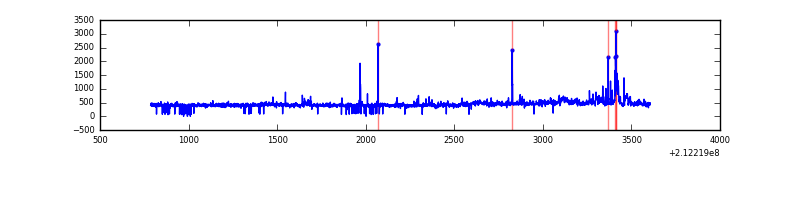 |
Top three noisy pixels from each quadrant. If the there are fewer than three noisy pixels in the level2.evt file, extra rows are filled as -1
| Pixel properties | Quadrant properties | ||||||
|---|---|---|---|---|---|---|---|
| Quadrant | DetID | PixID | Counts | Sigma | Mean | Median | Sigma |
| A | 13 | 251 | 14618 | 229.44 | 295 | 288 | 62.5 |
| A | 12 | 194 | 2987 | 43.21 | 295 | 288 | 62.5 |
| A | 0 | 226 | 2850 | 41.02 | 295 | 288 | 62.5 |
| B | 4 | 80 | 57847 | 979.72 | 297 | 290 | 58.7 |
| B | 4 | 48 | 42524 | 718.9 | 297 | 290 | 58.7 |
| B | 10 | 16 | 16573 | 277.17 | 297 | 290 | 58.7 |
| C | 1 | 16 | 36658 | 527.23 | 292 | 294 | 69.0 |
| C | 13 | 61 | 2293 | 28.98 | 292 | 294 | 69.0 |
| C | 3 | 202 | 741 | 6.48 | 292 | 294 | 69.0 |
| D | 13 | 137 | 51260 | 703.94 | 293 | 284 | 72.4 |
| D | 2 | 16 | 30480 | 416.98 | 293 | 284 | 72.4 |
| D | 2 | 234 | 17394 | 236.27 | 293 | 284 | 72.4 |
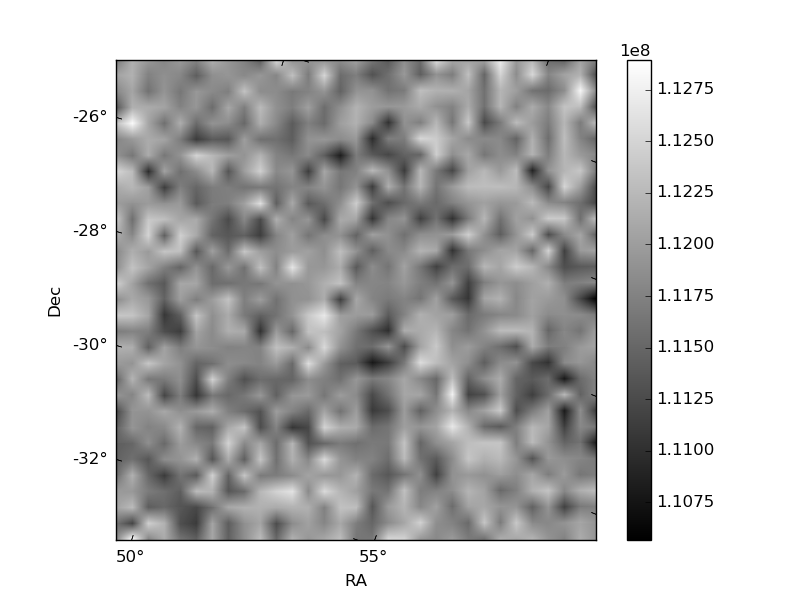
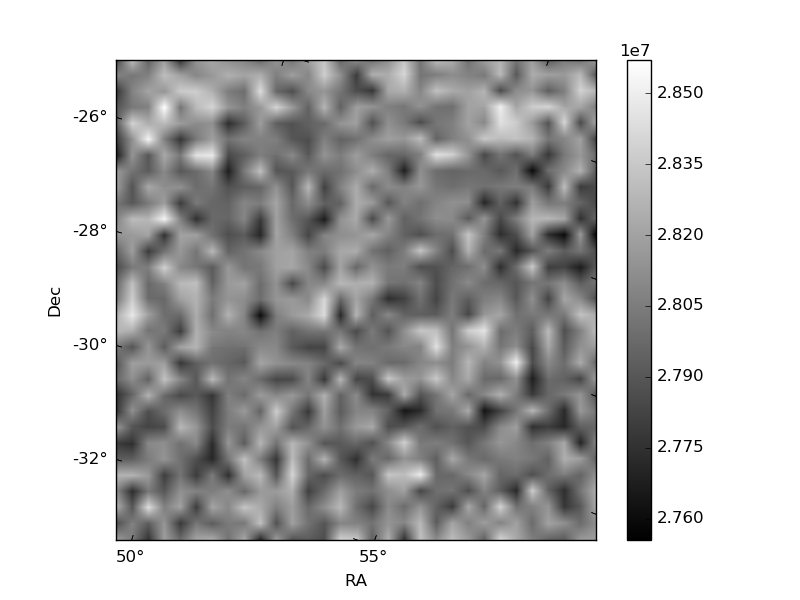
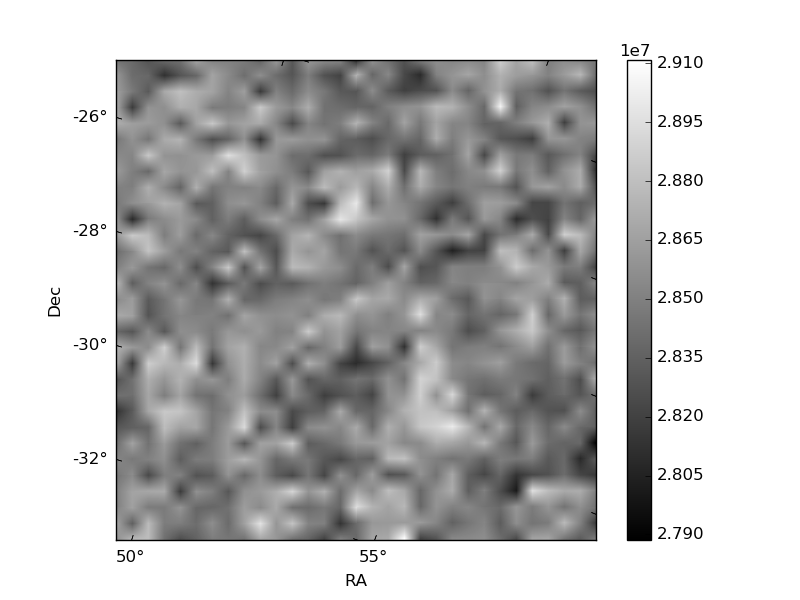
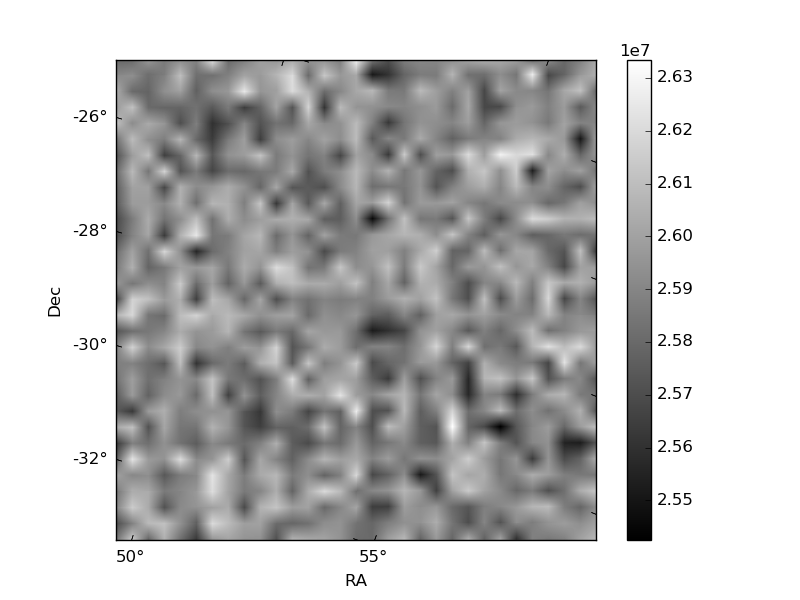
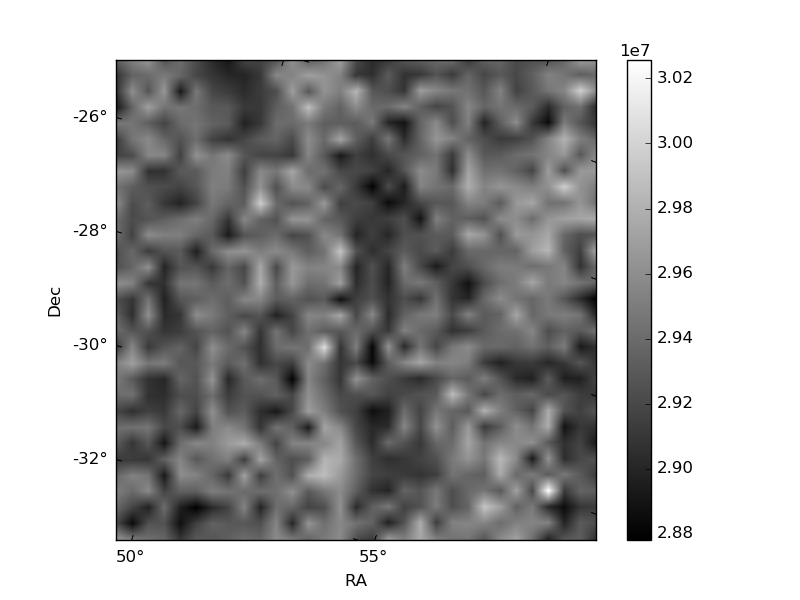
Histogram calculated using DETX and DETY for each event in the final _common_clean file
| Quadrant A | 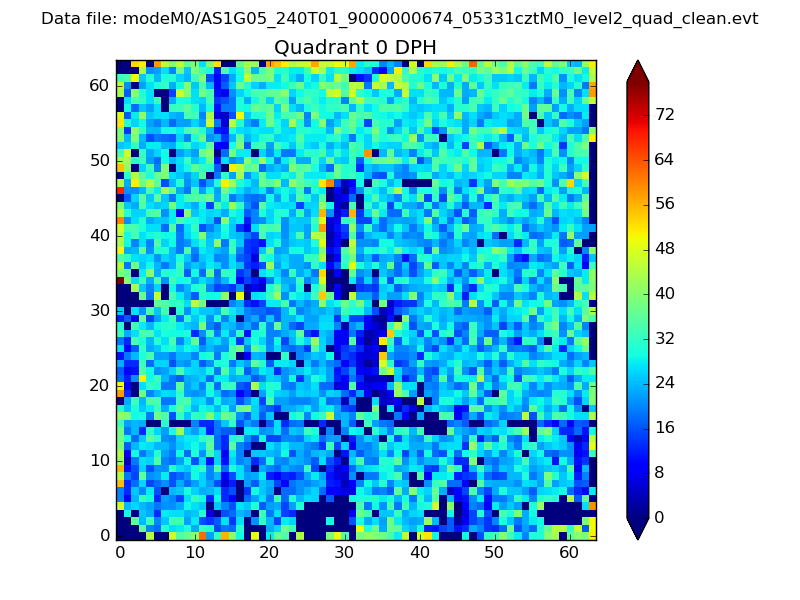 |
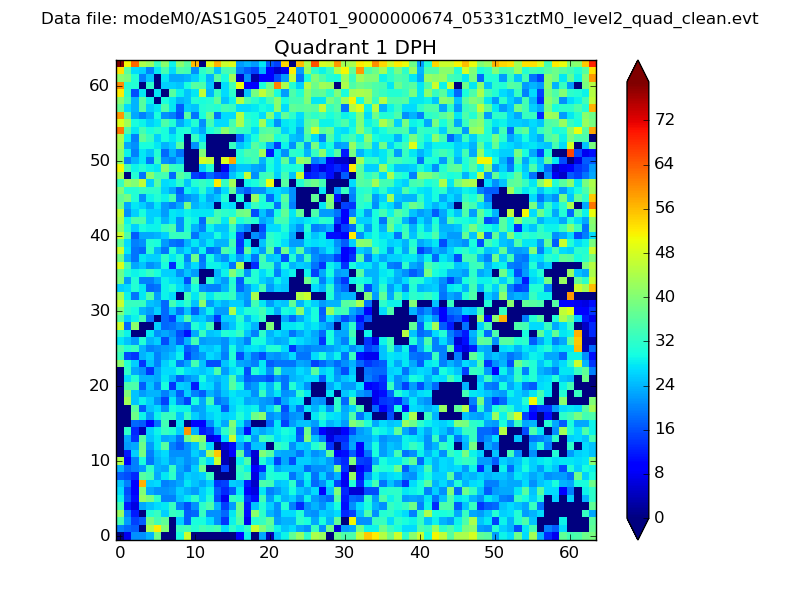 |
Quadrant B |
|---|---|---|---|
| Quadrant D | 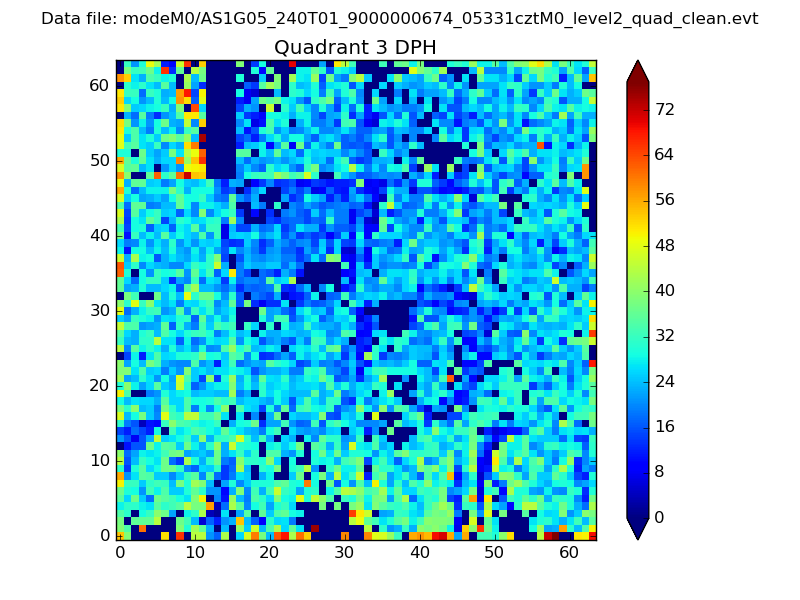 |
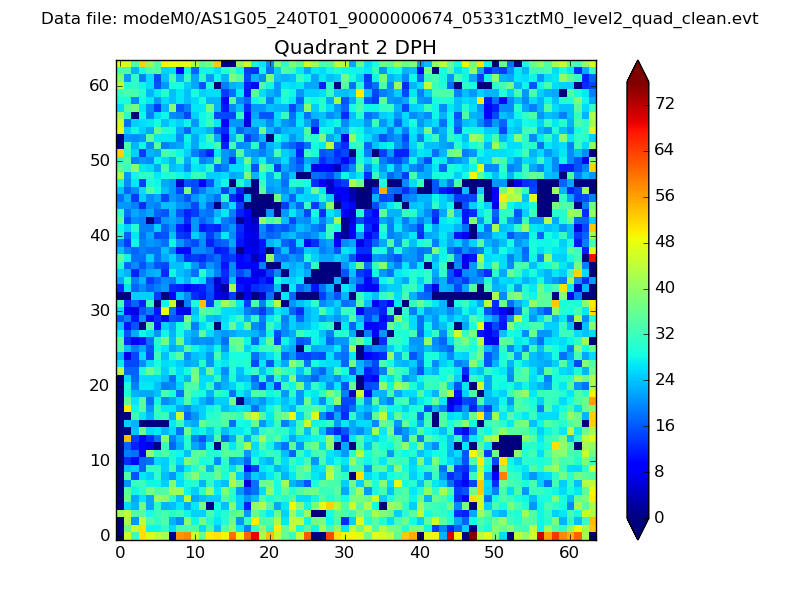 |
Quadrant C |
| Plot type | Count rate plots | Images |
|---|---|---|
| Comparison with Poisson distribution Blue bars denote a histogram of data divided into 1 sec bins. Red curve is a Poisson curve with rate = median count rate of data. |
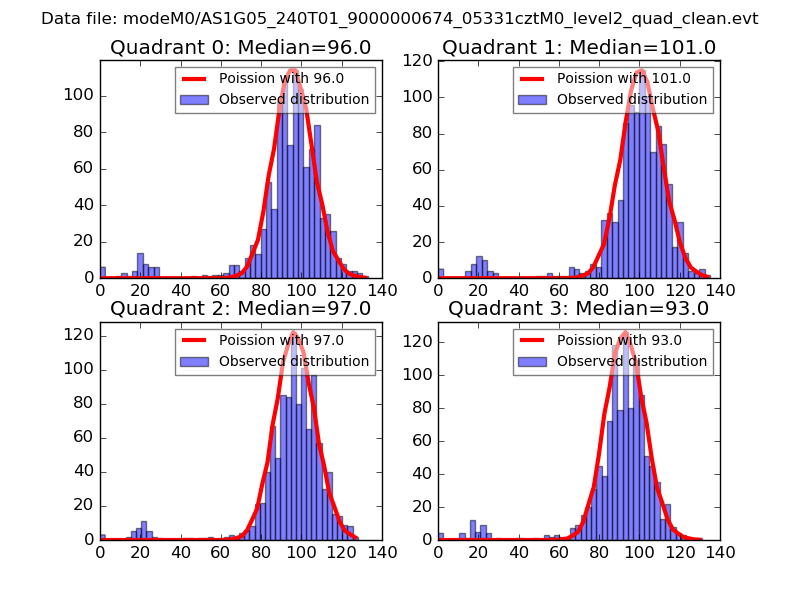 |
 |
| Quadrant-wise count rates Data is divided into 100 sec bins |
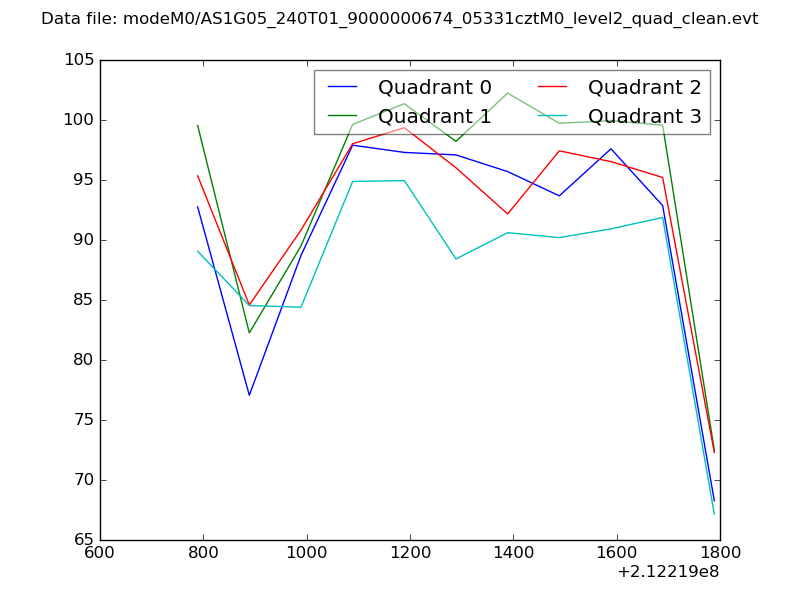 |
|
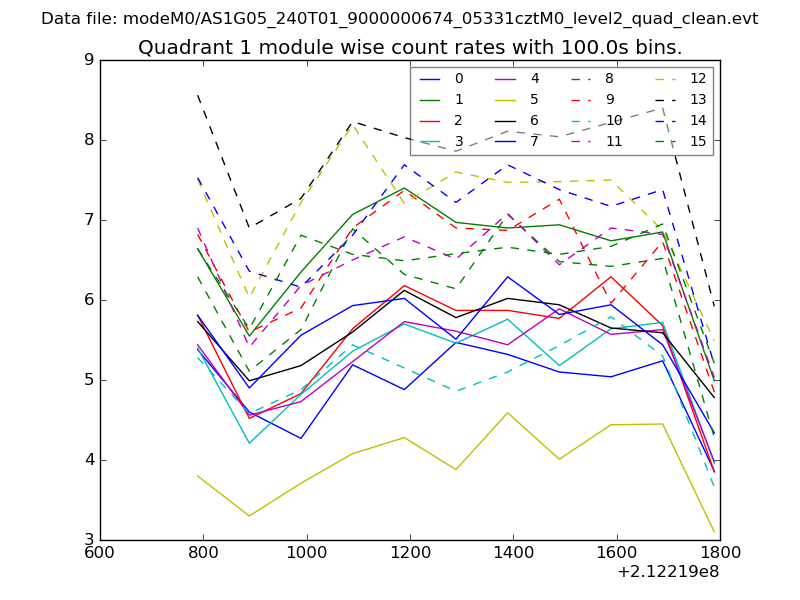
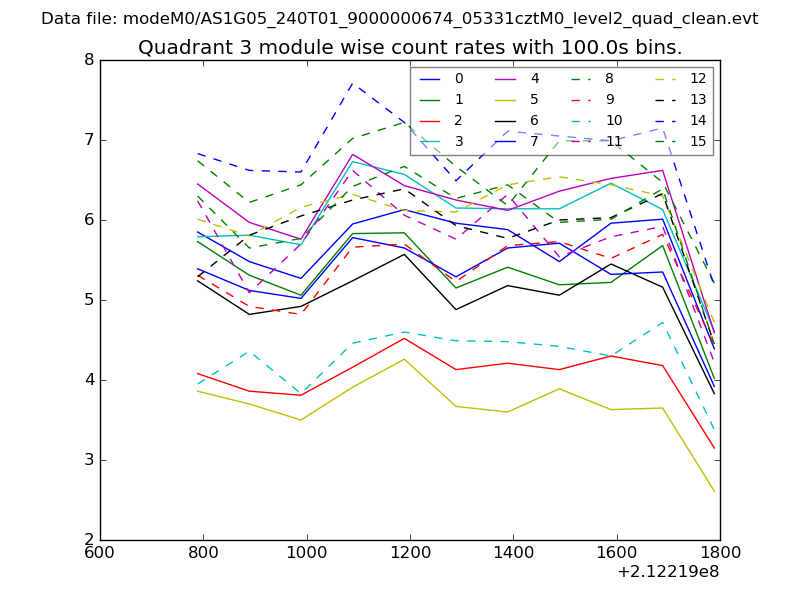
| Module-wise count rates for Quadrant A Data is divided into 100 sec bins |
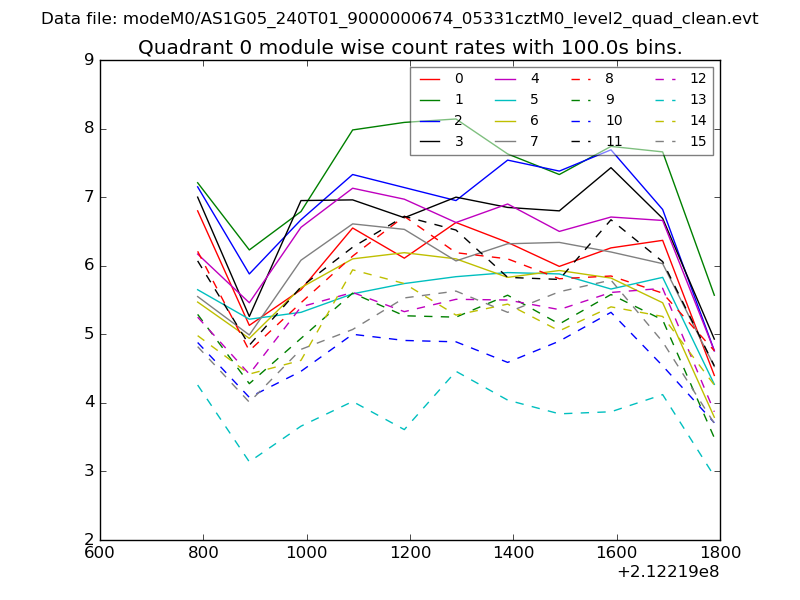 |
 |
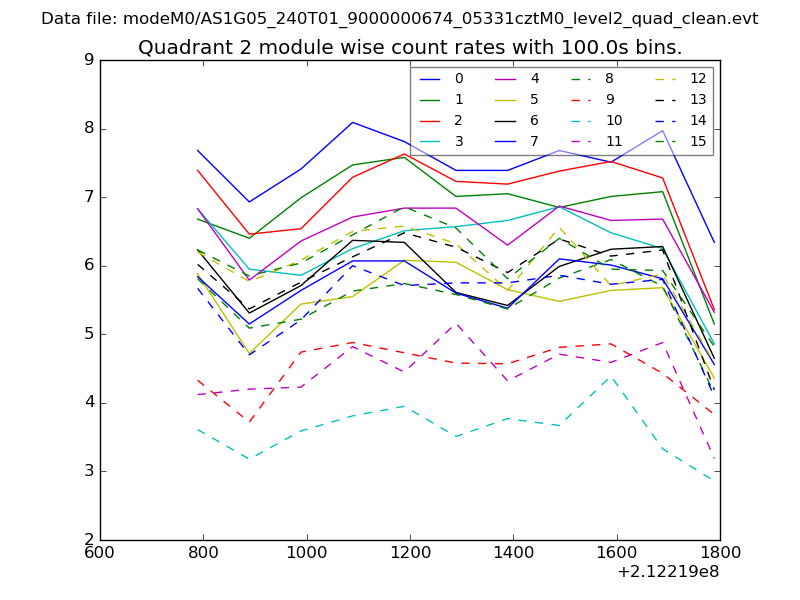
| Module-wise count rates for Quadrant B Data is divided into 100 sec bins |
 |
 |
| Module-wise count rates for Quadrant C Data is divided into 100 sec bins |
 |
 |
| Module-wise count rates for Quadrant D Data is divided into 100 sec bins |
 |
 |
| Parameter | Plot |
|---|---|
| CZT HV Monitor | 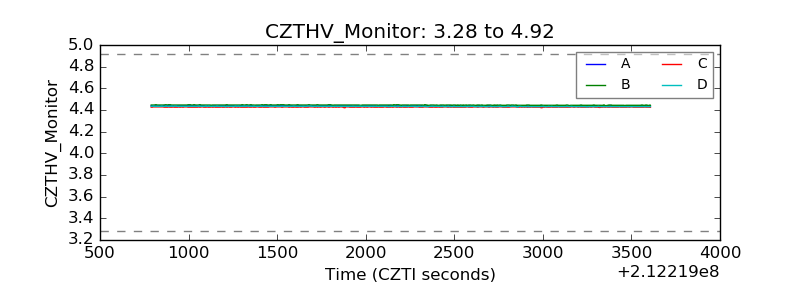 |
| D_VDD | 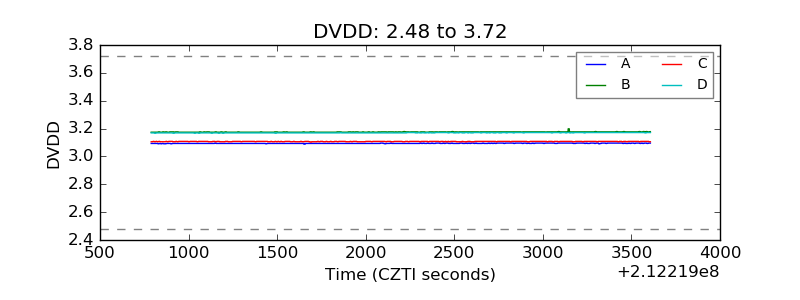 |
| Temperature 1 | 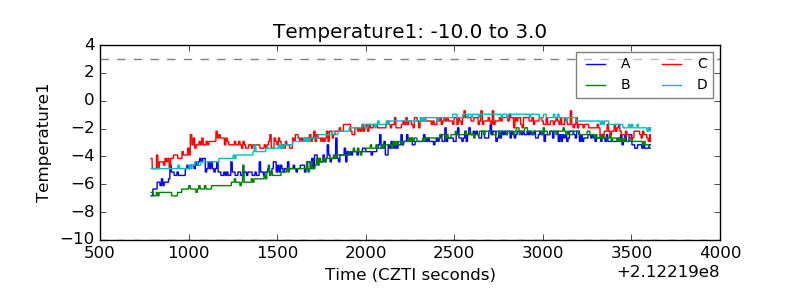 |
| Veto HV Monitor | 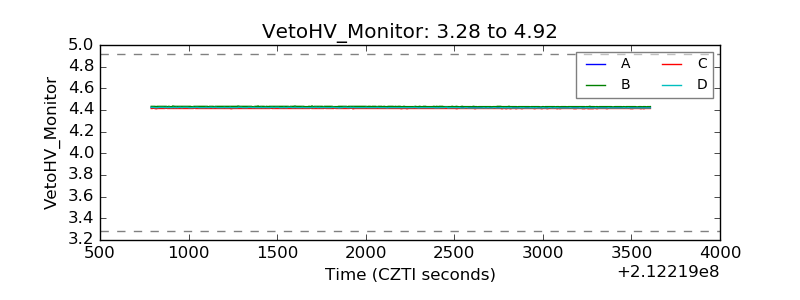 |
| Veto LLD | 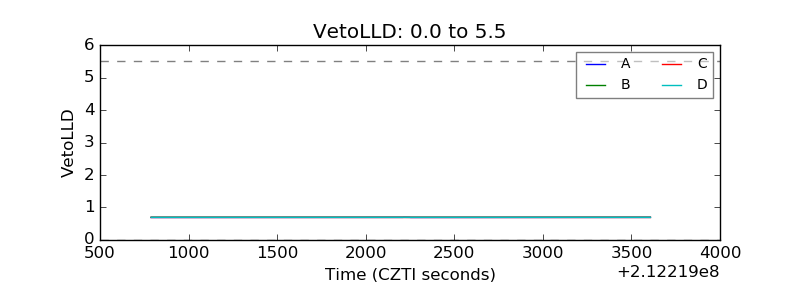 |
| Alpha Counter | 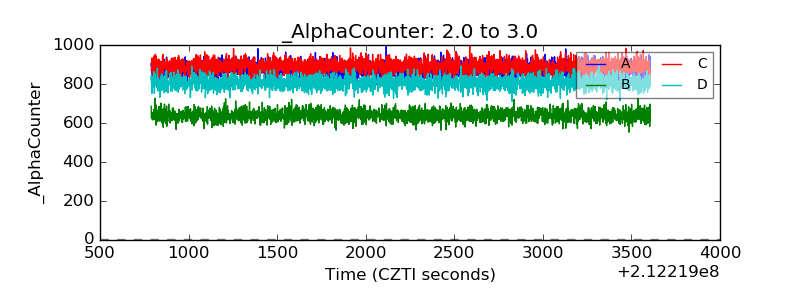 |
| _CPM_Rate | 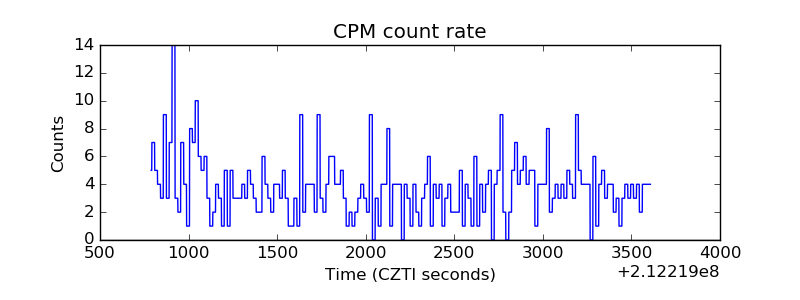 |
| CZT Counter | 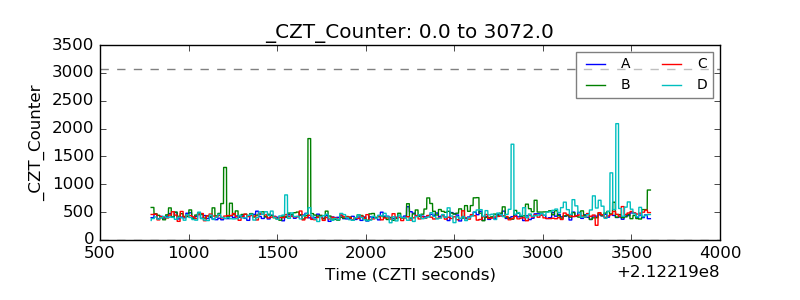 |
| +2.5 Volts monitor |  |
| +5 Volts monitor |  |
| _ROLL_ROT | 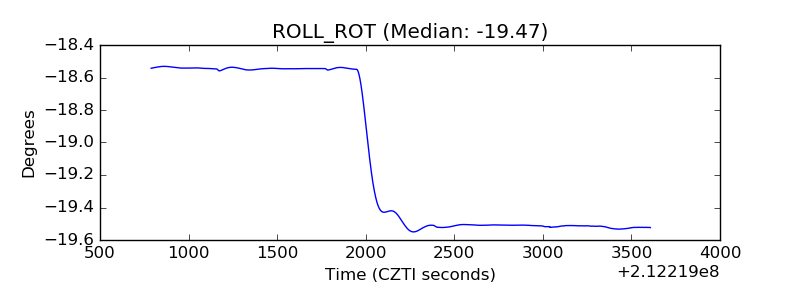 |
| _Roll_DEC | 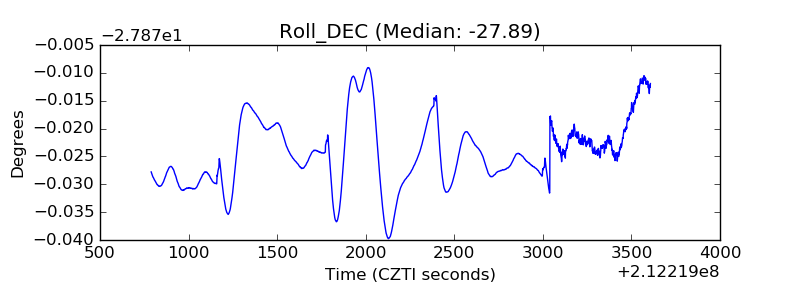 |
| _Roll_RA | 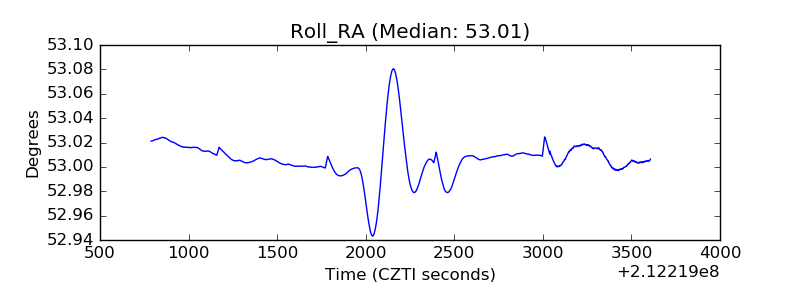 |
| Veto Counter | 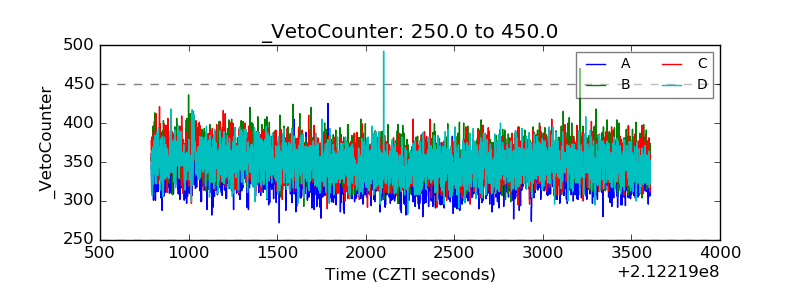 |