| Param | Original file | Final file |
|---|---|---|
| Filename | modeM0/AS1G05_240T01_9000000674_05335cztM0_level2.evt | modeM0/AS1G05_240T01_9000000674_05335cztM0_level2_quad_clean.evt |
| Size (bytes) | 1,208,560,320 | 180,095,040 |
| Size | 1.1 GB | 171.8 MB |
| Events in quadrant A | 8,205,989 | 1,065,621 |
| Events in quadrant B | 8,801,792 | 1,093,805 |
| Events in quadrant C | 9,806,563 | 1,051,866 |
| Events in quadrant D | 8,589,938 | 1,023,668 |
| Mode M0 | |||
|---|---|---|---|
| Quadrant | BADHDUFLAG | Total packets | Discarded packets |
| A | 0 | 38578 | 1457 |
| B | 0 | 39565 | 1580 |
| C | 0 | 43013 | 2074 |
| D | 0 | 39807 | 1526 |
| Mode SS | |||
|---|---|---|---|
| Quadrant | BADHDUFLAG | Total packets | Discarded packets |
| A | 0 | 372 | 14 |
| B | 0 | 372 | 10 |
| C | 0 | 372 | 22 |
| D | 0 | 372 | 12 |
| Mode M9 | |||
|---|---|---|---|
| Quadrant | BADHDUFLAG | Total packets | Discarded packets |
| A | 0 | 8 | 0 |
| B | 0 | 8 | 0 |
| C | 0 | 8 | 0 |
| D | 0 | 8 | 1 |
| Quadrant | Total seconds | Saturated seconds | Saturation percentage |
|---|---|---|---|
| A | 17694 | 415 | 2.345428% |
| B | 17693 | 440 | 2.486859% |
| C | 17585 | 250 | 1.421666% |
| D | 17727 | 364 | 2.053365% |
Noise dominated data is calculated using 1-second bins in cleaned event files. If a bin has >2000 counts, and if more than 50% of those come from <1% of pixels, then it is considered to be noise-dominated and hence unusable.
| Quadrant | # 1 sec bins | Bins with >0 counts | Bins with >2000 counts | High rate bins dominated by noise | Noise dominated (total time) | Noise dominated (detector-on time) | Marked lightcurve |
|---|---|---|---|---|---|---|---|
| A | 19158 | 18331 | 72 | 72 | 0.38% | 0.39% | 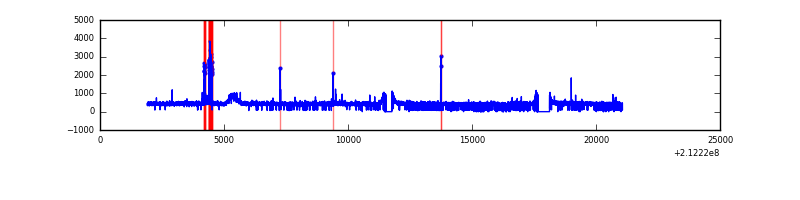 |
| B | 19158 | 18309 | 58 | 58 | 0.30% | 0.32% | 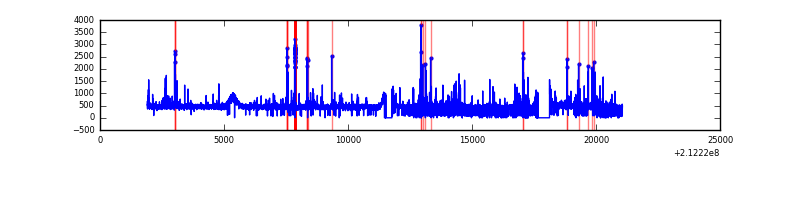 |
| C | 19158 | 18287 | 0 | 0 | 0.00% | 0.00% | 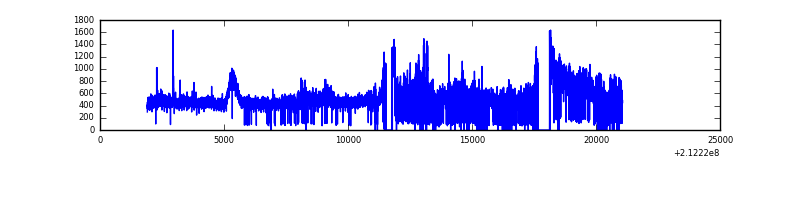 |
| D | 19158 | 18321 | 97 | 97 | 0.51% | 0.53% | 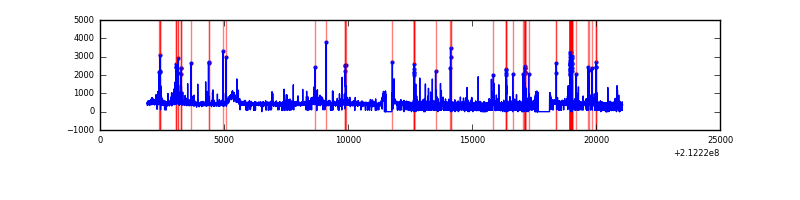 |
Top three noisy pixels from each quadrant. If the there are fewer than three noisy pixels in the level2.evt file, extra rows are filled as -1
| Pixel properties | Quadrant properties | ||||||
|---|---|---|---|---|---|---|---|
| Quadrant | DetID | PixID | Counts | Sigma | Mean | Median | Sigma |
| A | 0 | 50 | 282240 | 660.62 | 2053 | 2005 | 424.2 |
| A | 12 | 194 | 20537 | 43.69 | 2053 | 2005 | 424.2 |
| A | 0 | 226 | 19745 | 41.82 | 2053 | 2005 | 424.2 |
| B | 10 | 16 | 347585 | 855.14 | 2078 | 2022 | 404.1 |
| B | 4 | 80 | 151946 | 371.01 | 2078 | 2022 | 404.1 |
| B | 15 | 204 | 74301 | 178.86 | 2078 | 2022 | 404.1 |
| C | 1 | 16 | 2000543 | 4329.62 | 1989 | 1996 | 461.6 |
| C | 14 | 67 | 25415 | 50.73 | 1989 | 1996 | 461.6 |
| C | 13 | 61 | 16149 | 30.66 | 1989 | 1996 | 461.6 |
| D | 4 | 95 | 228532 | 462.46 | 2005 | 1938 | 490.0 |
| D | 2 | 234 | 177466 | 358.24 | 2005 | 1938 | 490.0 |
| D | 2 | 14 | 117128 | 235.09 | 2005 | 1938 | 490.0 |
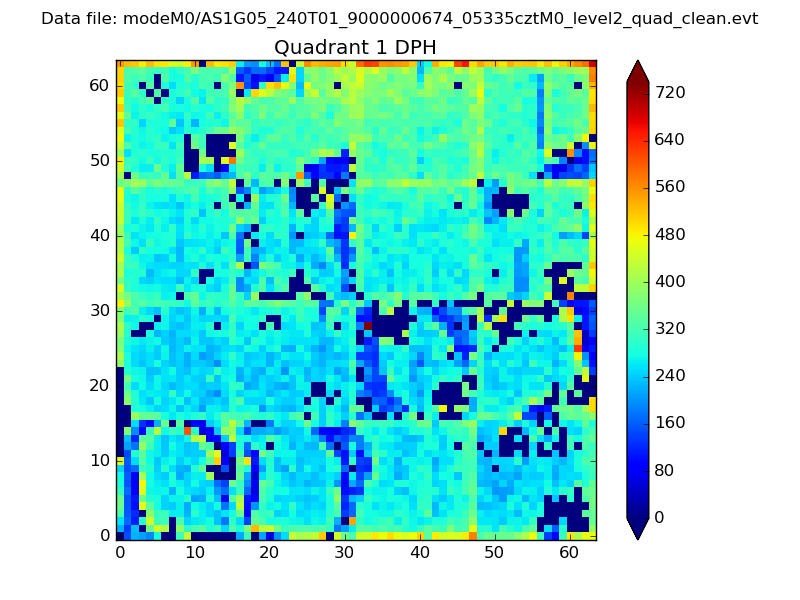
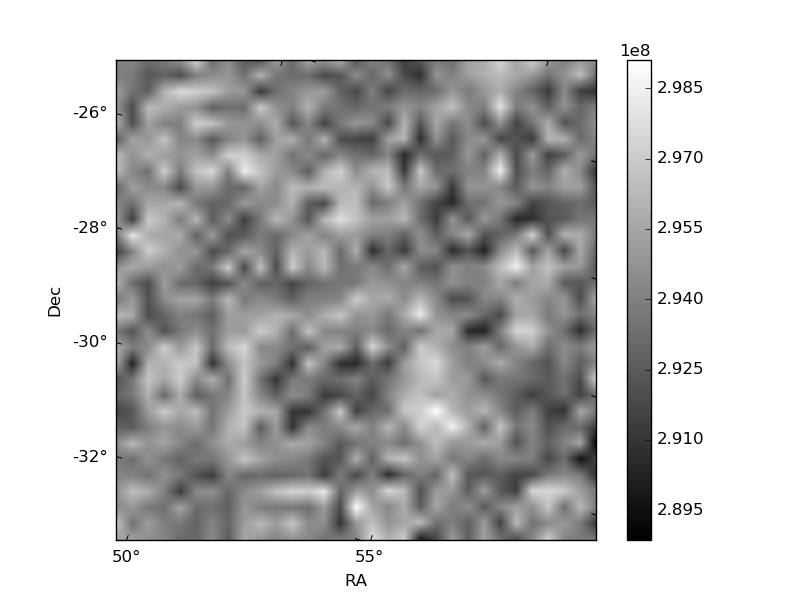
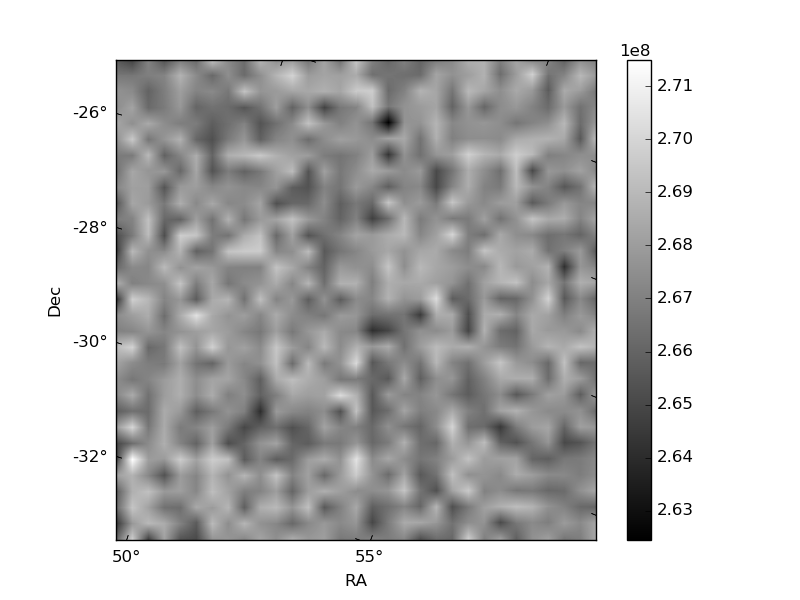
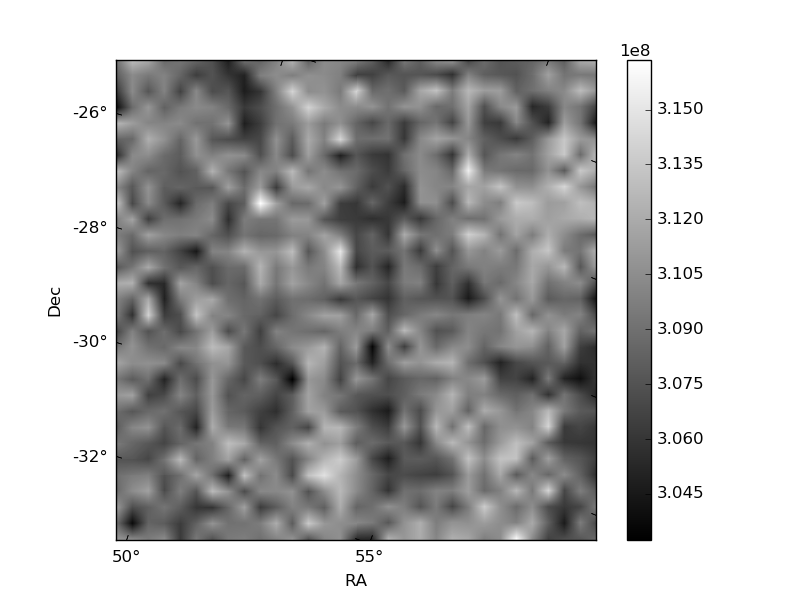
Histogram calculated using DETX and DETY for each event in the final _common_clean file
| Quadrant A |  |
 |
Quadrant B |
|---|---|---|---|
| Quadrant D | 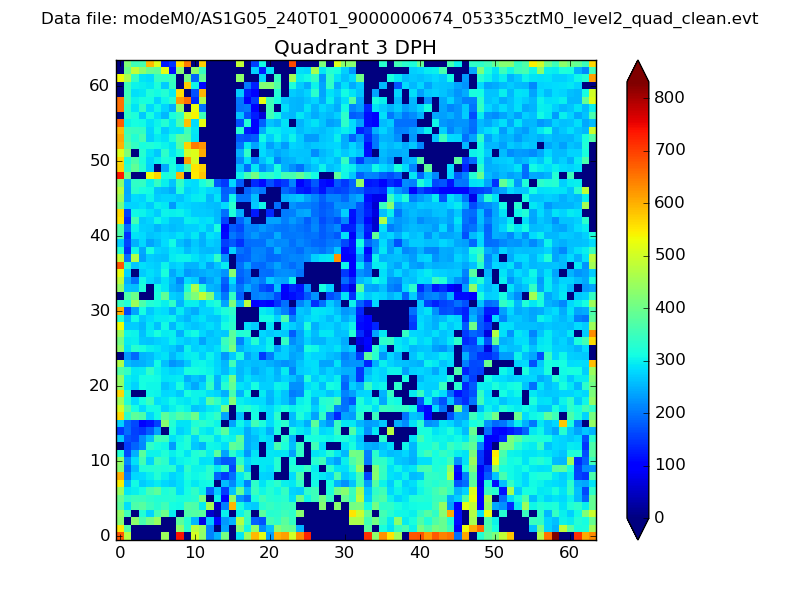 |
 |
Quadrant C |
| Plot type | Count rate plots | Images |
|---|---|---|
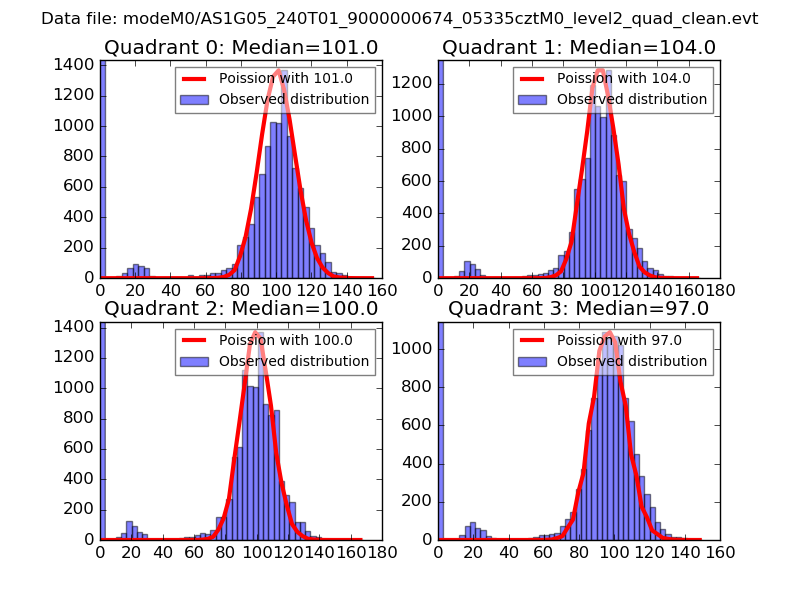
| Comparison with Poisson distribution Blue bars denote a histogram of data divided into 1 sec bins. Red curve is a Poisson curve with rate = median count rate of data. |
 |
 |
| Quadrant-wise count rates Data is divided into 100 sec bins |
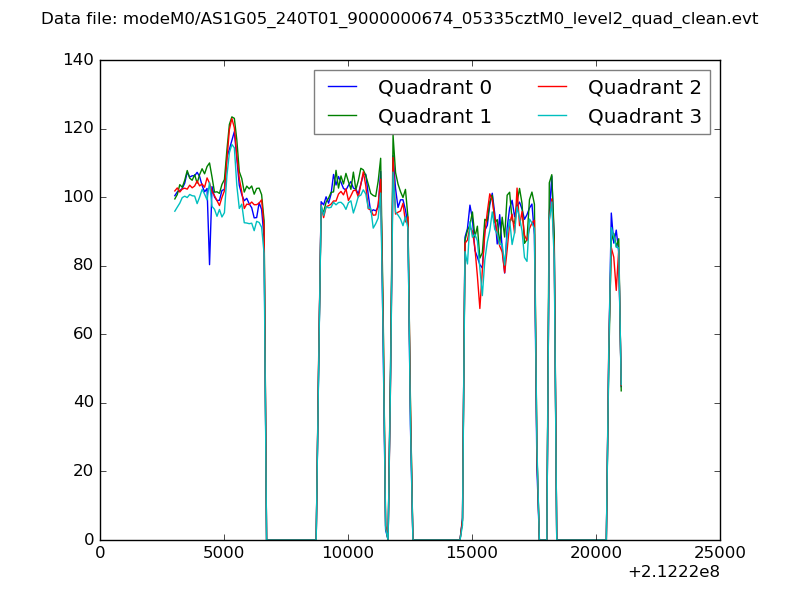 |
|
| Module-wise count rates for Quadrant A Data is divided into 100 sec bins |
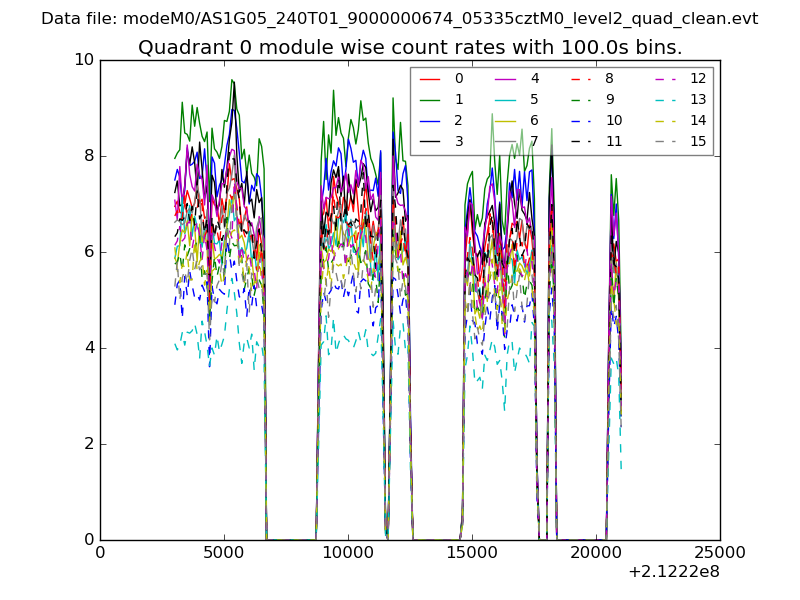 |
 |
| Module-wise count rates for Quadrant B Data is divided into 100 sec bins |
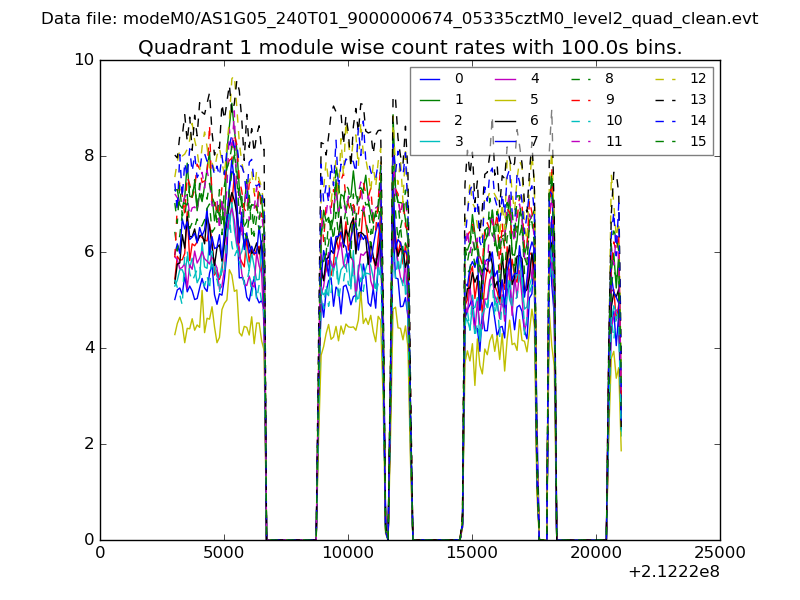 |
 |
| Module-wise count rates for Quadrant C Data is divided into 100 sec bins |
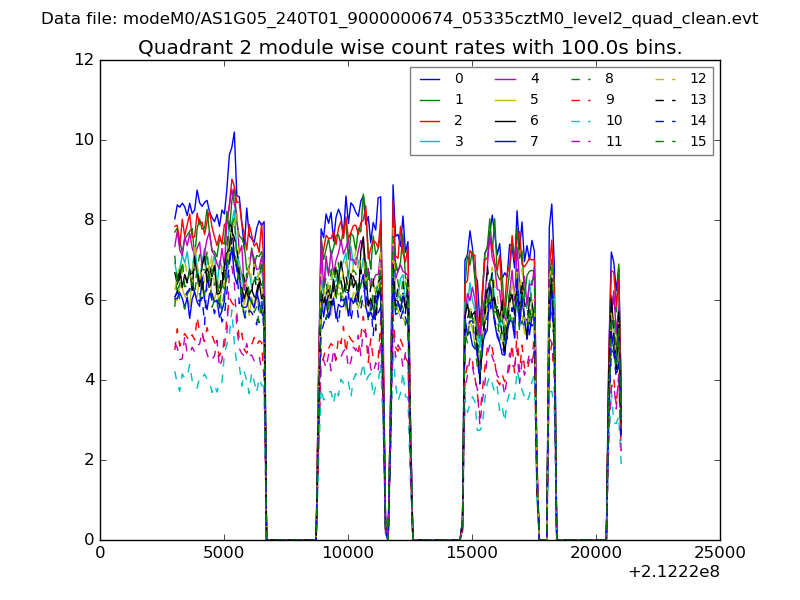 |
 |
| Module-wise count rates for Quadrant D Data is divided into 100 sec bins |
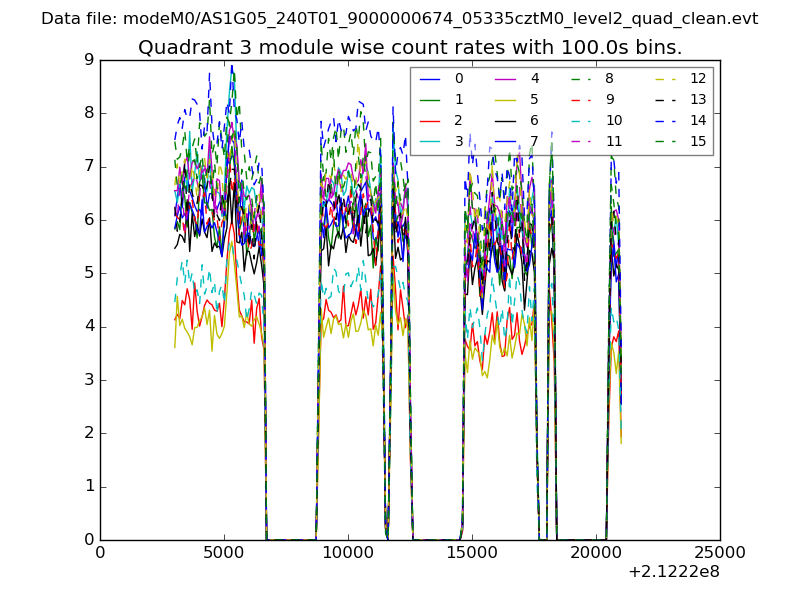 |
 |
| Parameter | Plot |
|---|---|
| CZT HV Monitor | 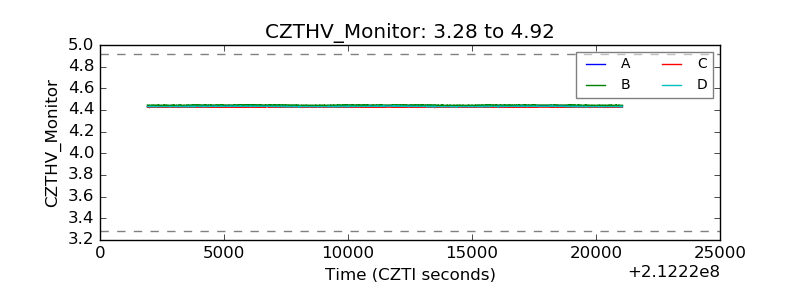 |
| D_VDD | 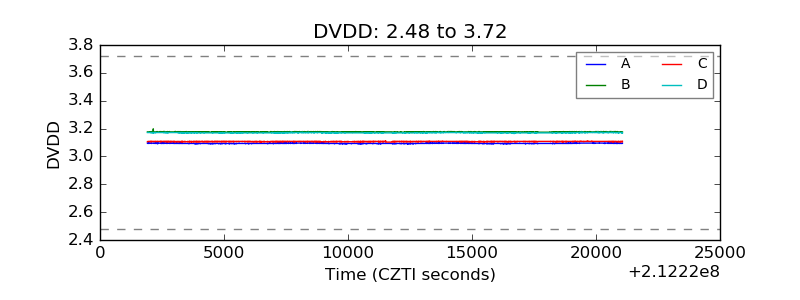 |
| Temperature 1 | 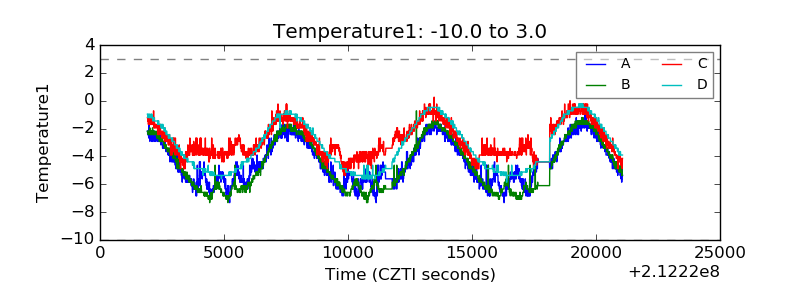 |
| Veto HV Monitor | 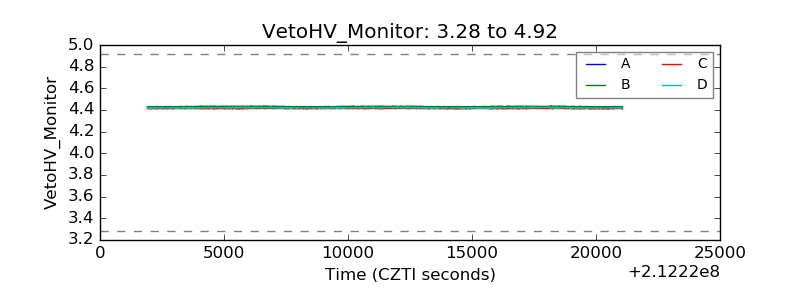 |
| Veto LLD | 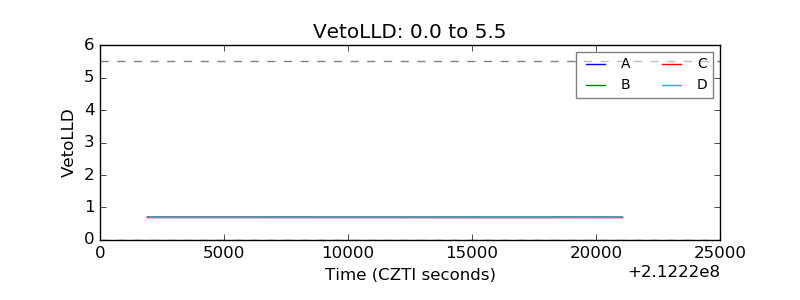 |
| Alpha Counter | 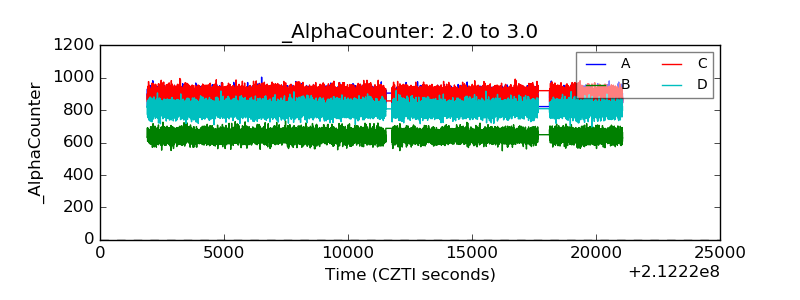 |
| _CPM_Rate | 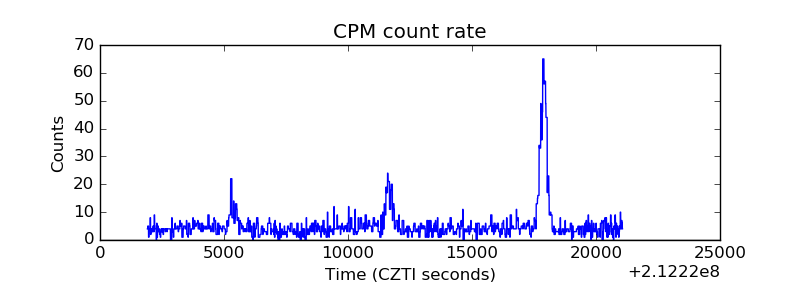 |
| CZT Counter | 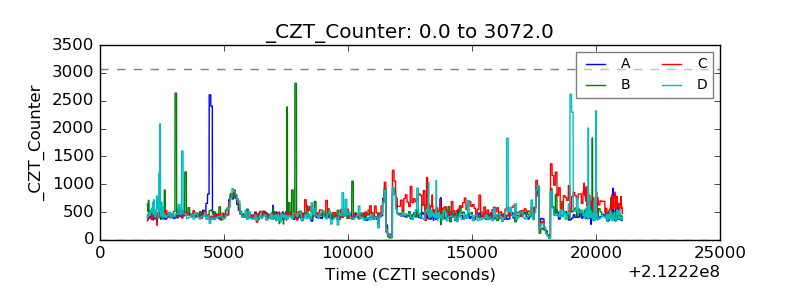 |
| +2.5 Volts monitor |  |
| +5 Volts monitor |  |
| _ROLL_ROT | 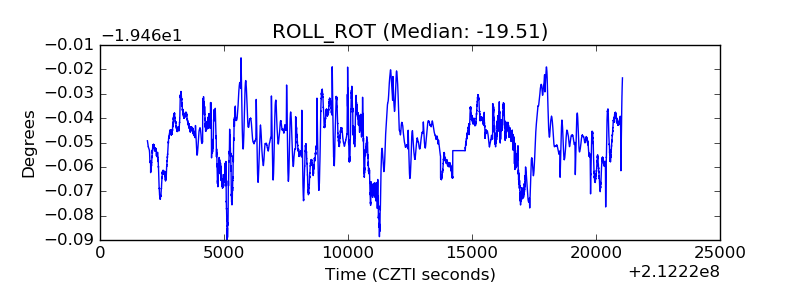 |
| _Roll_DEC |  |
| _Roll_RA | 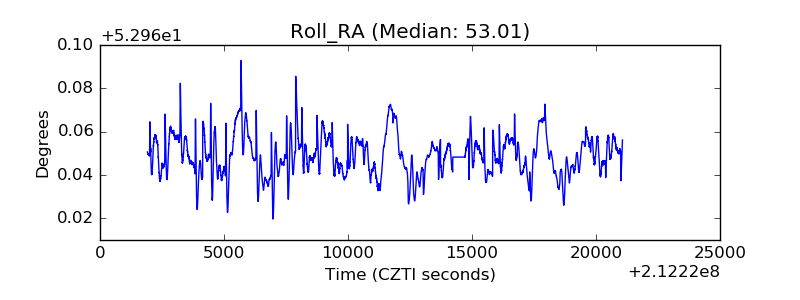 |
| Veto Counter | 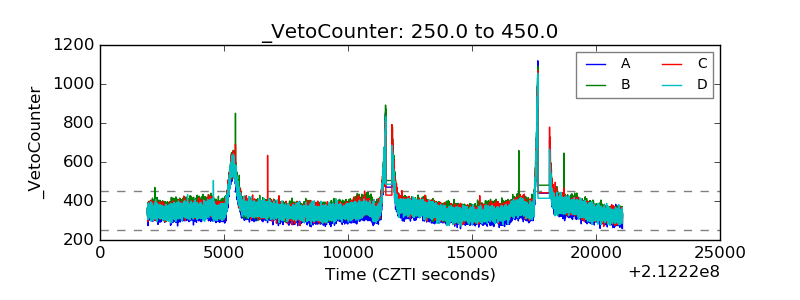 |