| Param | Original file | Final file |
|---|---|---|
| Filename | modeM0/AS1G05_240T01_9000000674_05336cztM0_level2.evt | modeM0/AS1G05_240T01_9000000674_05336cztM0_level2_quad_clean.evt |
| Size (bytes) | 1,161,838,080 | 174,991,680 |
| Size | 1.1 GB | 166.9 MB |
| Events in quadrant A | 7,452,089 | 1,054,756 |
| Events in quadrant B | 8,174,314 | 1,075,315 |
| Events in quadrant C | 10,519,264 | 1,016,924 |
| Events in quadrant D | 7,916,674 | 1,007,504 |
| Mode M0 | |||
|---|---|---|---|
| Quadrant | BADHDUFLAG | Total packets | Discarded packets |
| A | 0 | 37907 | 3766 |
| B | 0 | 39418 | 3729 |
| C | 0 | 48839 | 6405 |
| D | 0 | 39772 | 4195 |
| Mode SS | |||
|---|---|---|---|
| Quadrant | BADHDUFLAG | Total packets | Discarded packets |
| A | 0 | 375 | 29 |
| B | 0 | 376 | 36 |
| C | 0 | 376 | 34 |
| D | 0 | 376 | 36 |
| Mode M9 | |||
|---|---|---|---|
| Quadrant | BADHDUFLAG | Total packets | Discarded packets |
| A | 0 | 26 | 3 |
| B | 0 | 27 | 1 |
| C | 0 | 26 | 0 |
| D | 0 | 26 | 0 |
| Quadrant | Total seconds | Saturated seconds | Saturation percentage |
|---|---|---|---|
| A | 16657 | 193 | 1.158672% |
| B | 16704 | 271 | 1.622366% |
| C | 16239 | 217 | 1.336289% |
| D | 16654 | 195 | 1.170890% |
Noise dominated data is calculated using 1-second bins in cleaned event files. If a bin has >2000 counts, and if more than 50% of those come from <1% of pixels, then it is considered to be noise-dominated and hence unusable.
| Quadrant | # 1 sec bins | Bins with >0 counts | Bins with >2000 counts | High rate bins dominated by noise | Noise dominated (total time) | Noise dominated (detector-on time) | Marked lightcurve |
|---|---|---|---|---|---|---|---|
| A | 37884 | 17894 | 8 | 8 | 0.02% | 0.04% | 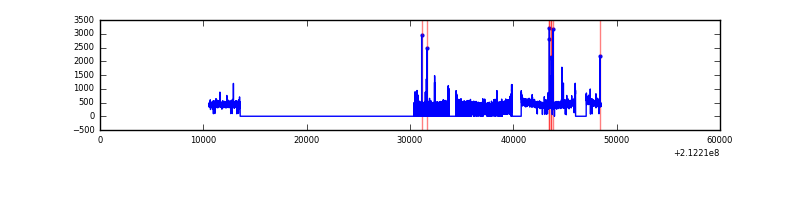 |
| B | 37884 | 17913 | 46 | 46 | 0.12% | 0.26% | 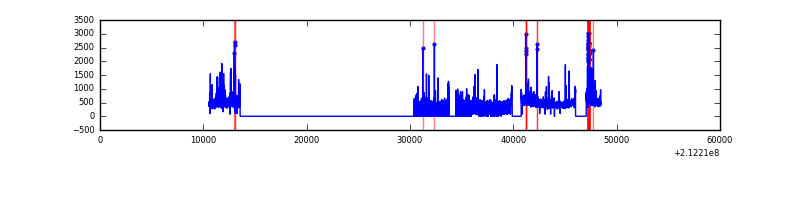 |
| C | 37884 | 17573 | 0 | 0 | 0.00% | 0.00% | 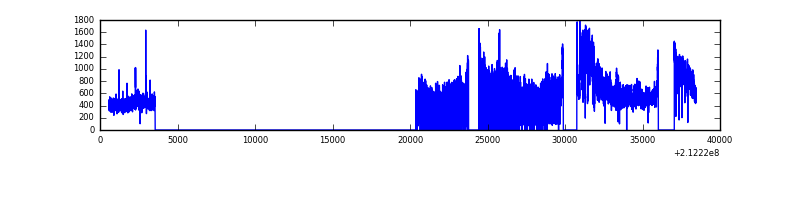 |
| D | 37884 | 17842 | 42 | 42 | 0.11% | 0.24% | 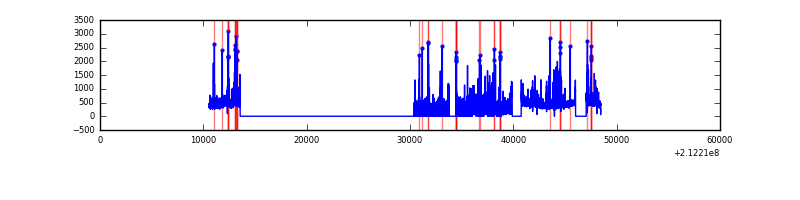 |
Top three noisy pixels from each quadrant. If the there are fewer than three noisy pixels in the level2.evt file, extra rows are filled as -1
| Pixel properties | Quadrant properties | ||||||
|---|---|---|---|---|---|---|---|
| Quadrant | DetID | PixID | Counts | Sigma | Mean | Median | Sigma |
| A | 0 | 50 | 74452 | 184.64 | 1907 | 1864 | 393.1 |
| A | 13 | 251 | 40945 | 99.41 | 1907 | 1864 | 393.1 |
| A | 0 | 226 | 18822 | 43.13 | 1907 | 1864 | 393.1 |
| B | 10 | 16 | 297157 | 803.87 | 1931 | 1890 | 367.3 |
| B | 4 | 48 | 119835 | 321.11 | 1931 | 1890 | 367.3 |
| B | 4 | 80 | 89329 | 238.05 | 1931 | 1890 | 367.3 |
| C | 1 | 16 | 3447389 | 8259.31 | 1803 | 1811 | 417.2 |
| C | 14 | 67 | 18029 | 38.88 | 1803 | 1811 | 417.2 |
| C | 13 | 61 | 14587 | 30.63 | 1803 | 1811 | 417.2 |
| D | 4 | 95 | 246893 | 543.71 | 1853 | 1800 | 450.8 |
| D | 8 | 195 | 121611 | 265.78 | 1853 | 1800 | 450.8 |
| D | 2 | 234 | 105271 | 229.54 | 1853 | 1800 | 450.8 |
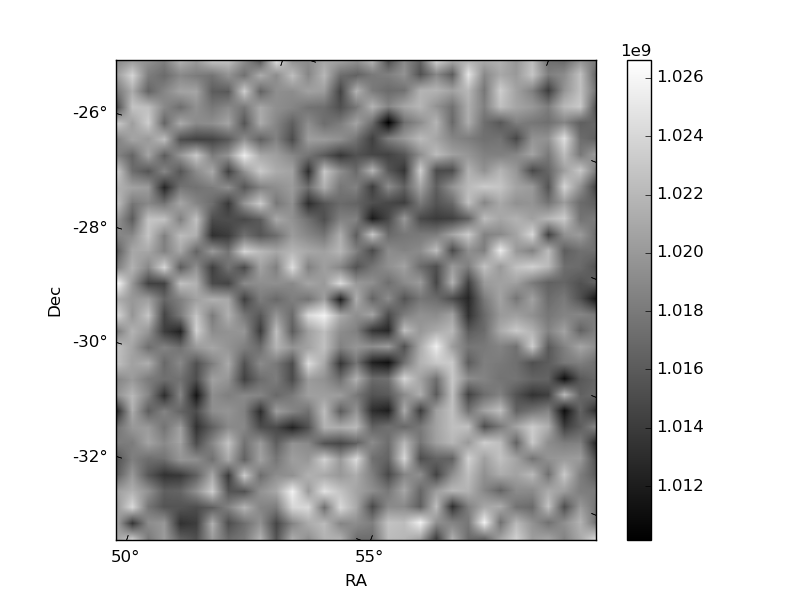
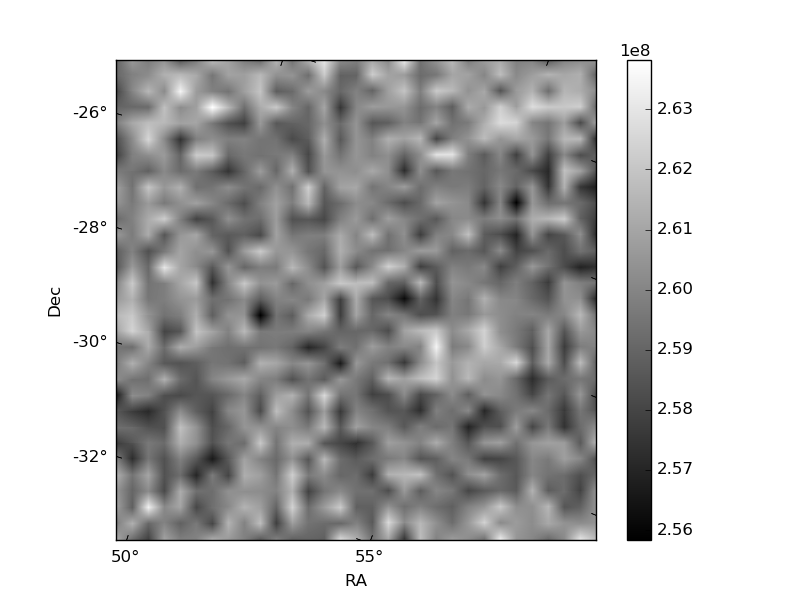
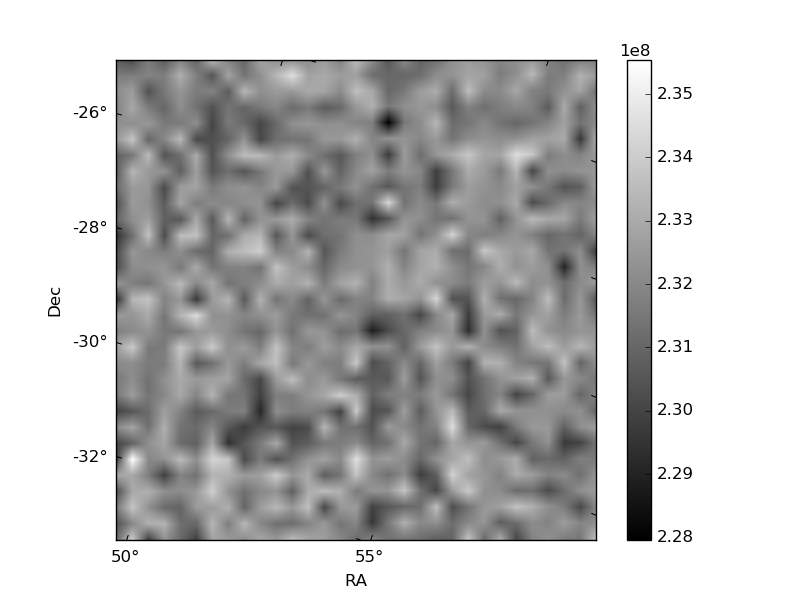
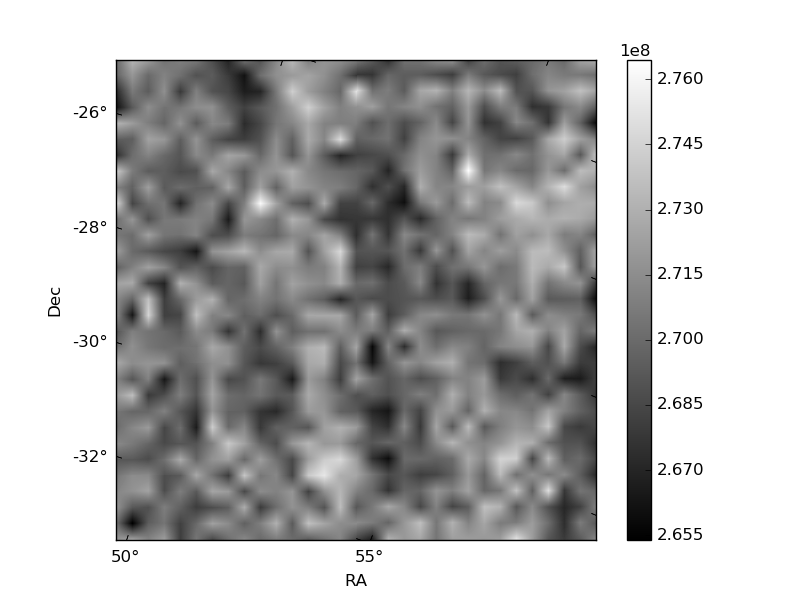
Histogram calculated using DETX and DETY for each event in the final _common_clean file
| Quadrant A | 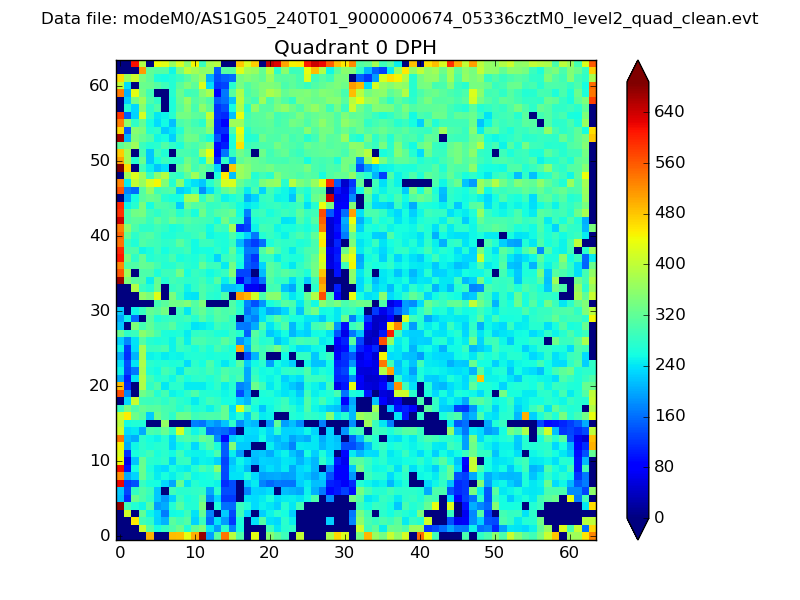 |
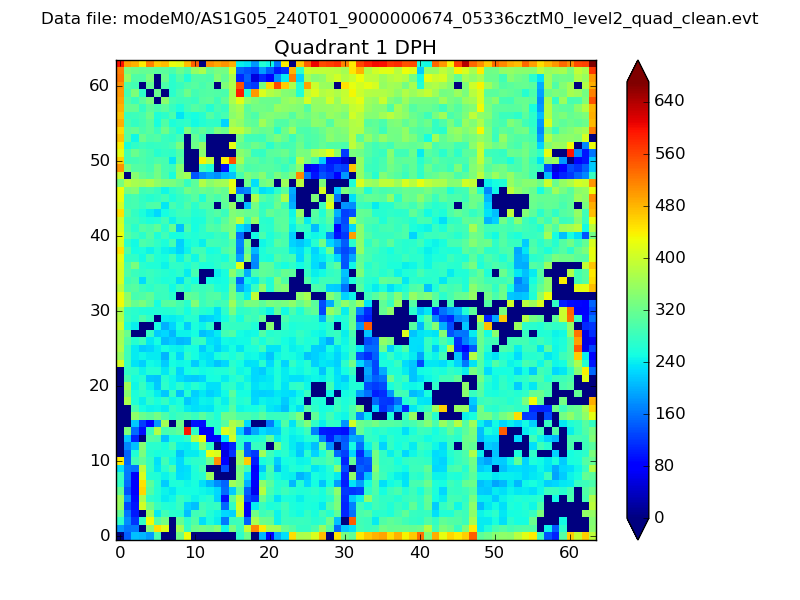 |
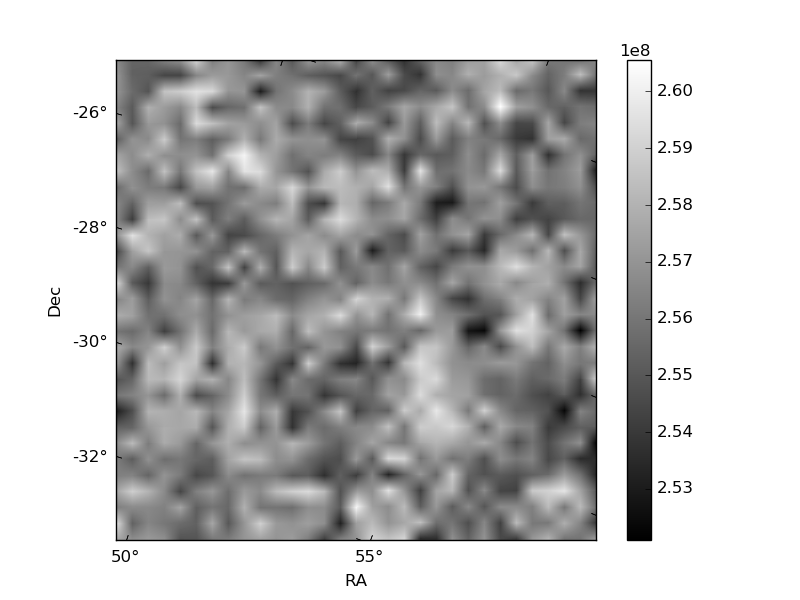
Quadrant B |
|---|---|---|---|
| Quadrant D | 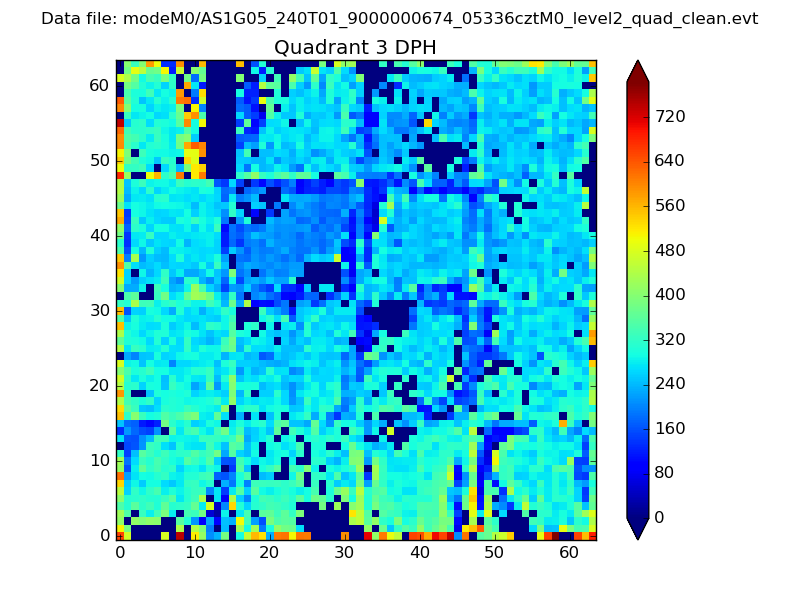 |
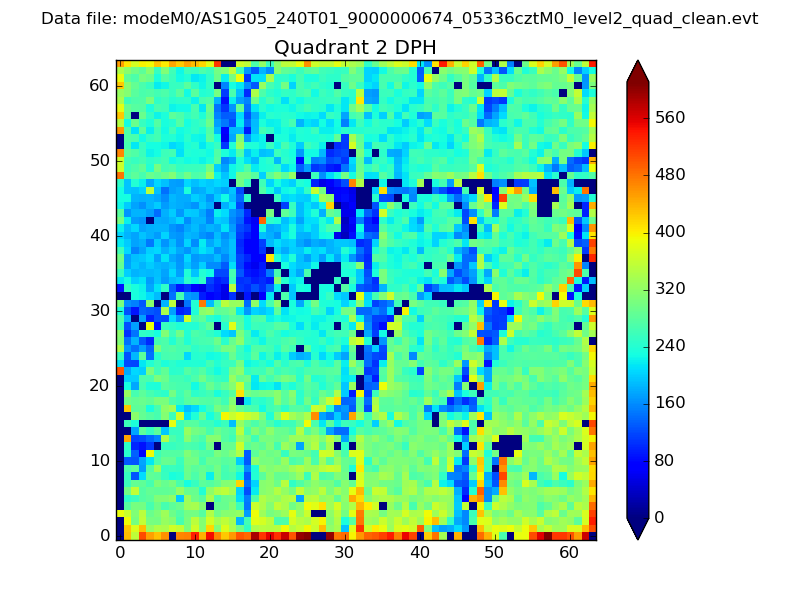 |
Quadrant C |
| Plot type | Count rate plots | Images |
|---|---|---|
| Comparison with Poisson distribution Blue bars denote a histogram of data divided into 1 sec bins. Red curve is a Poisson curve with rate = median count rate of data. |
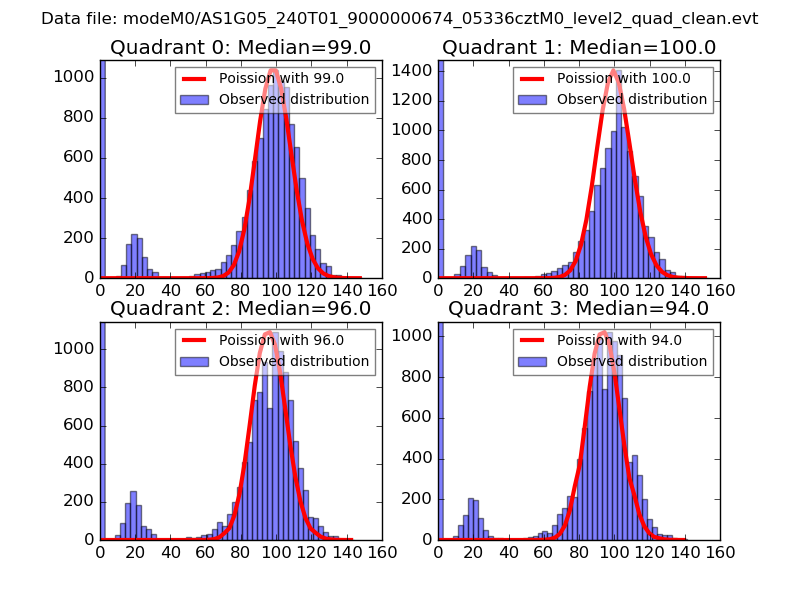 |
 |
| Quadrant-wise count rates Data is divided into 100 sec bins |
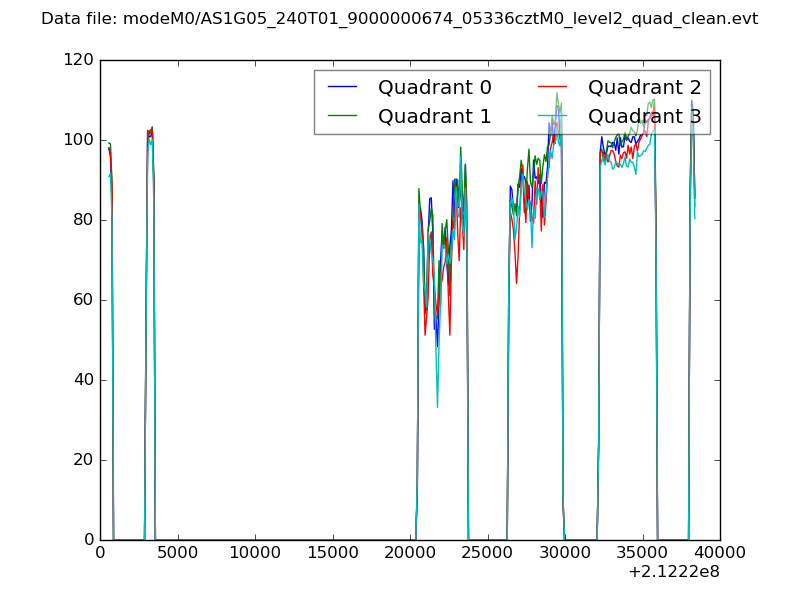 |
|
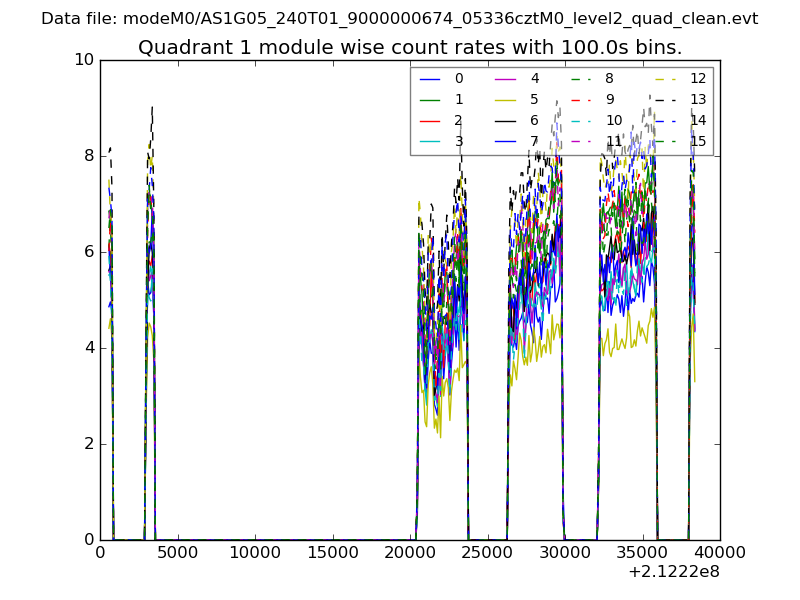
| Module-wise count rates for Quadrant A Data is divided into 100 sec bins |
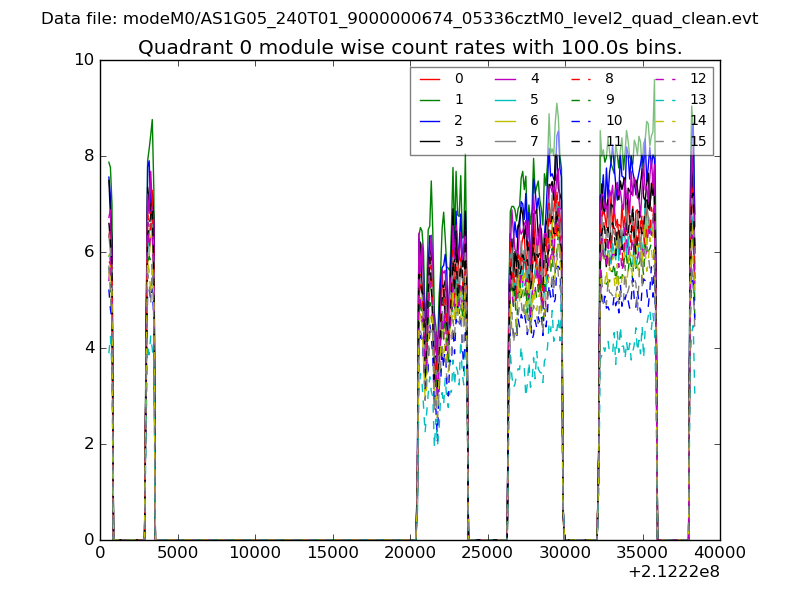 |
 |
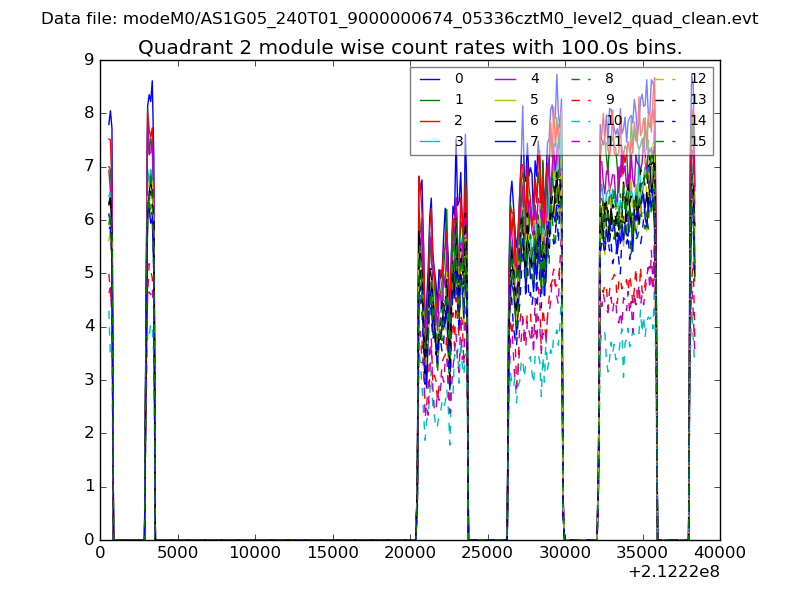
| Module-wise count rates for Quadrant B Data is divided into 100 sec bins |
 |
 |
| Module-wise count rates for Quadrant C Data is divided into 100 sec bins |
 |
 |
| Module-wise count rates for Quadrant D Data is divided into 100 sec bins |
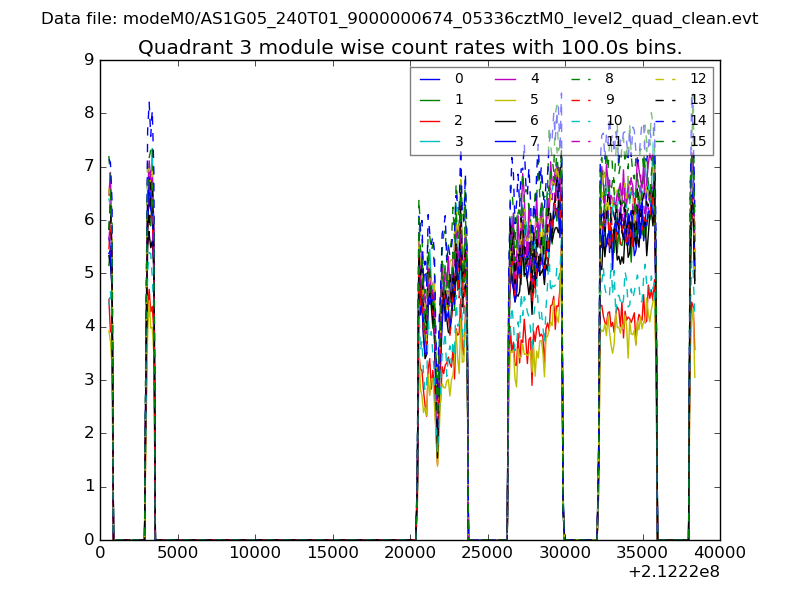 |
 |
| Parameter | Plot |
|---|---|
| CZT HV Monitor | 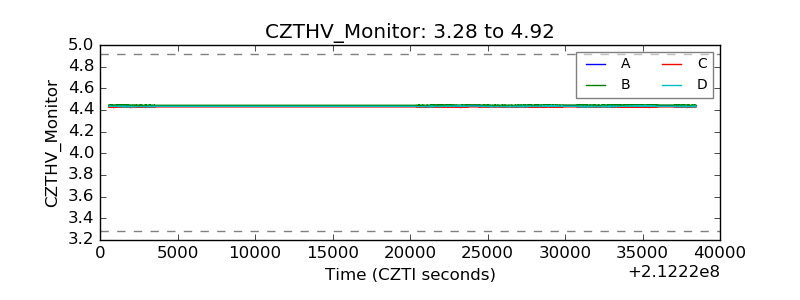 |
| D_VDD | 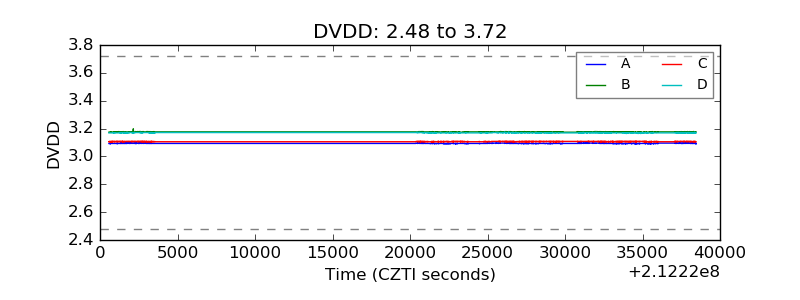 |
| Temperature 1 | 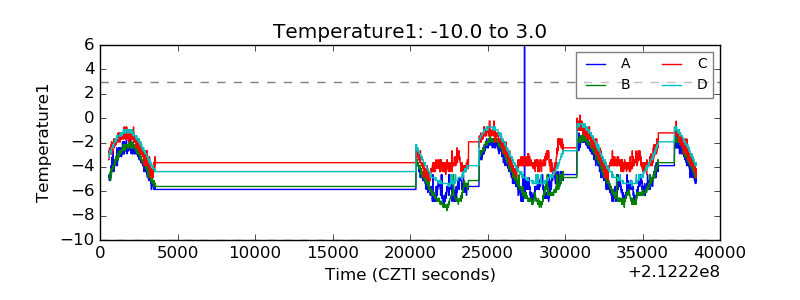 |
| Veto HV Monitor | 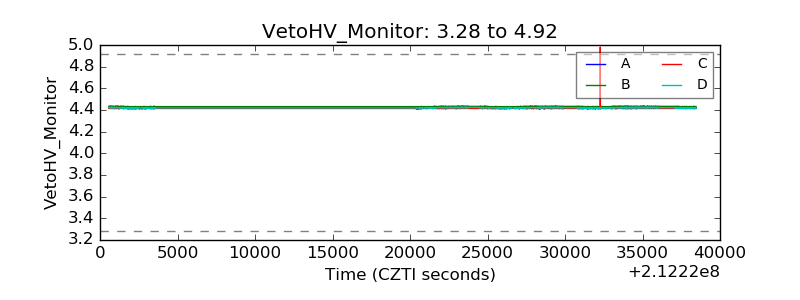 |
| Veto LLD | 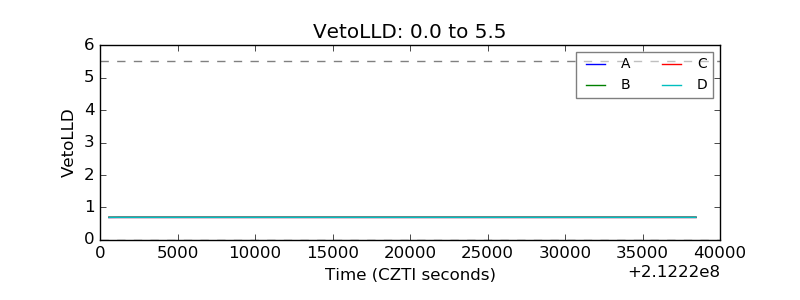 |
| Alpha Counter |  |
| _CPM_Rate | 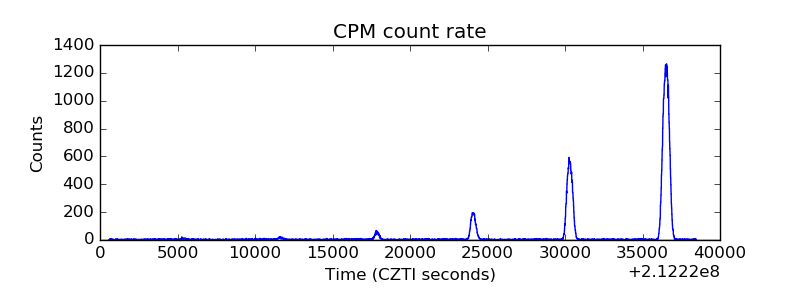 |
| CZT Counter | 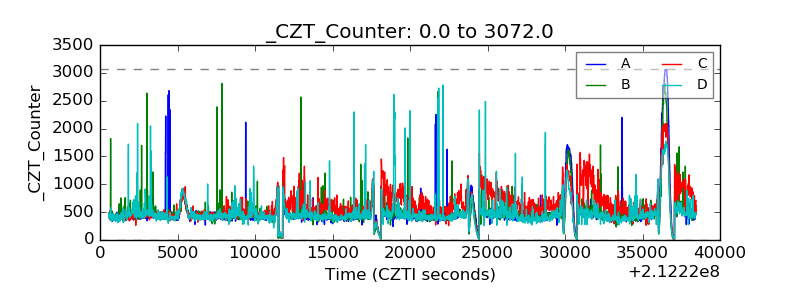 |
| +2.5 Volts monitor | 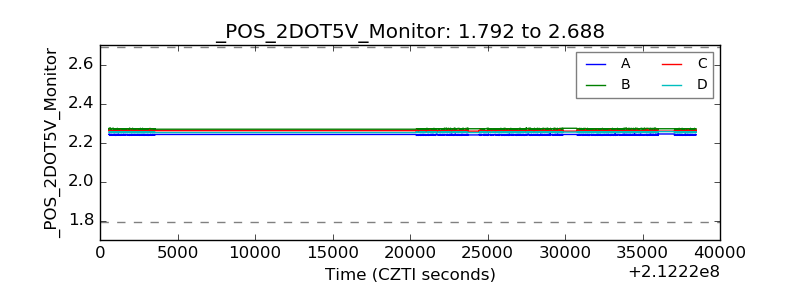 |
| +5 Volts monitor |  |
| _ROLL_ROT | 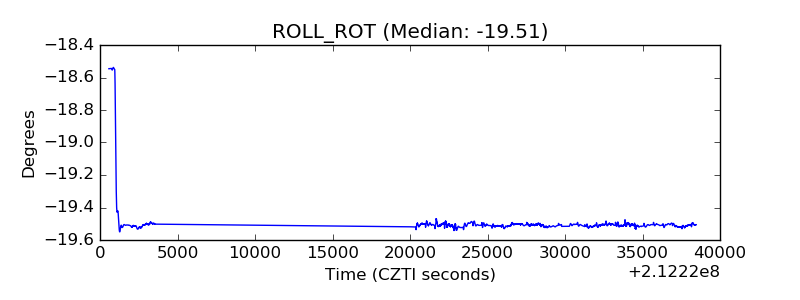 |
| _Roll_DEC | 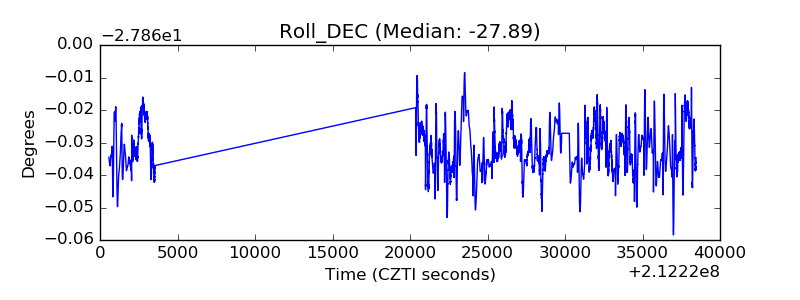 |
| _Roll_RA | 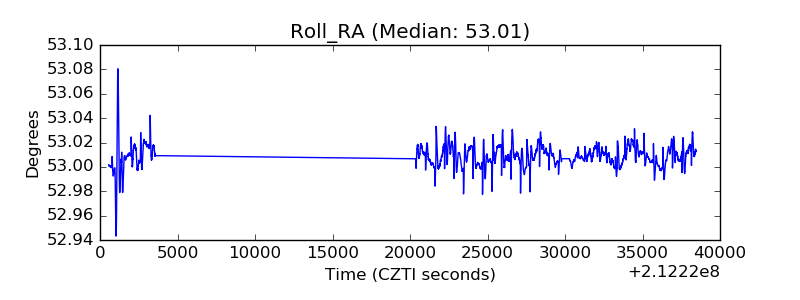 |
| Veto Counter | 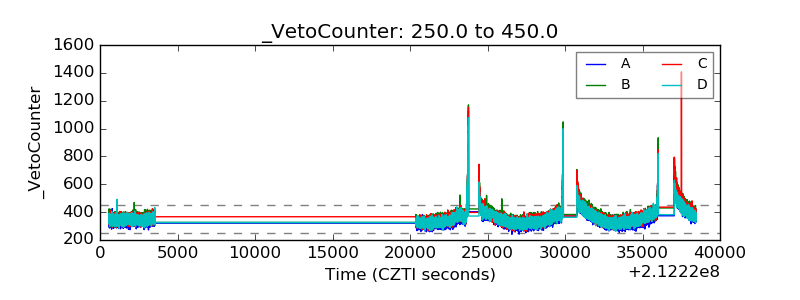 |