| Param | Original file | Final file |
|---|---|---|
| Filename | modeM0/AS1G05_240T01_9000000674_05339cztM0_level2.evt | modeM0/AS1G05_240T01_9000000674_05339cztM0_level2_quad_clean.evt |
| Size (bytes) | 487,598,400 | 82,460,160 |
| Size | 465.0 MB | 78.6 MB |
| Events in quadrant A | 3,163,637 | 519,360 |
| Events in quadrant B | 3,647,949 | 531,269 |
| Events in quadrant C | 4,184,627 | 507,026 |
| Events in quadrant D | 3,329,294 | 485,977 |
| Mode M0 | |||
|---|---|---|---|
| Quadrant | BADHDUFLAG | Total packets | Discarded packets |
| A | 0 | 13798 | 77 |
| B | 0 | 15235 | 62 |
| C | 0 | 16946 | 85 |
| D | 0 | 14437 | 65 |
| Mode SS | |||
|---|---|---|---|
| Quadrant | BADHDUFLAG | Total packets | Discarded packets |
| A | 0 | 136 | 0 |
| B | 0 | 136 | 0 |
| C | 0 | 136 | 0 |
| D | 0 | 136 | 0 |
| Mode M9 | |||
|---|---|---|---|
| Quadrant | BADHDUFLAG | Total packets | Discarded packets |
| A | 0 | 24 | 0 |
| B | 0 | 24 | 0 |
| C | 0 | 24 | 0 |
| D | 0 | 24 | 0 |
| Quadrant | Total seconds | Saturated seconds | Saturation percentage |
|---|---|---|---|
| A | 6489 | 100 | 1.541070% |
| B | 6497 | 174 | 2.678159% |
| C | 6495 | 85 | 1.308699% |
| D | 6498 | 86 | 1.323484% |
Noise dominated data is calculated using 1-second bins in cleaned event files. If a bin has >2000 counts, and if more than 50% of those come from <1% of pixels, then it is considered to be noise-dominated and hence unusable.
| Quadrant | # 1 sec bins | Bins with >0 counts | Bins with >2000 counts | High rate bins dominated by noise | Noise dominated (total time) | Noise dominated (detector-on time) | Marked lightcurve |
|---|---|---|---|---|---|---|---|
| A | 8952 | 6522 | 11 | 11 | 0.12% | 0.17% | 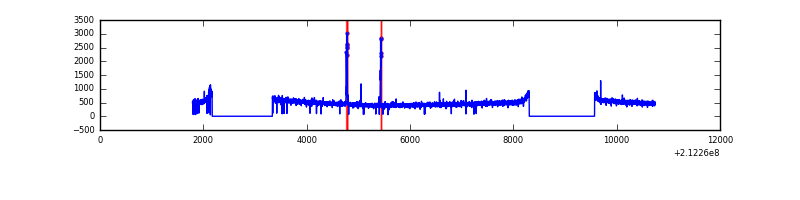 |
| B | 8951 | 6521 | 55 | 55 | 0.61% | 0.84% | 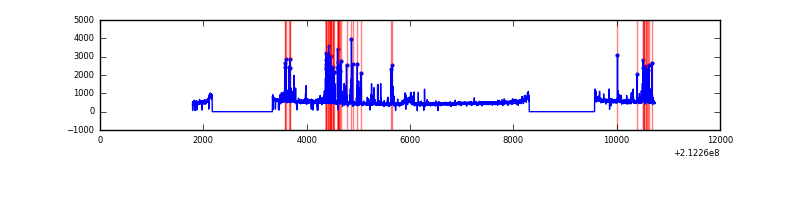 |
| C | 8952 | 6522 | 2 | 2 | 0.02% | 0.03% | 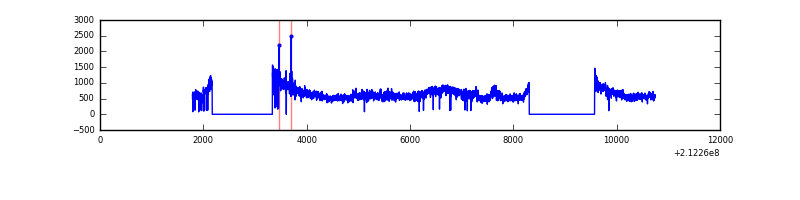 |
| D | 8952 | 6523 | 36 | 36 | 0.40% | 0.55% | 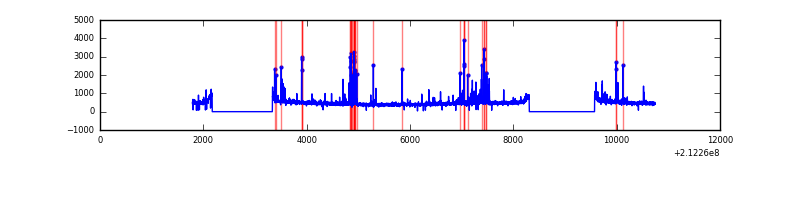 |
Top three noisy pixels from each quadrant. If the there are fewer than three noisy pixels in the level2.evt file, extra rows are filled as -1
| Pixel properties | Quadrant properties | ||||||
|---|---|---|---|---|---|---|---|
| Quadrant | DetID | PixID | Counts | Sigma | Mean | Median | Sigma |
| A | 0 | 50 | 59819 | 359.95 | 801 | 785 | 164.0 |
| A | 13 | 251 | 23820 | 140.45 | 801 | 785 | 164.0 |
| A | 12 | 194 | 7893 | 43.34 | 801 | 785 | 164.0 |
| B | 10 | 16 | 424221 | 2740.7 | 813 | 794 | 154.5 |
| B | 15 | 204 | 22909 | 143.14 | 813 | 794 | 154.5 |
| B | 4 | 48 | 16992 | 104.84 | 813 | 794 | 154.5 |
| C | 1 | 16 | 1120859 | 6218.7 | 777 | 782 | 180.1 |
| C | 14 | 67 | 14527 | 76.31 | 777 | 782 | 180.1 |
| C | 15 | 1 | 13277 | 69.37 | 777 | 782 | 180.1 |
| D | 4 | 95 | 241302 | 1261.37 | 771 | 747 | 190.7 |
| D | 8 | 195 | 60408 | 312.84 | 771 | 747 | 190.7 |
| D | 2 | 14 | 40400 | 207.92 | 771 | 747 | 190.7 |
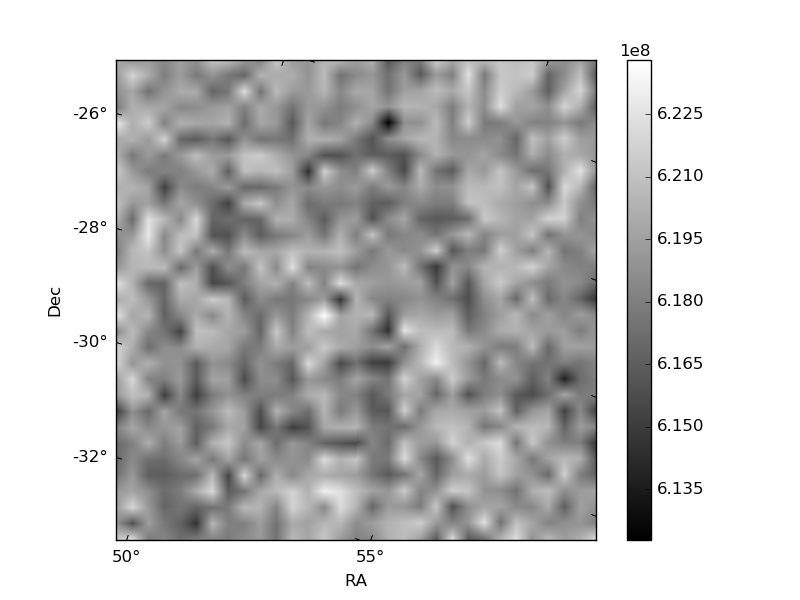
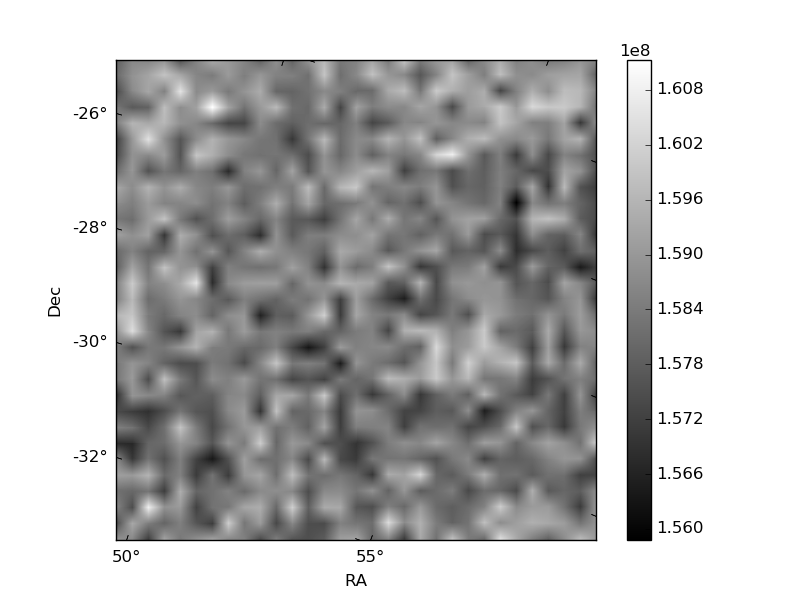
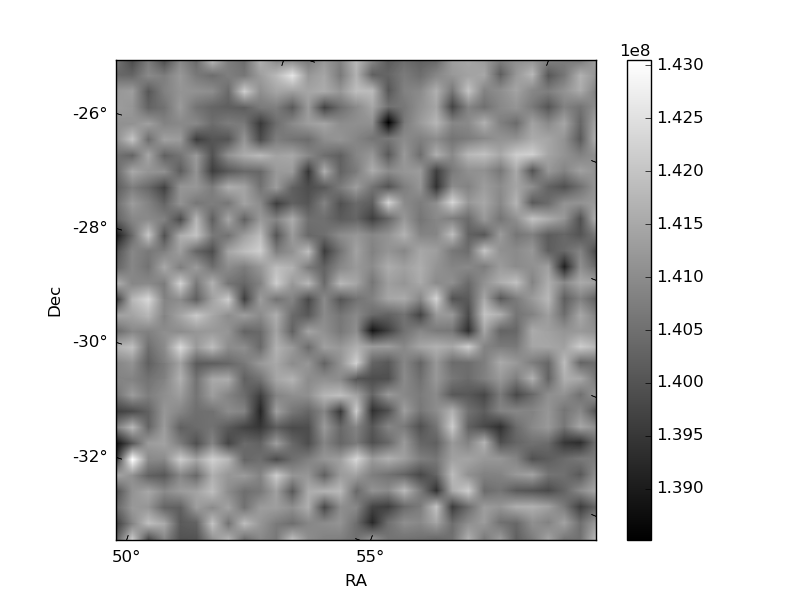
Histogram calculated using DETX and DETY for each event in the final _common_clean file
| Quadrant A | 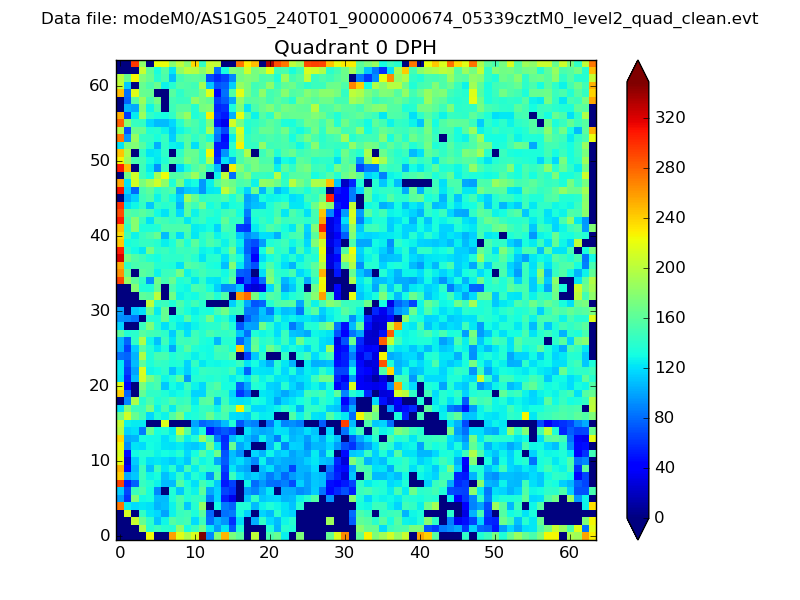 |
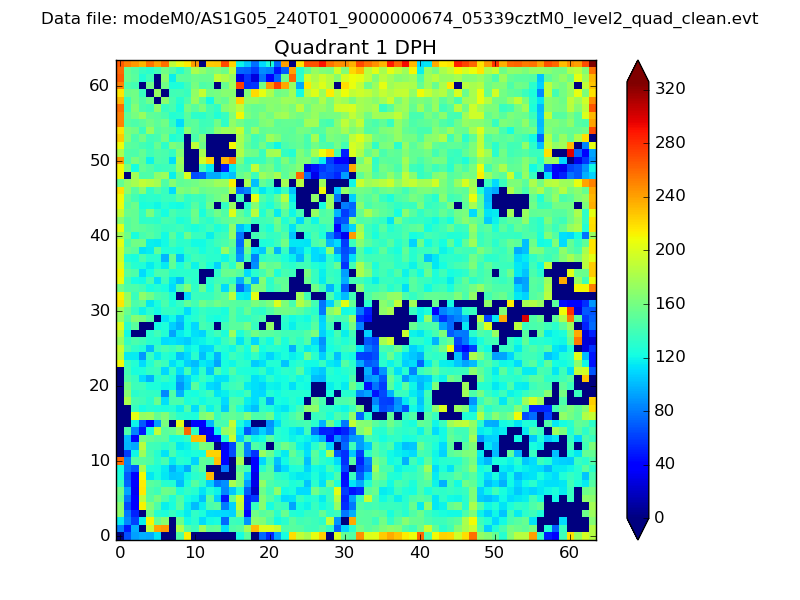 |
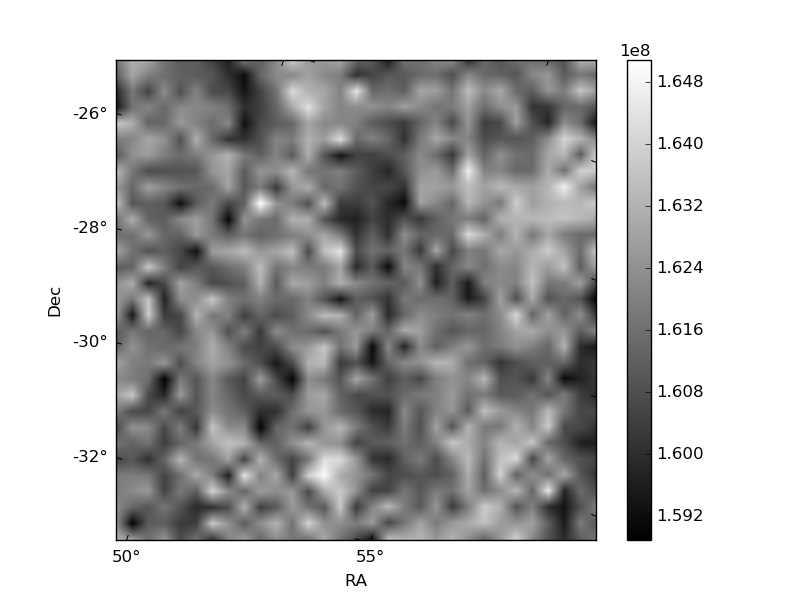
Quadrant B |
|---|---|---|---|
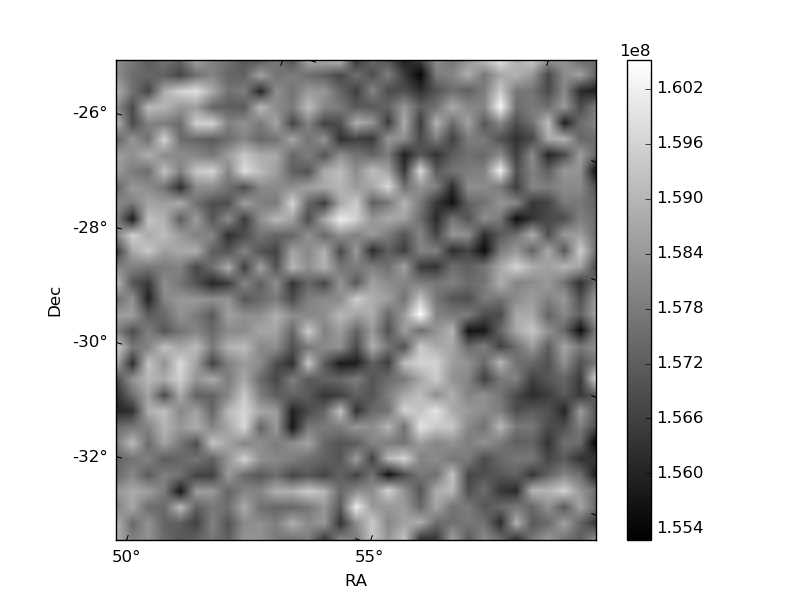
| Quadrant D | 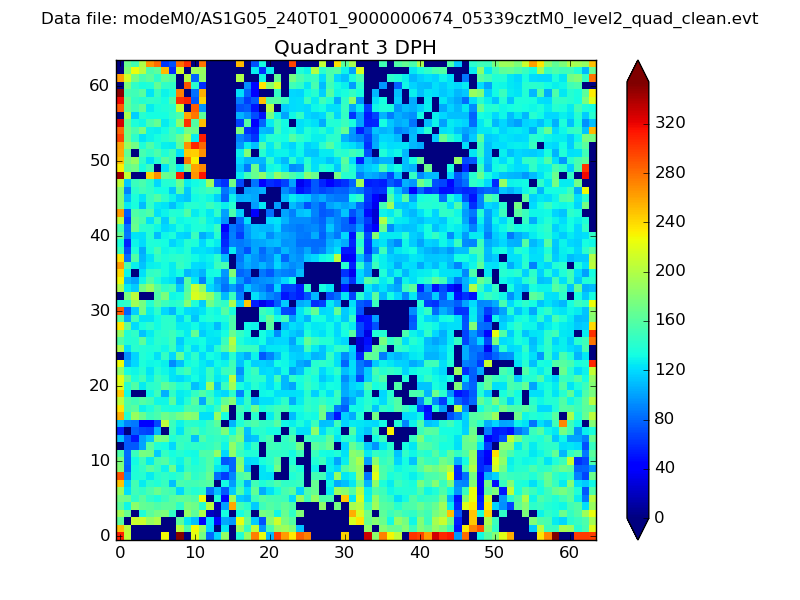 |
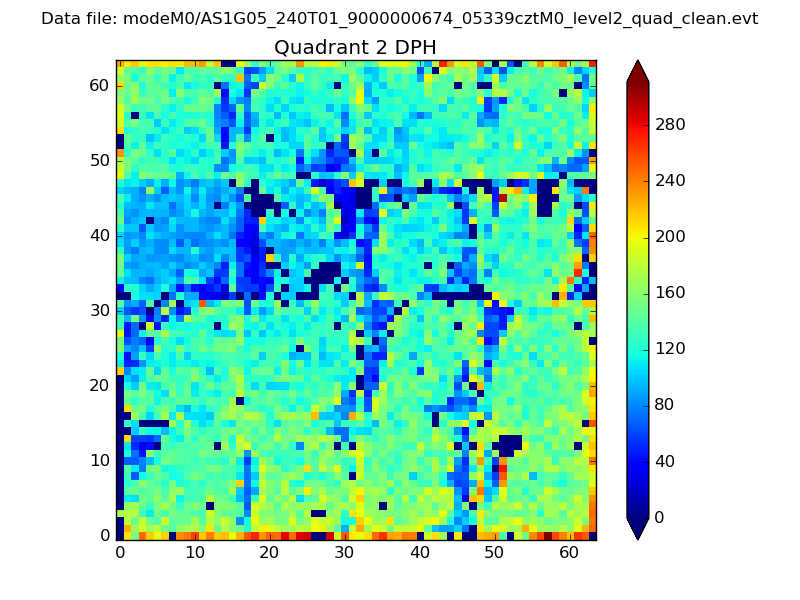 |
Quadrant C |
| Plot type | Count rate plots | Images |
|---|---|---|
| Comparison with Poisson distribution Blue bars denote a histogram of data divided into 1 sec bins. Red curve is a Poisson curve with rate = median count rate of data. |
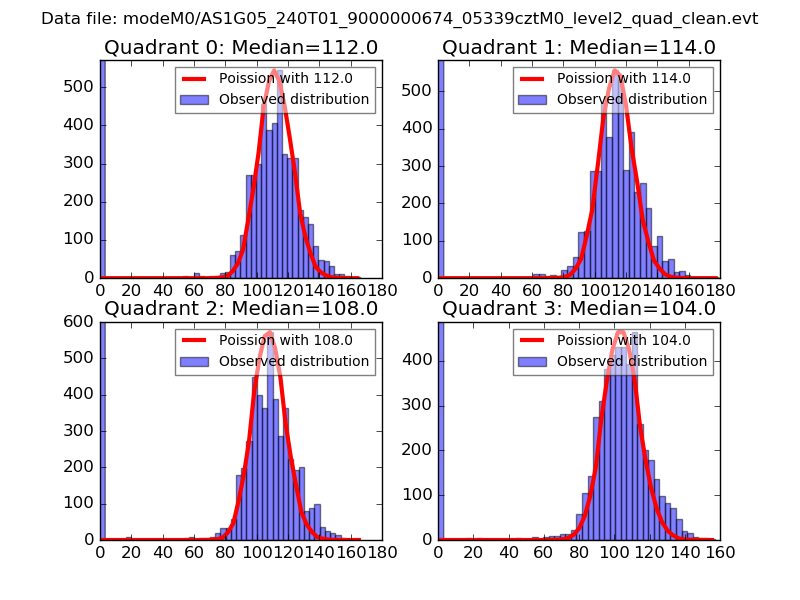 |
 |
| Quadrant-wise count rates Data is divided into 100 sec bins |
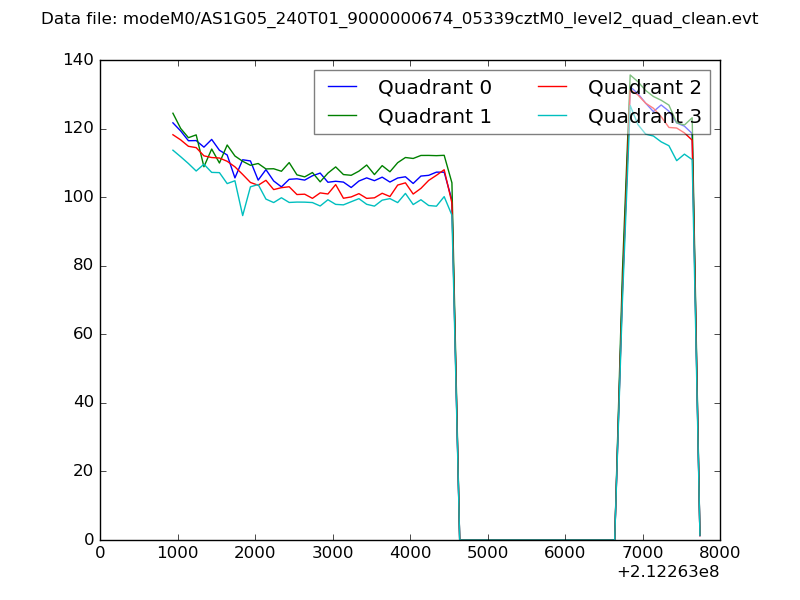 |
|
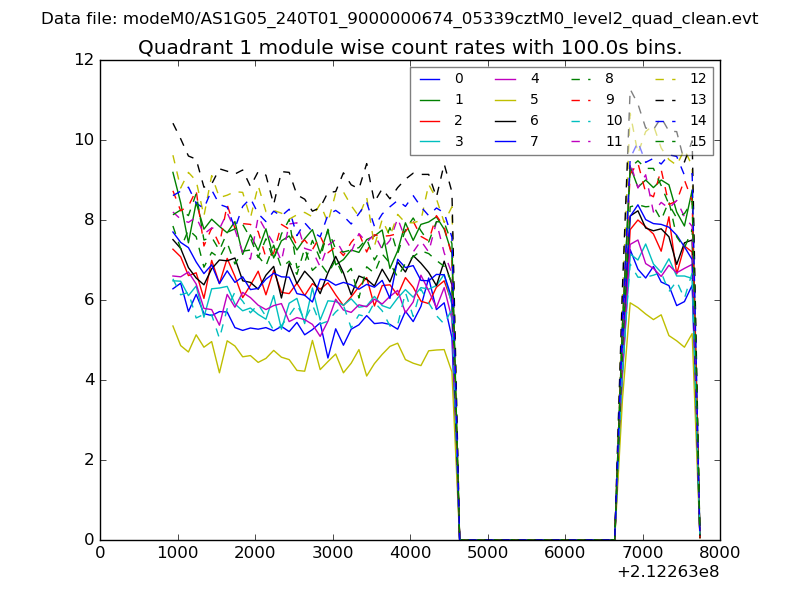
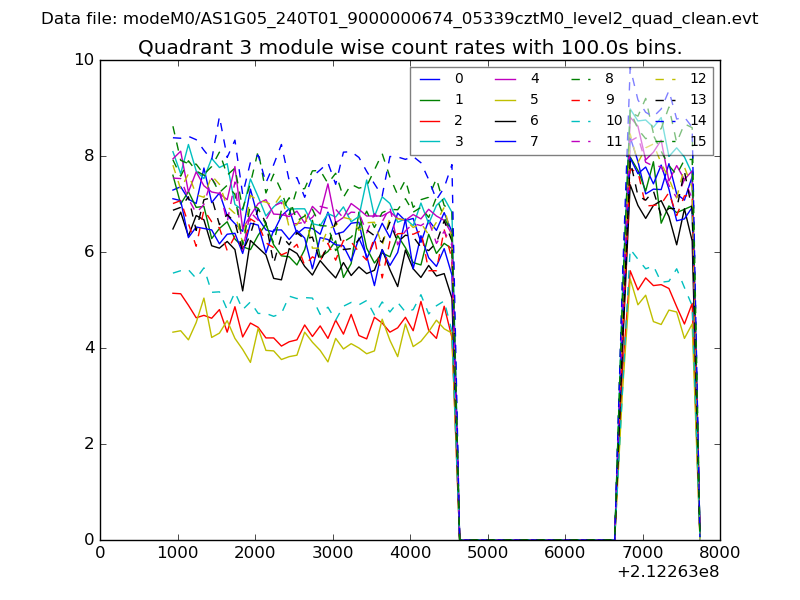
| Module-wise count rates for Quadrant A Data is divided into 100 sec bins |
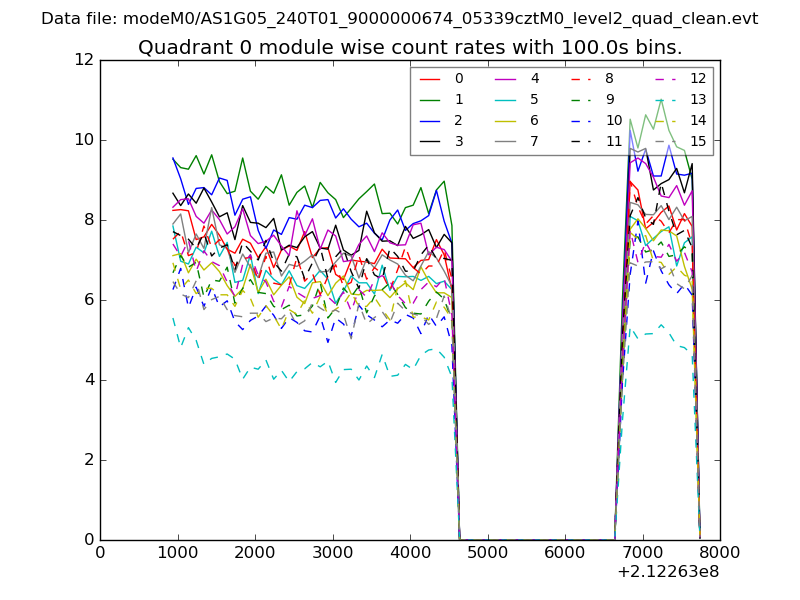 |
 |
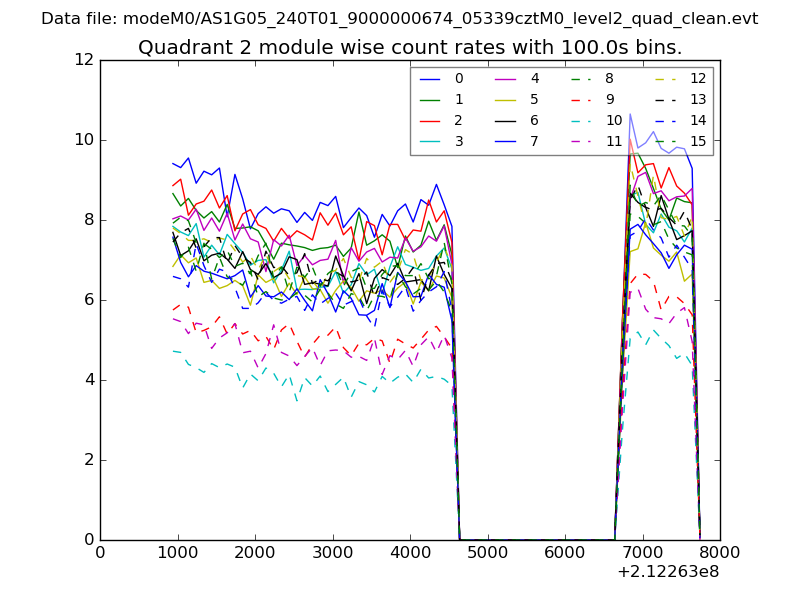
| Module-wise count rates for Quadrant B Data is divided into 100 sec bins |
 |
 |
| Module-wise count rates for Quadrant C Data is divided into 100 sec bins |
 |
 |
| Module-wise count rates for Quadrant D Data is divided into 100 sec bins |
 |
 |
| Parameter | Plot |
|---|---|
| CZT HV Monitor | 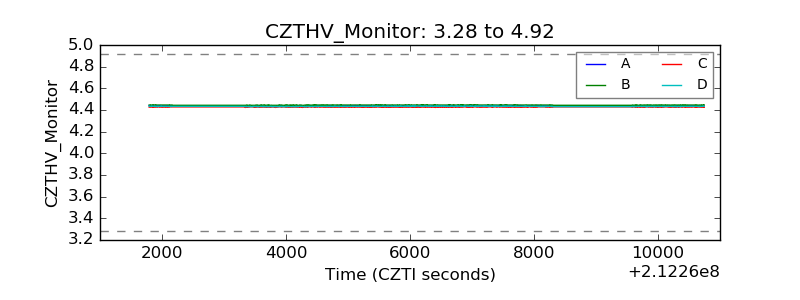 |
| D_VDD | 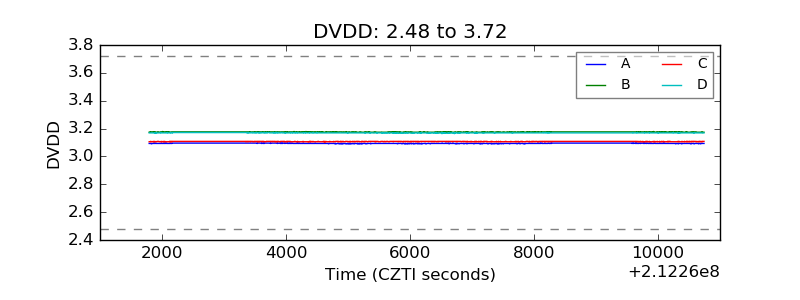 |
| Temperature 1 | 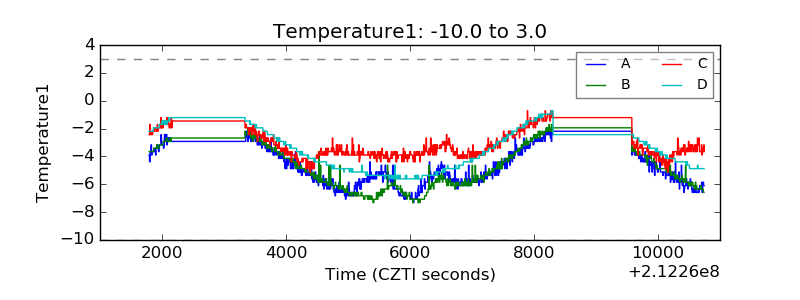 |
| Veto HV Monitor | 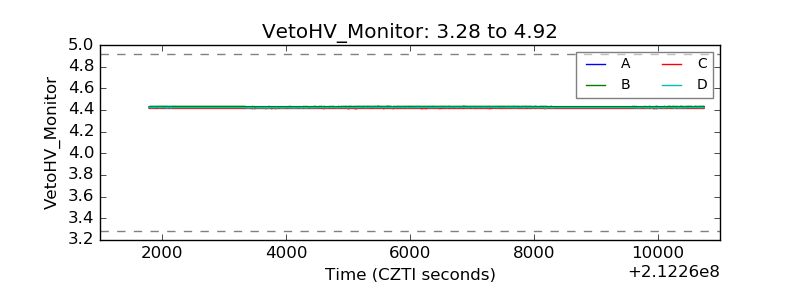 |
| Veto LLD | 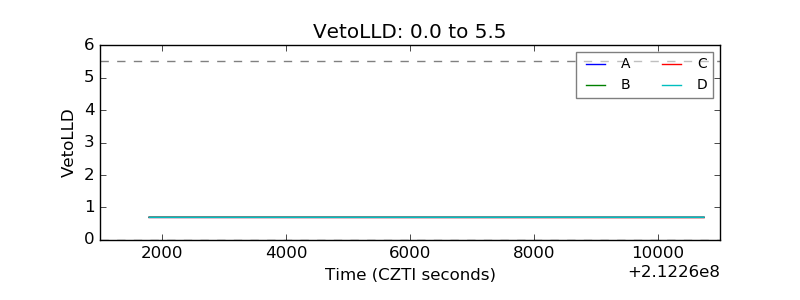 |
| Alpha Counter | 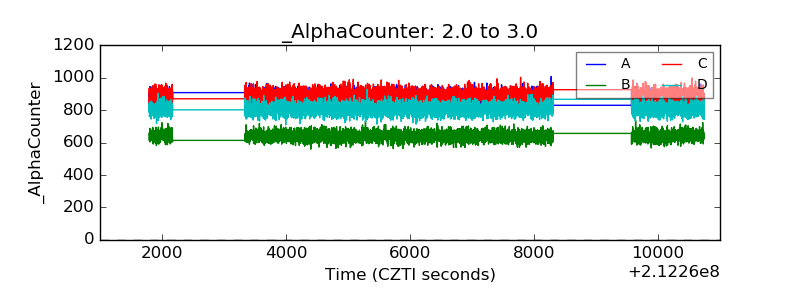 |
| _CPM_Rate | 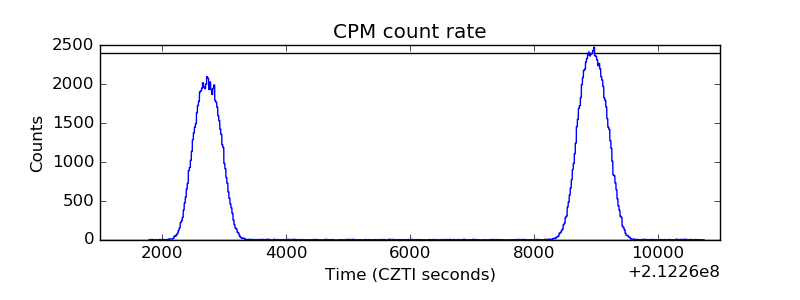 |
| CZT Counter |  |
| +2.5 Volts monitor |  |
| +5 Volts monitor |  |
| _ROLL_ROT | 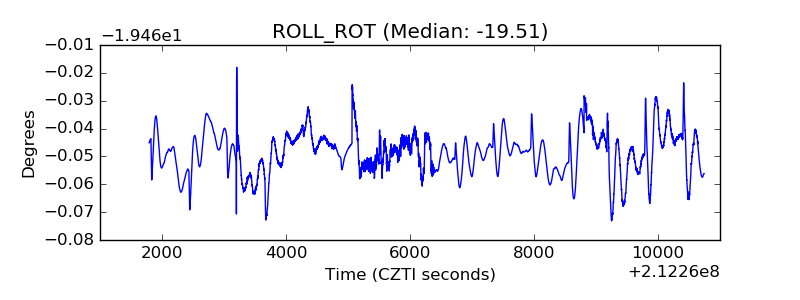 |
| _Roll_DEC | 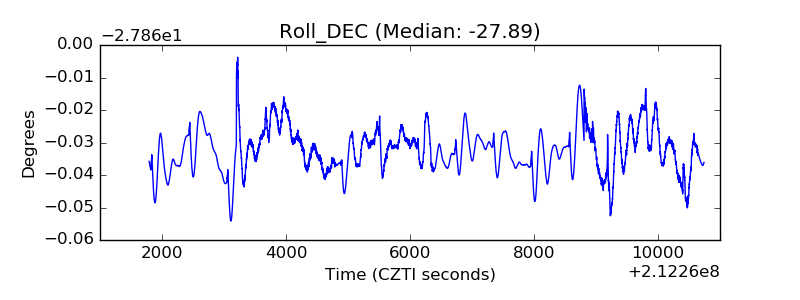 |
| _Roll_RA | 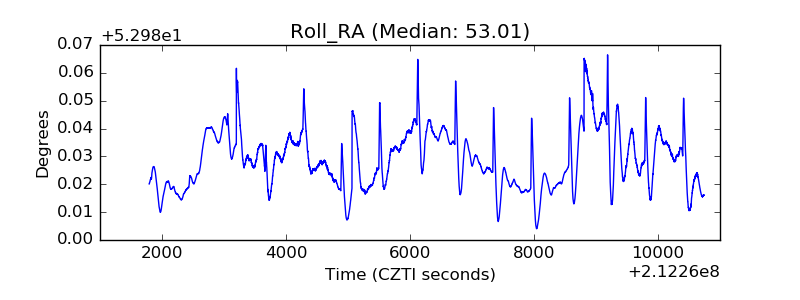 |
| Veto Counter | 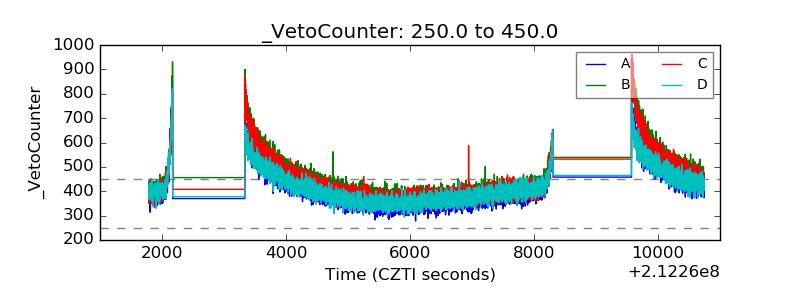 |