| Param | Original file | Final file |
|---|---|---|
| Filename | modeM0/AS1G05_240T01_9000000674_05340cztM0_level2.evt | modeM0/AS1G05_240T01_9000000674_05340cztM0_level2_quad_clean.evt |
| Size (bytes) | 285,454,080 | 56,744,640 |
| Size | 272.2 MB | 54.1 MB |
| Events in quadrant A | 1,890,079 | 362,795 |
| Events in quadrant B | 2,245,992 | 372,857 |
| Events in quadrant C | 2,299,828 | 356,246 |
| Events in quadrant D | 1,930,715 | 338,783 |
| Mode M0 | |||
|---|---|---|---|
| Quadrant | BADHDUFLAG | Total packets | Discarded packets |
| A | 0 | 8412 | 3 |
| B | 0 | 9411 | 14 |
| C | 0 | 9385 | 6 |
| D | 0 | 8611 | 6 |
| Mode SS | |||
|---|---|---|---|
| Quadrant | BADHDUFLAG | Total packets | Discarded packets |
| A | 0 | 86 | 0 |
| B | 0 | 86 | 0 |
| C | 0 | 86 | 0 |
| D | 0 | 86 | 0 |
| Mode M9 | |||
|---|---|---|---|
| Quadrant | BADHDUFLAG | Total packets | Discarded packets |
| A | 0 | 12 | 0 |
| B | 0 | 12 | 0 |
| C | 0 | 12 | 0 |
| D | 0 | 12 | 0 |
| Quadrant | Total seconds | Saturated seconds | Saturation percentage |
|---|---|---|---|
| A | 4069 | 30 | 0.737282% |
| B | 4066 | 84 | 2.065912% |
| C | 4068 | 25 | 0.614553% |
| D | 4068 | 19 | 0.467060% |
Noise dominated data is calculated using 1-second bins in cleaned event files. If a bin has >2000 counts, and if more than 50% of those come from <1% of pixels, then it is considered to be noise-dominated and hence unusable.
| Quadrant | # 1 sec bins | Bins with >0 counts | Bins with >2000 counts | High rate bins dominated by noise | Noise dominated (total time) | Noise dominated (detector-on time) | Marked lightcurve |
|---|---|---|---|---|---|---|---|
| A | 5335 | 4070 | 0 | 0 | 0.00% | 0.00% | 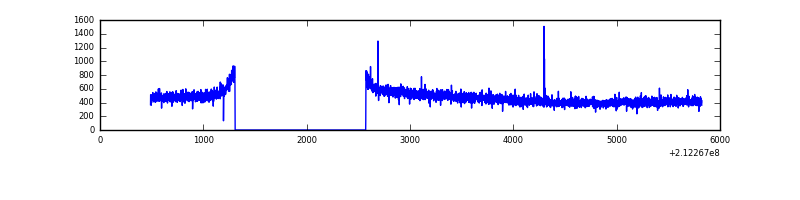 |
| B | 5335 | 4070 | 29 | 29 | 0.54% | 0.71% | 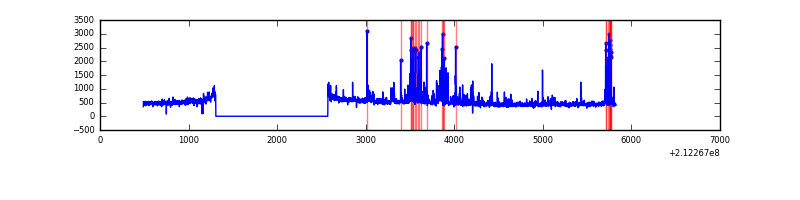 |
| C | 5335 | 4071 | 0 | 0 | 0.00% | 0.00% | 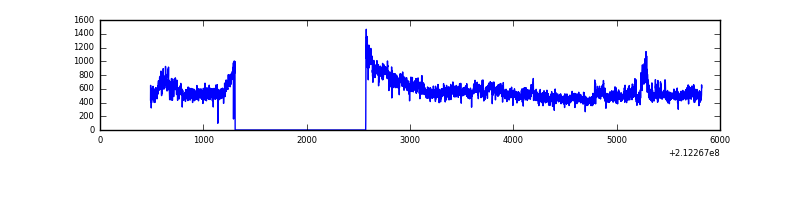 |
| D | 5335 | 4071 | 3 | 3 | 0.06% | 0.07% | 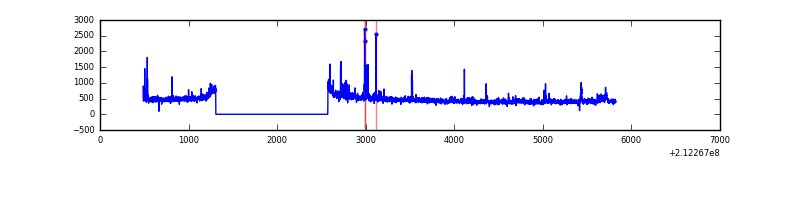 |
Top three noisy pixels from each quadrant. If the there are fewer than three noisy pixels in the level2.evt file, extra rows are filled as -1
| Pixel properties | Quadrant properties | ||||||
|---|---|---|---|---|---|---|---|
| Quadrant | DetID | PixID | Counts | Sigma | Mean | Median | Sigma |
| A | 12 | 194 | 4912 | 44.22 | 489 | 479 | 100.3 |
| A | 0 | 226 | 4725 | 42.35 | 489 | 479 | 100.3 |
| A | 0 | 50 | 4324 | 38.35 | 489 | 479 | 100.3 |
| B | 10 | 16 | 205423 | 2150.6 | 499 | 487 | 95.3 |
| B | 4 | 80 | 68228 | 710.88 | 499 | 487 | 95.3 |
| B | 15 | 204 | 14149 | 143.37 | 499 | 487 | 95.3 |
| C | 1 | 16 | 423636 | 3816.23 | 478 | 482 | 110.9 |
| C | 14 | 67 | 7998 | 67.78 | 478 | 482 | 110.9 |
| C | 13 | 61 | 3905 | 30.87 | 478 | 482 | 110.9 |
| D | 4 | 95 | 49529 | 419.06 | 471 | 455 | 117.1 |
| D | 8 | 195 | 40865 | 345.08 | 471 | 455 | 117.1 |
| D | 13 | 105 | 29606 | 248.93 | 471 | 455 | 117.1 |
Histogram calculated using DETX and DETY for each event in the final _common_clean file
| Quadrant A | 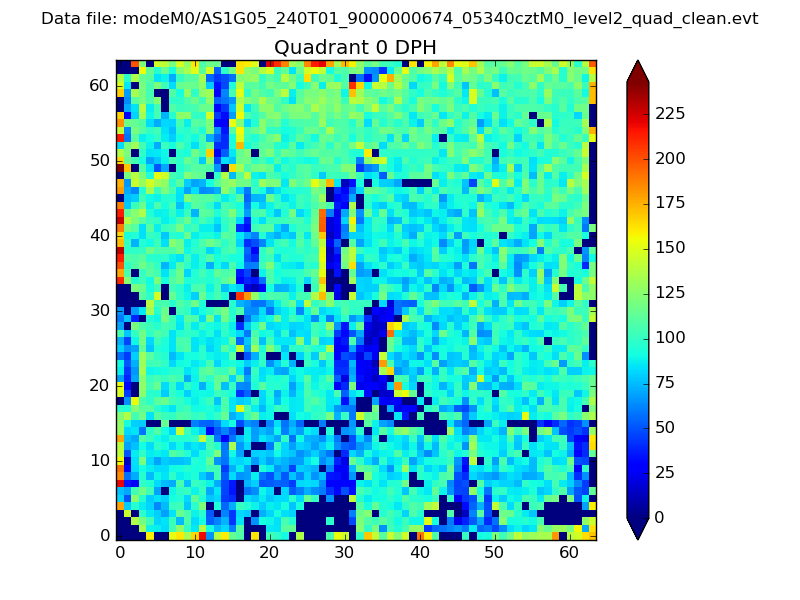 |
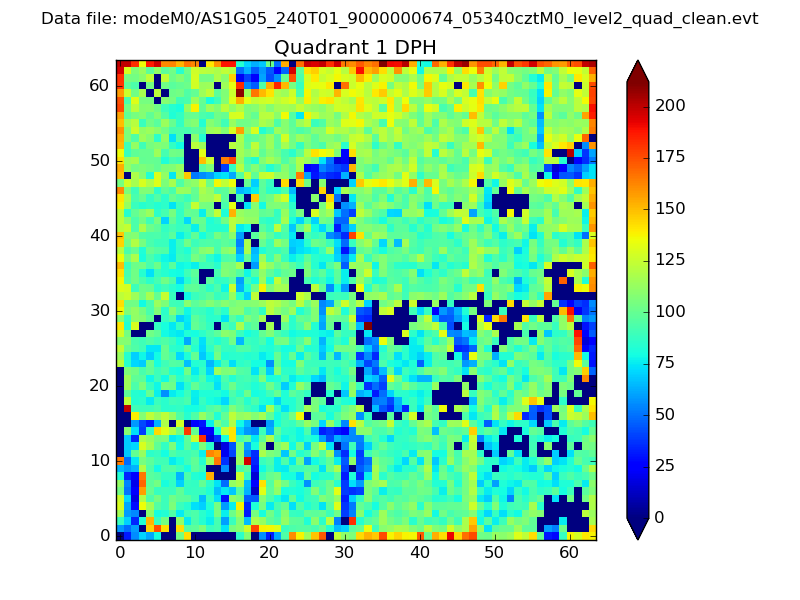 |
Quadrant B |
|---|---|---|---|
| Quadrant D |  |
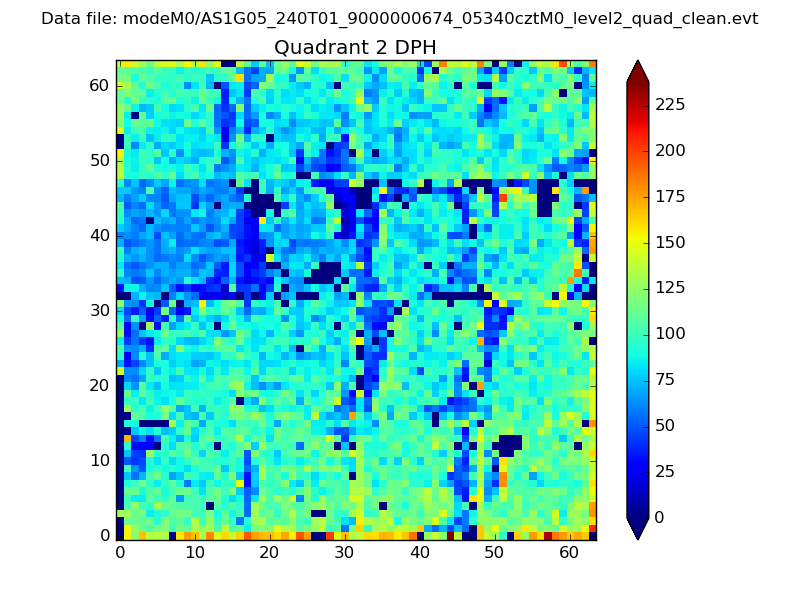 |
Quadrant C |
| Plot type | Count rate plots | Images |
|---|---|---|
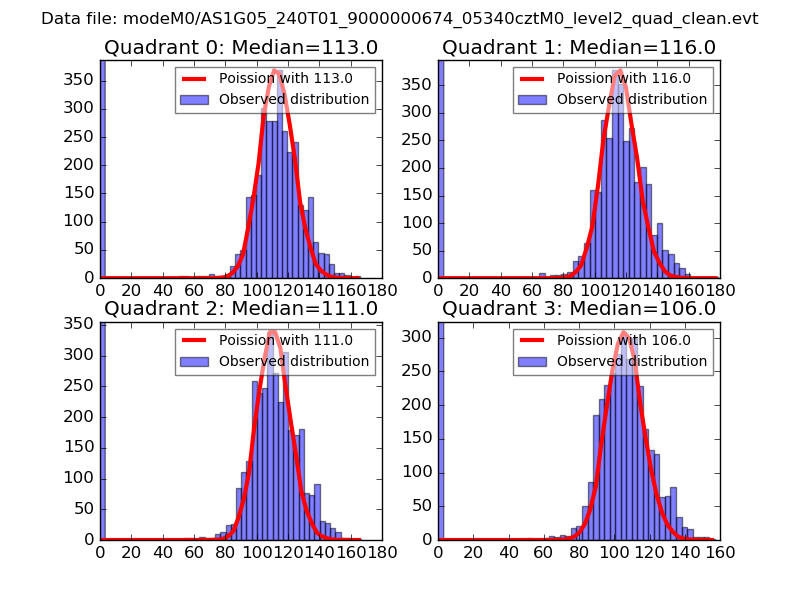
| Comparison with Poisson distribution Blue bars denote a histogram of data divided into 1 sec bins. Red curve is a Poisson curve with rate = median count rate of data. |
 |
 |
| Quadrant-wise count rates Data is divided into 100 sec bins |
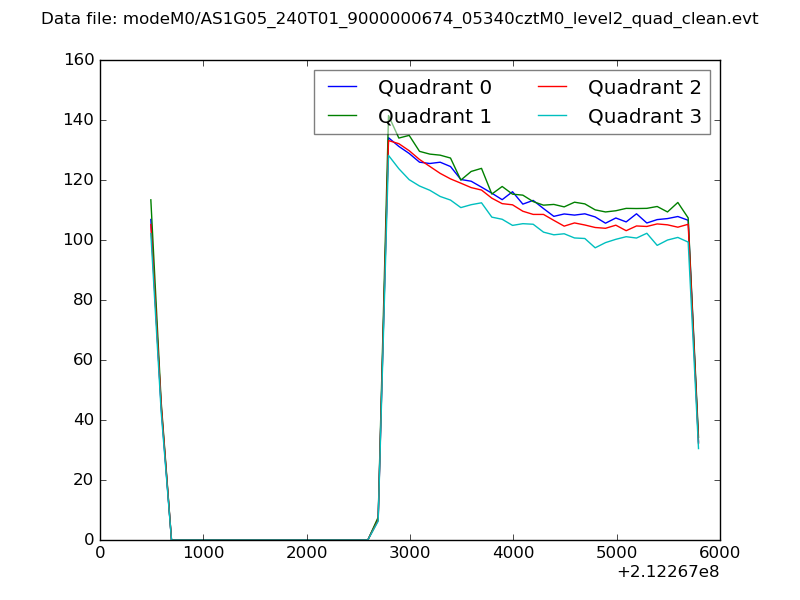 |
|
| Module-wise count rates for Quadrant A Data is divided into 100 sec bins |
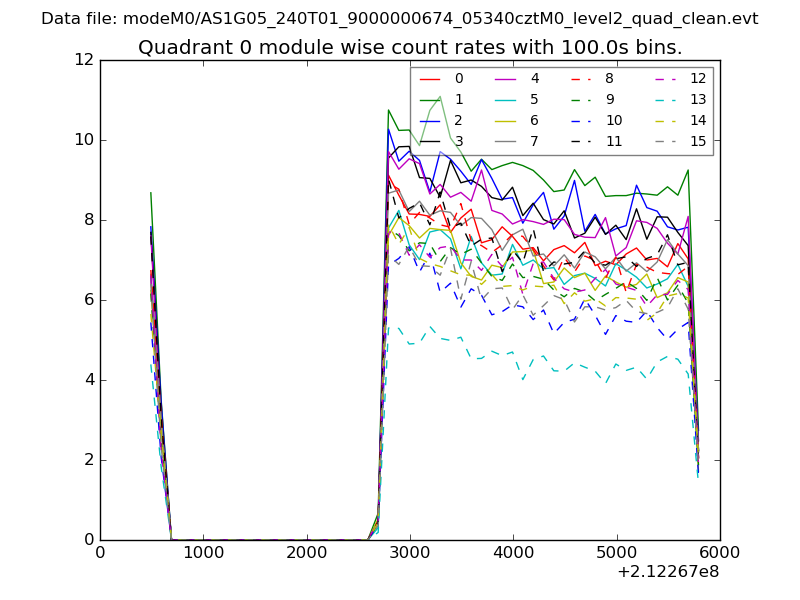 |
 |
| Module-wise count rates for Quadrant B Data is divided into 100 sec bins |
 |
 |
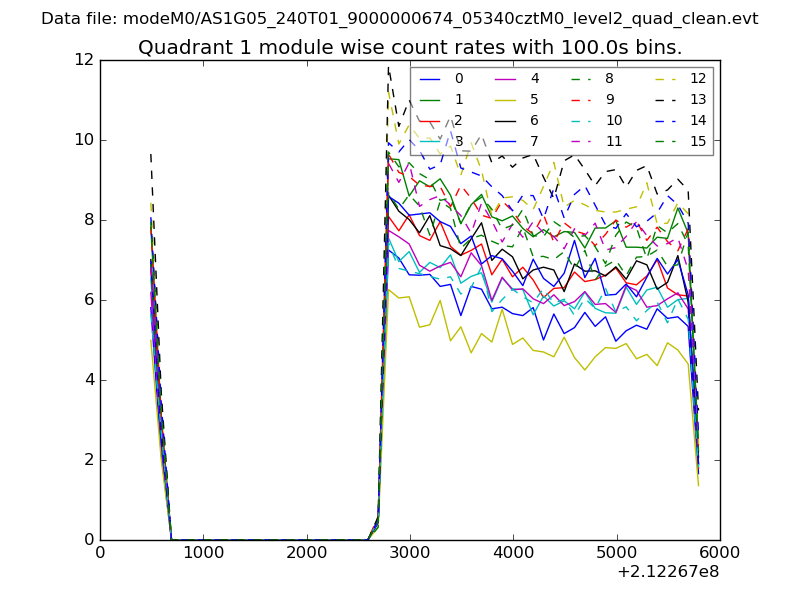
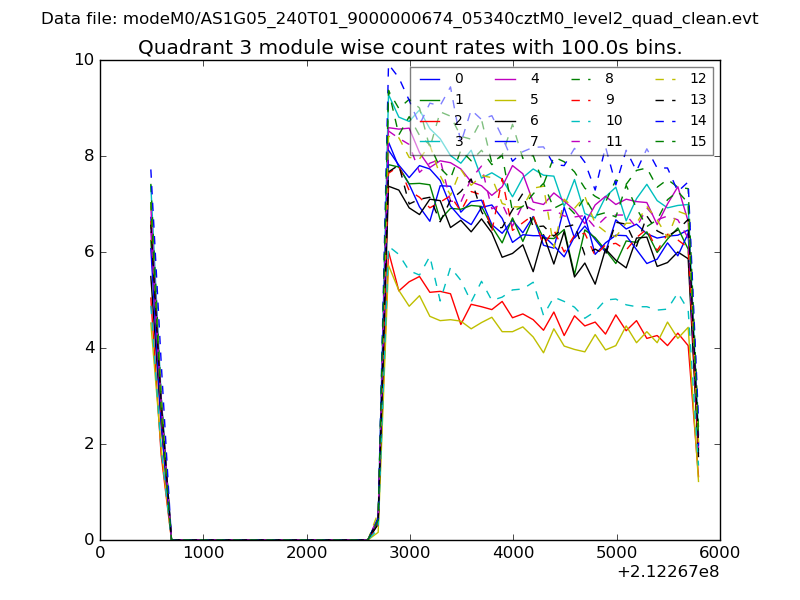
| Module-wise count rates for Quadrant C Data is divided into 100 sec bins |
 |
 |
| Module-wise count rates for Quadrant D Data is divided into 100 sec bins |
 |
 |
| Parameter | Plot |
|---|---|
| CZT HV Monitor | 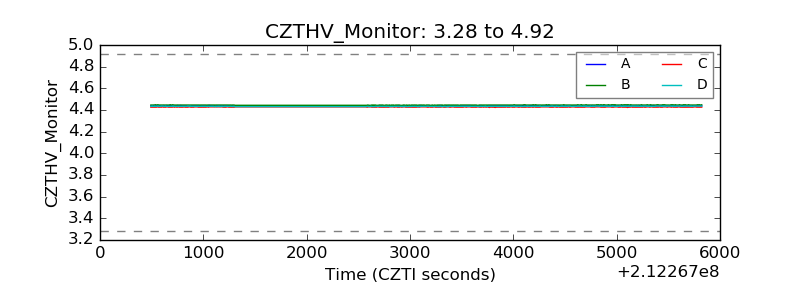 |
| D_VDD | 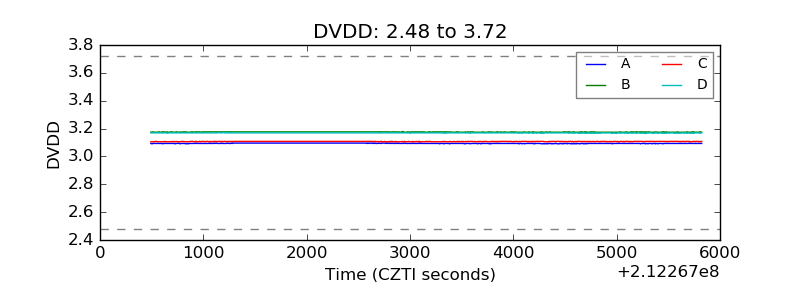 |
| Temperature 1 | 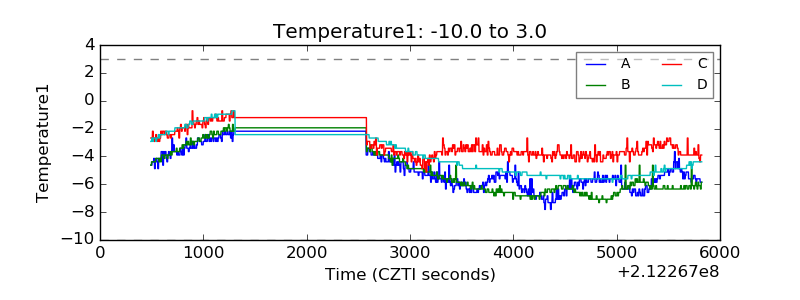 |
| Veto HV Monitor | 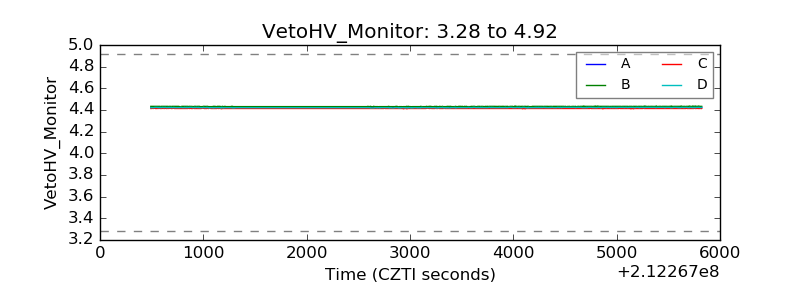 |
| Veto LLD | 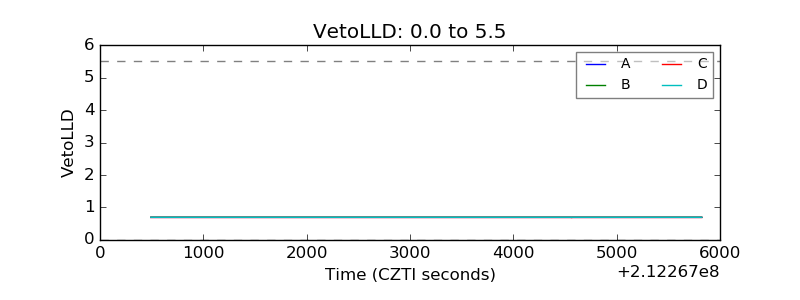 |
| Alpha Counter | 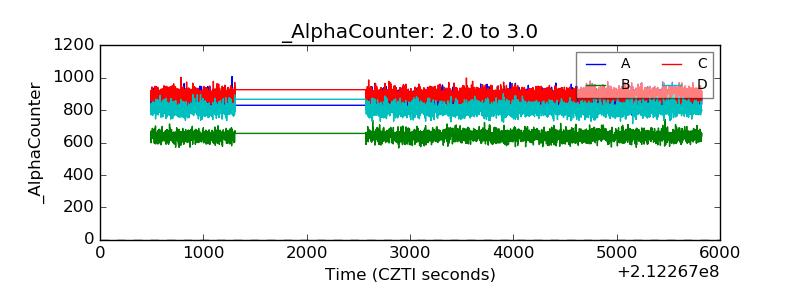 |
| _CPM_Rate | 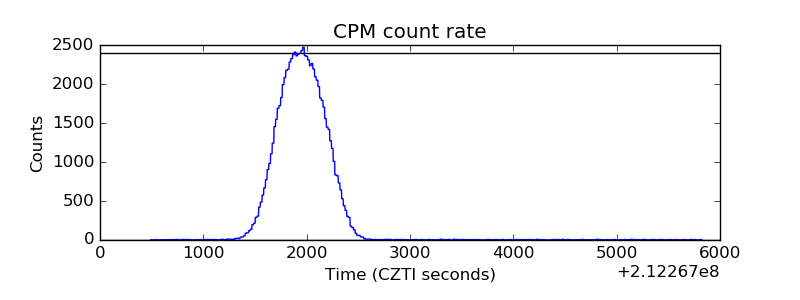 |
| CZT Counter | 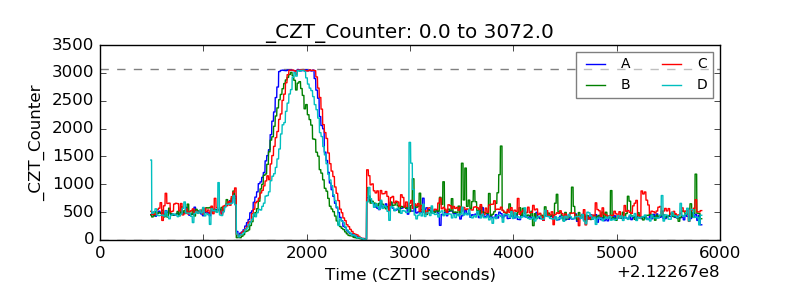 |
| +2.5 Volts monitor |  |
| +5 Volts monitor | 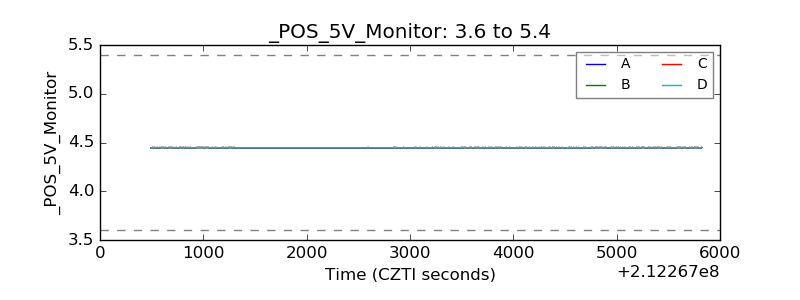 |
| _ROLL_ROT | 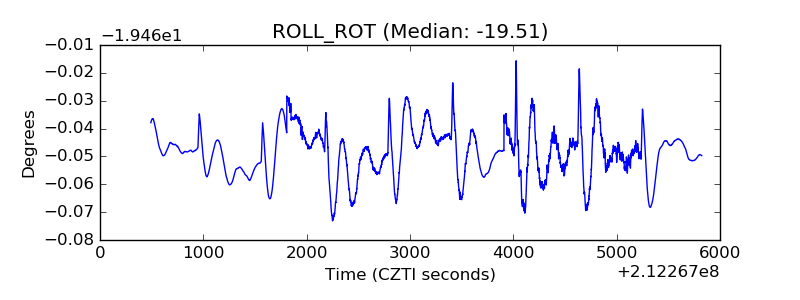 |
| _Roll_DEC | 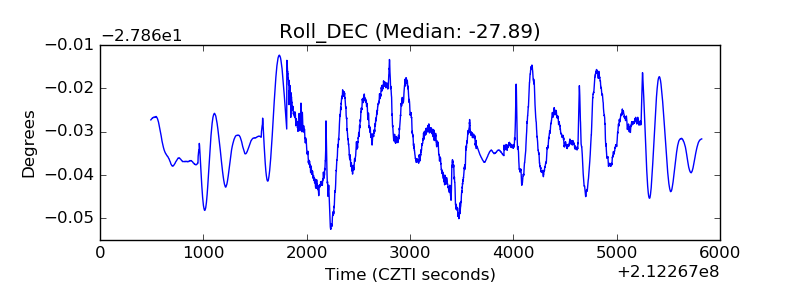 |
| _Roll_RA | 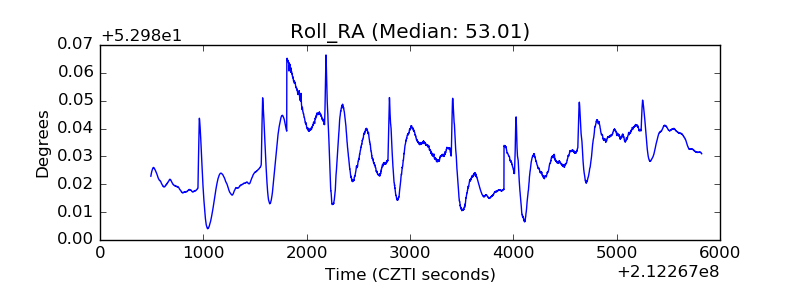 |
| Veto Counter | 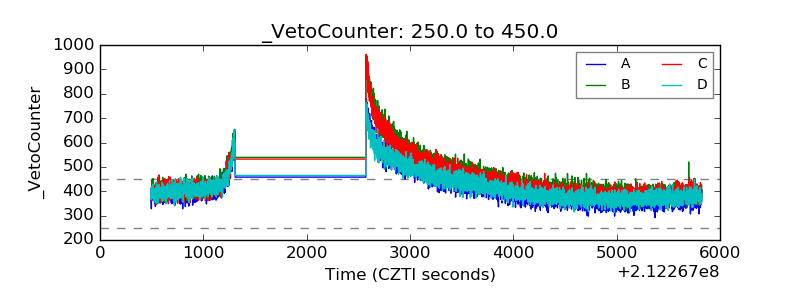 |