| Param | Original file | Final file |
|---|---|---|
| Filename | modeM0/AS1G05_152T01_9000000676cztM0_level2.fits | modeM0/AS1G05_152T01_9000000676cztM0_level2_quad_clean.evt |
| Size (bytes) | 380,761,920 | 434,021,760 |
| Size | 363.1 MB | 413.9 MB |
| Events in quadrant A | 2,321,752 | 2,754,296 |
| Events in quadrant B | 2,111,766 | 2,587,816 |
| Events in quadrant C | 2,318,436 | 2,709,675 |
| Events in quadrant D | 1,820,708 | 2,138,776 |
| Mode M9 | |||
|---|---|---|---|
| Quadrant | BADHDUFLAG | Total packets | Discarded packets |
| A | 0 | 55 | 0 |
| B | 0 | 55 | 0 |
| C | 0 | 55 | 0 |
| D | 0 | 55 | 0 |
| Mode M0 | |||
|---|---|---|---|
| Quadrant | BADHDUFLAG | Total packets | Discarded packets |
| A | 0 | 92282 | 0 |
| B | 0 | 88494 | 0 |
| C | 0 | 103518 | 0 |
| D | 0 | 147813 | 0 |
| Mode SS | |||
|---|---|---|---|
| Quadrant | BADHDUFLAG | Total packets | Discarded packets |
| A | 0 | 890 | 0 |
| B | 0 | 892 | 0 |
| C | 0 | 904 | 0 |
| D | 0 | 902 | 0 |
| Quadrant | Total seconds | Saturated seconds | Saturation percentage |
|---|---|---|---|
| A | 43898 | 800 | 1.822406% |
| B | 40619 | 919 | 2.262488% |
| C | 43889 | 634 | 1.444553% |
| D | 43271 | 6120 | 14.143422% |
Noise dominated data is calculated using 1-second bins in cleaned event files. If a bin has >2000 counts, and if more than 50% of those come from <1% of pixels, then it is considered to be noise-dominated and hence unusable.
| Quadrant | # 1 sec bins | Bins with >0 counts | Bins with >2000 counts | High rate bins dominated by noise | Noise dominated (total time) | Noise dominated (detector-on time) | Marked lightcurve |
|---|---|---|---|---|---|---|---|
| A | 51595 | 45400 | 0 | 0 | 0.00% | 0.00% |  |
| B | 47509 | 41651 | 0 | 0 | 0.00% | 0.00% | 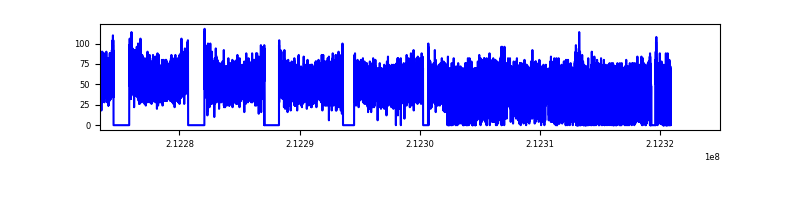 |
| C | 51595 | 45375 | 0 | 0 | 0.00% | 0.00% | 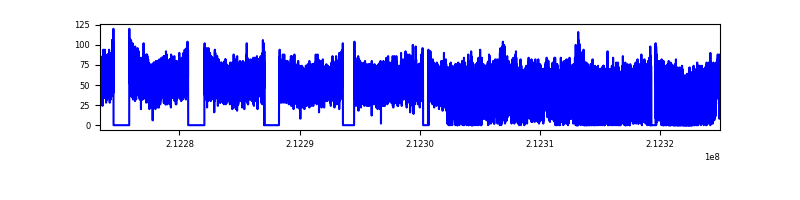 |
| D | 51595 | 44512 | 0 | 0 | 0.00% | 0.00% | 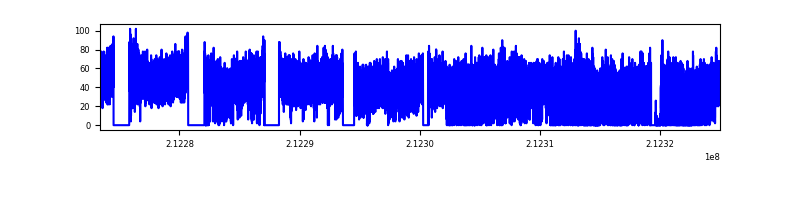 |
Top three noisy pixels from each quadrant. If the there are fewer than three noisy pixels in the level2.evt file, extra rows are filled as -1
| Pixel properties | Quadrant properties | ||||||
|---|---|---|---|---|---|---|---|
| Quadrant | DetID | PixID | Counts | Sigma | Mean | Median | Sigma |
| A | 14 | 188 | 2277 | 10.84 | 603 | 562 | 158.2 |
| A | 0 | 29 | 2257 | 10.71 | 603 | 562 | 158.2 |
| A | 7 | 110 | 2006 | 9.13 | 603 | 562 | 158.2 |
| B | 2 | 9 | 1848 | 11.48 | 558 | 531 | 114.7 |
| B | 12 | 226 | 1478 | 8.26 | 558 | 531 | 114.7 |
| B | 14 | 254 | 1427 | 7.81 | 558 | 531 | 114.7 |
| C | 12 | 241 | 1703 | 7.02 | 611 | 565 | 162.1 |
| C | 1 | 81 | 1692 | 6.95 | 611 | 565 | 162.1 |
| C | 1 | 80 | 1685 | 6.91 | 611 | 565 | 162.1 |
| D | 3 | 14 | 1489 | 7.16 | 519 | 472 | 142.0 |
| D | 11 | 82 | 1391 | 6.47 | 519 | 472 | 142.0 |
| D | 6 | 231 | 1344 | 6.14 | 519 | 472 | 142.0 |
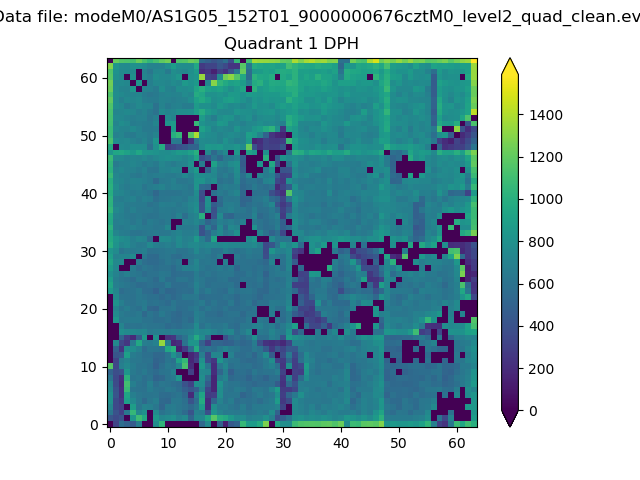
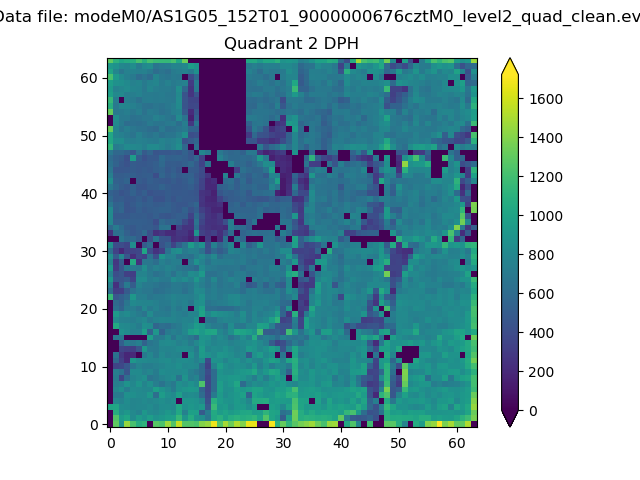
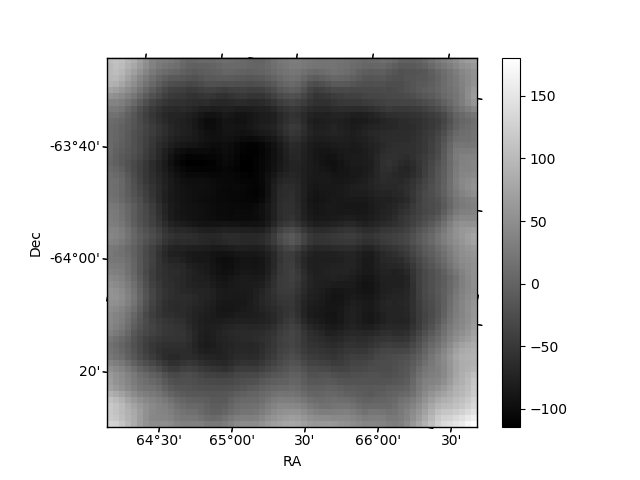
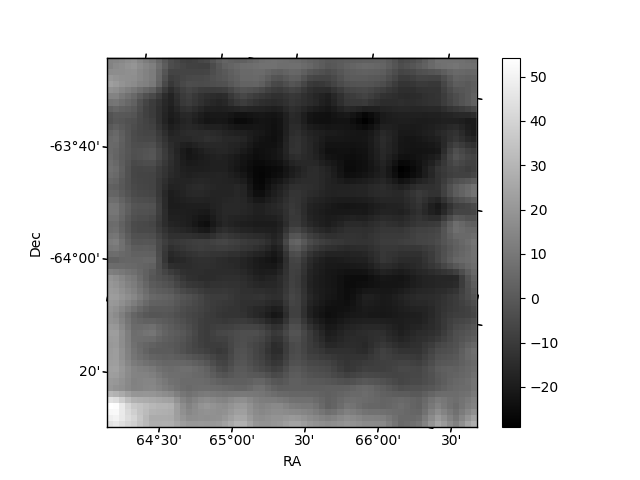
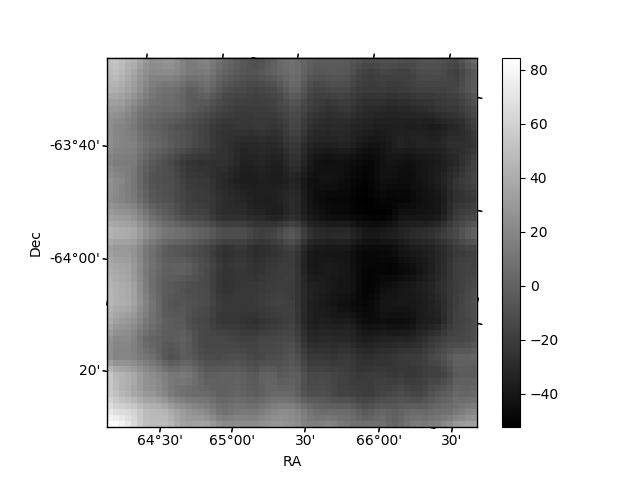
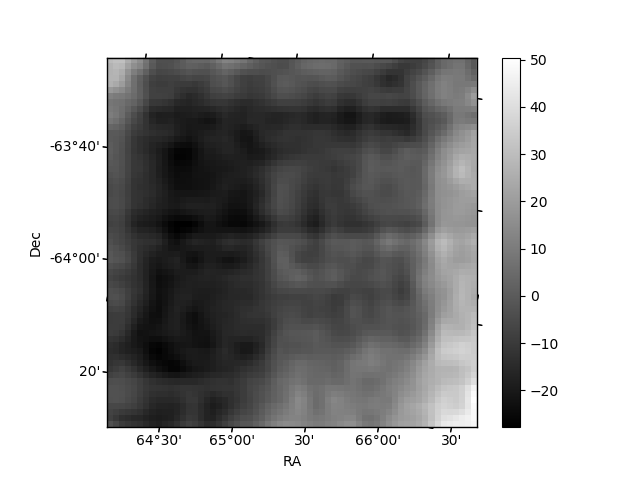
Histogram calculated using DETX and DETY for each event in the final _common_clean file
| Quadrant A | 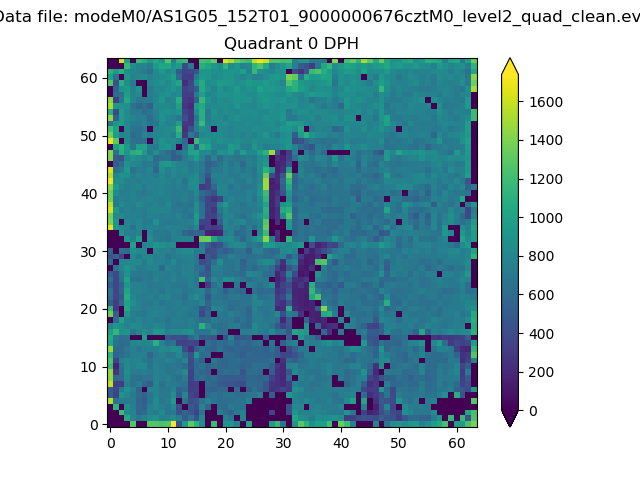 |
 |
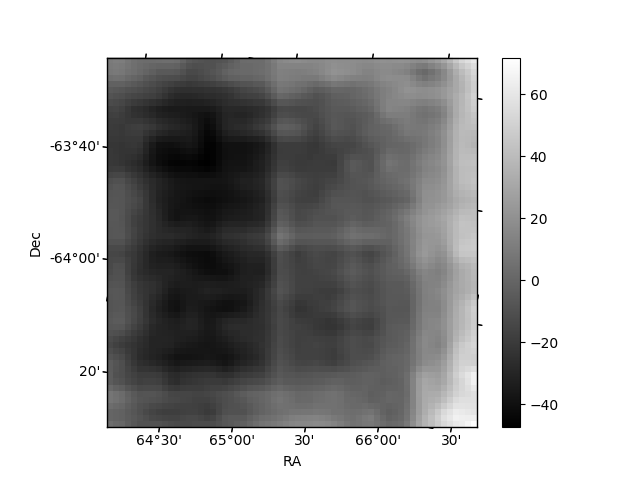
Quadrant B |
|---|---|---|---|
| Quadrant D | 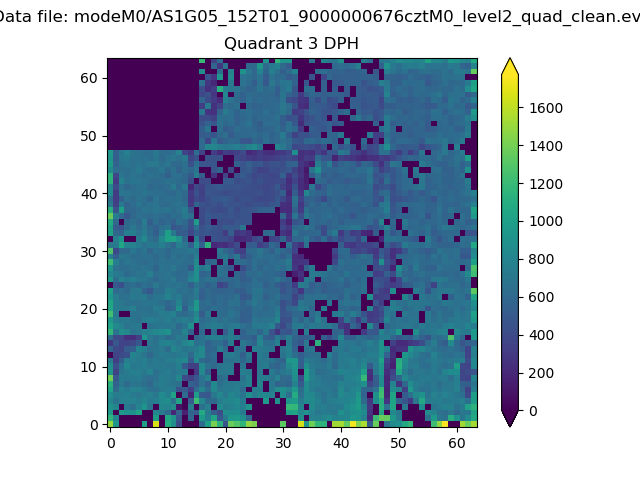 |
 |
Quadrant C |
| Plot type | Count rate plots | Images |
|---|---|---|
| Comparison with Poisson distribution Blue bars denote a histogram of data divided into 1 sec bins. Red curve is a Poisson curve with rate = median count rate of data. |
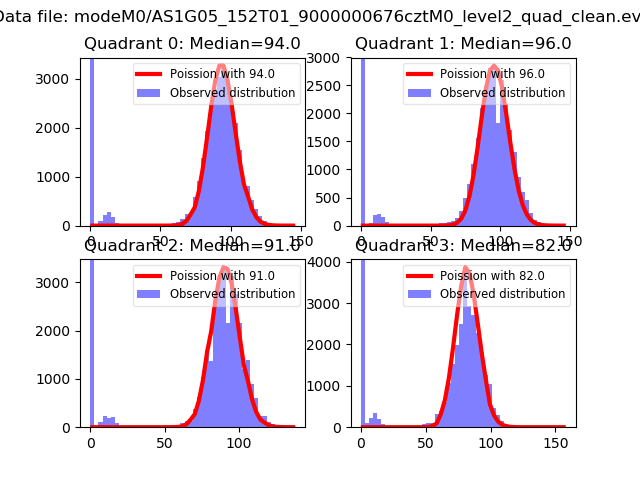 |
 |
| Quadrant-wise count rates Data is divided into 100 sec bins |
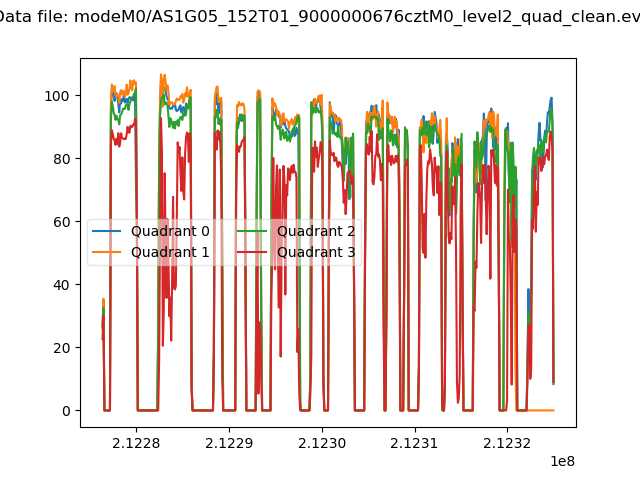 |
|
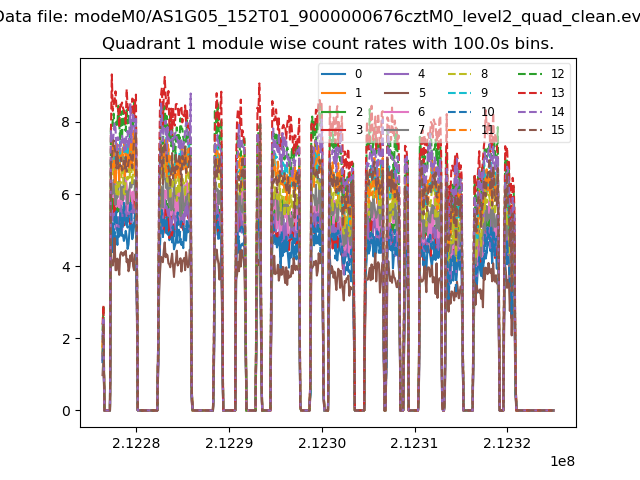
| Module-wise count rates for Quadrant A Data is divided into 100 sec bins |
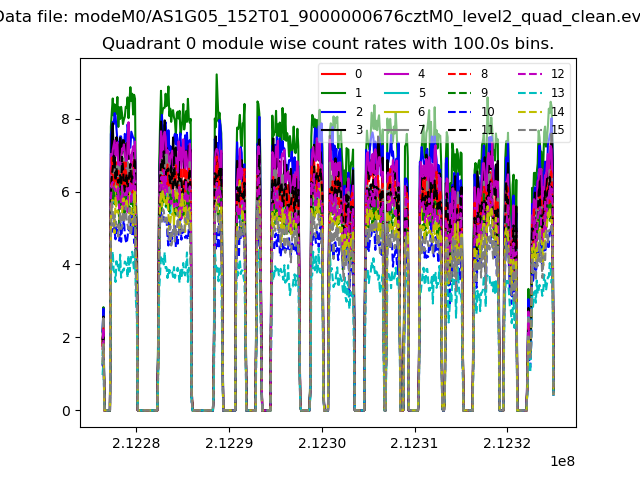 |
 |
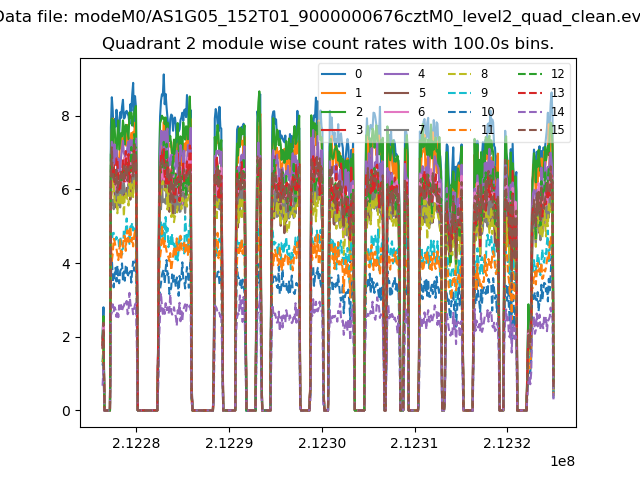
| Module-wise count rates for Quadrant B Data is divided into 100 sec bins |
 |
 |
| Module-wise count rates for Quadrant C Data is divided into 100 sec bins |
 |
 |
| Module-wise count rates for Quadrant D Data is divided into 100 sec bins |
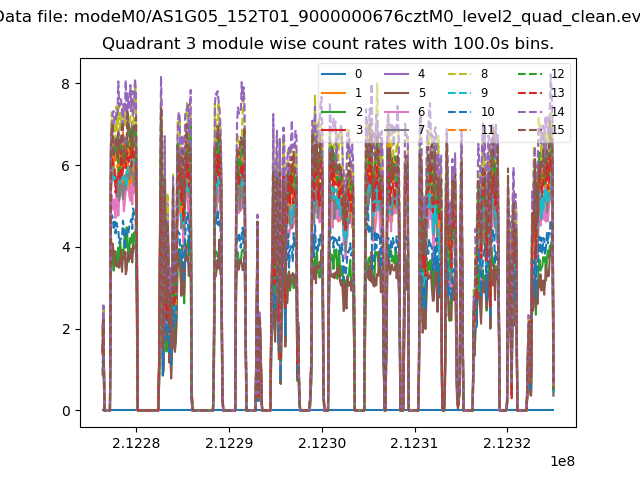 |
 |
| Parameter | Plot |
|---|---|
| CZT HV Monitor | 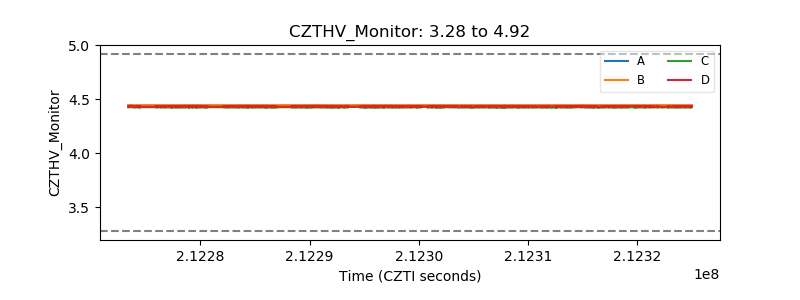 |
| D_VDD | 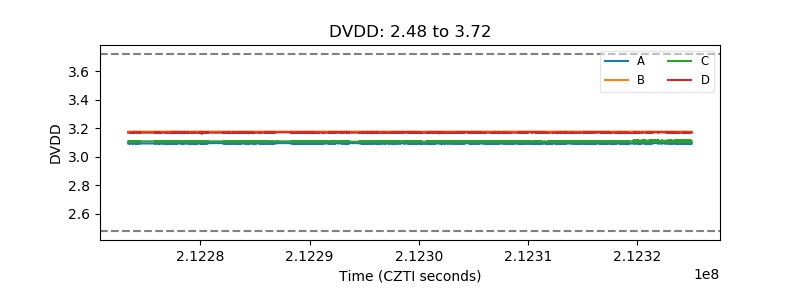 |
| Temperature 1 | 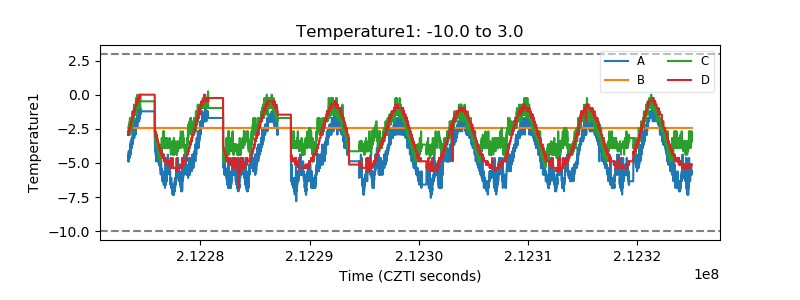 |
| Veto HV Monitor | 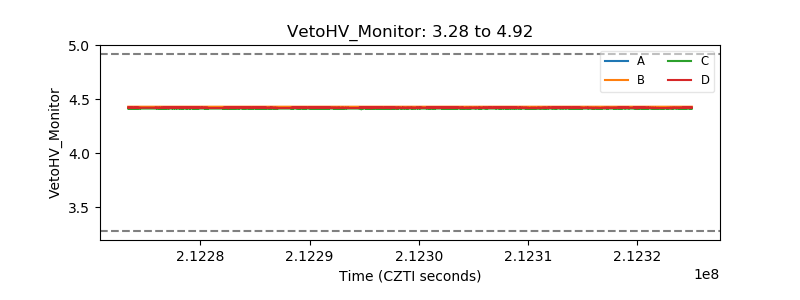 |
| Veto LLD | 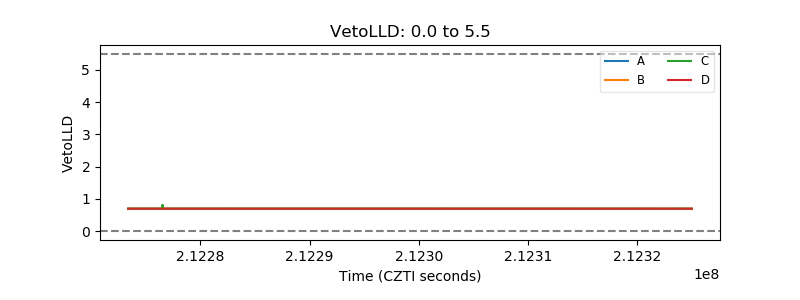 |
| Alpha Counter | 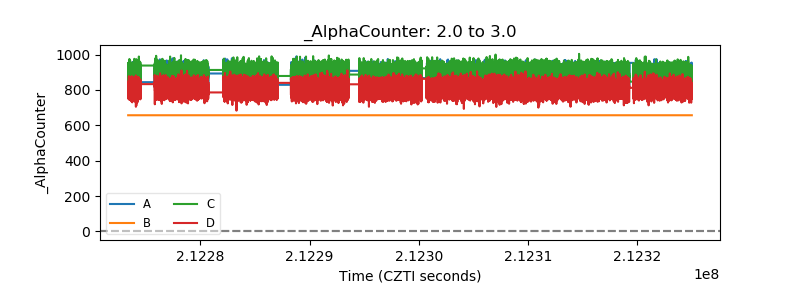 |
| _CPM_Rate | 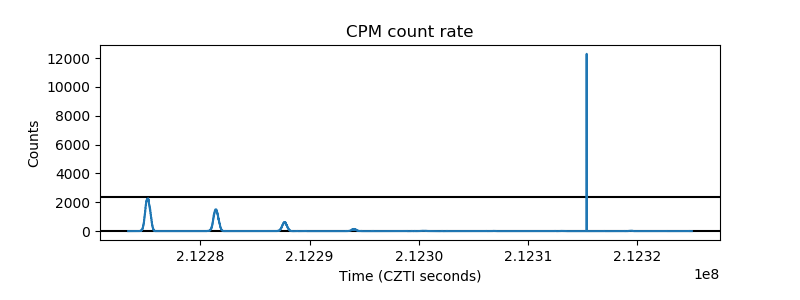 |
| CZT Counter | 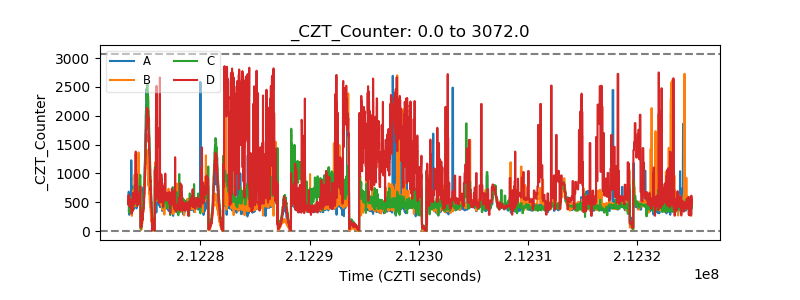 |
| +2.5 Volts monitor | 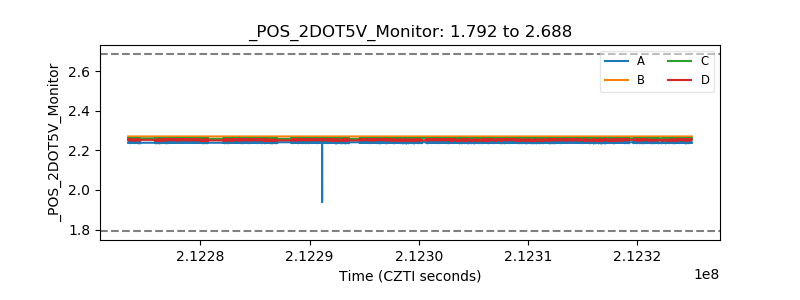 |
| +5 Volts monitor | 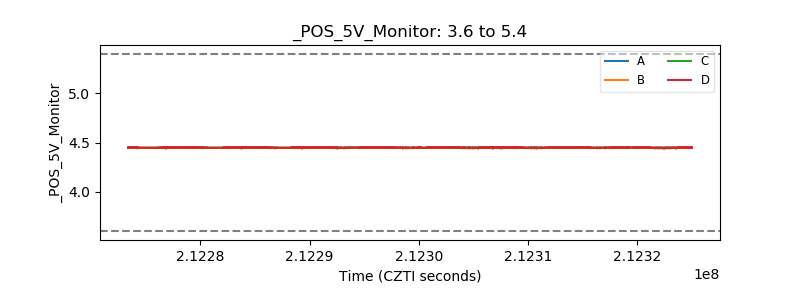 |
| _ROLL_ROT | 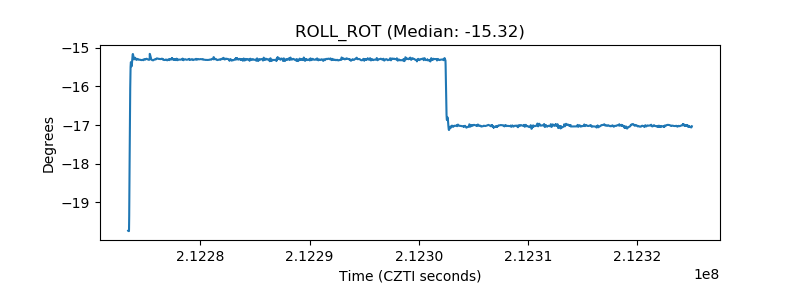 |
| _Roll_DEC | 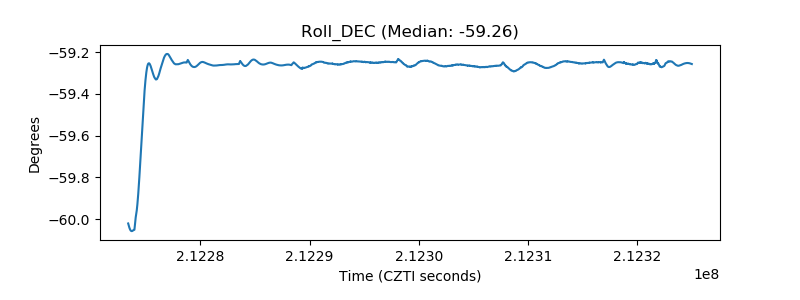 |
| _Roll_RA | 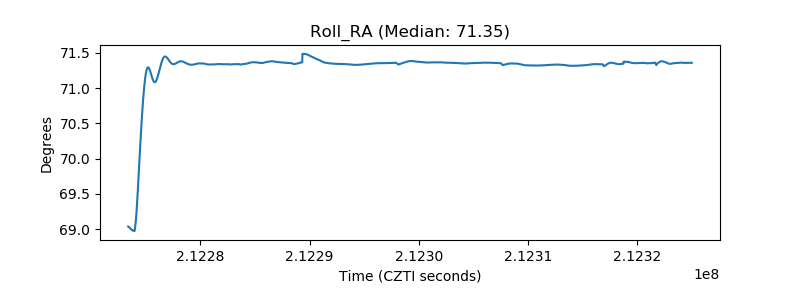 |
| Veto Counter | 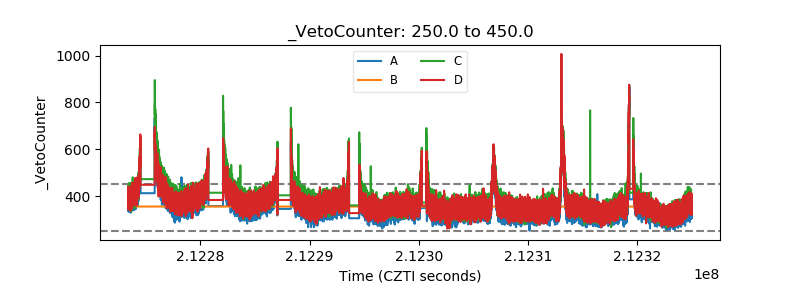 |