| Param | Original file | Final file |
|---|---|---|
| Filename | modeM0/AS1G05_152T01_9000000676_05340cztM0_level2.evt | modeM0/AS1G05_152T01_9000000676_05340cztM0_level2_quad_clean.evt |
| Size (bytes) | 202,512,960 | 36,973,440 |
| Size | 193.1 MB | 35.3 MB |
| Events in quadrant A | 1,282,253 | 238,268 |
| Events in quadrant B | 1,412,064 | 244,856 |
| Events in quadrant C | 1,513,062 | 241,531 |
| Events in quadrant D | 1,759,309 | 220,445 |
| Mode M9 | |||
|---|---|---|---|
| Quadrant | BADHDUFLAG | Total packets | Discarded packets |
| A | 0 | 13 | 0 |
| B | 0 | 13 | 0 |
| C | 0 | 13 | 0 |
| D | 0 | 13 | 0 |
| Mode M0 | |||
|---|---|---|---|
| Quadrant | BADHDUFLAG | Total packets | Discarded packets |
| A | 0 | 5306 | 2 |
| B | 0 | 5709 | 3 |
| C | 0 | 6154 | 1 |
| D | 0 | 6896 | 3 |
| Mode SS | |||
|---|---|---|---|
| Quadrant | BADHDUFLAG | Total packets | Discarded packets |
| A | 0 | 52 | 0 |
| B | 0 | 52 | 0 |
| C | 0 | 52 | 0 |
| D | 0 | 52 | 0 |
| Quadrant | Total seconds | Saturated seconds | Saturation percentage |
|---|---|---|---|
| A | 2416 | 42 | 1.738411% |
| B | 2415 | 77 | 3.188406% |
| C | 2416 | 31 | 1.283113% |
| D | 2415 | 157 | 6.501035% |
Noise dominated data is calculated using 1-second bins in cleaned event files. If a bin has >2000 counts, and if more than 50% of those come from <1% of pixels, then it is considered to be noise-dominated and hence unusable.
| Quadrant | # 1 sec bins | Bins with >0 counts | Bins with >2000 counts | High rate bins dominated by noise | Noise dominated (total time) | Noise dominated (detector-on time) | Marked lightcurve |
|---|---|---|---|---|---|---|---|
| A | 3721 | 2416 | 2 | 2 | 0.05% | 0.08% | 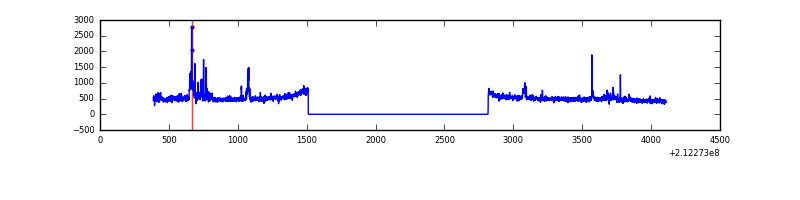 |
| B | 3721 | 2416 | 11 | 11 | 0.30% | 0.46% | 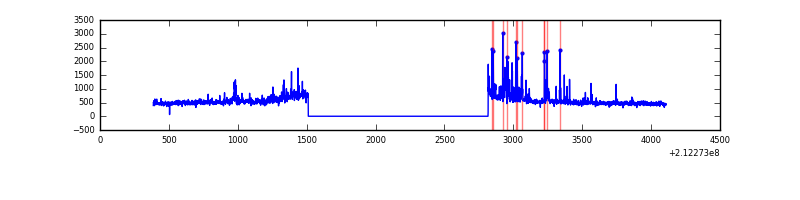 |
| C | 3721 | 2417 | 0 | 0 | 0.00% | 0.00% | 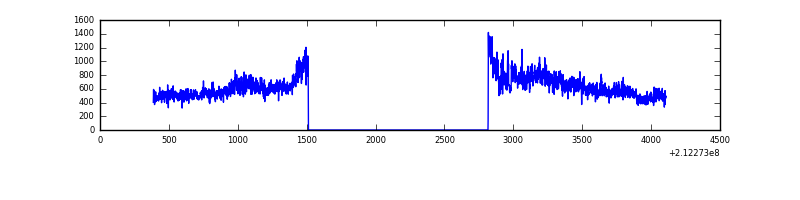 |
| D | 3721 | 2417 | 122 | 122 | 3.28% | 5.05% | 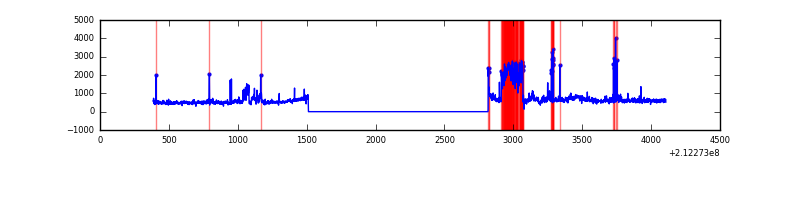 |
Top three noisy pixels from each quadrant. If the there are fewer than three noisy pixels in the level2.evt file, extra rows are filled as -1
| Pixel properties | Quadrant properties | ||||||
|---|---|---|---|---|---|---|---|
| Quadrant | DetID | PixID | Counts | Sigma | Mean | Median | Sigma |
| A | 13 | 251 | 84927 | 1303.46 | 306 | 299 | 64.9 |
| A | 15 | 174 | 13039 | 196.22 | 306 | 299 | 64.9 |
| A | 0 | 50 | 6382 | 93.69 | 306 | 299 | 64.9 |
| B | 10 | 16 | 99751 | 1655.28 | 311 | 303 | 60.1 |
| B | 15 | 204 | 45789 | 757.1 | 311 | 303 | 60.1 |
| B | 4 | 80 | 27120 | 446.36 | 311 | 303 | 60.1 |
| C | 1 | 16 | 337704 | 4791.23 | 300 | 301 | 70.4 |
| C | 13 | 61 | 2430 | 30.23 | 300 | 301 | 70.4 |
| C | 14 | 67 | 2145 | 26.19 | 300 | 301 | 70.4 |
| D | 2 | 63 | 288390 | 3900.97 | 292 | 281 | 73.9 |
| D | 9 | 82 | 190117 | 2570.36 | 292 | 281 | 73.9 |
| D | 13 | 105 | 53028 | 714.19 | 292 | 281 | 73.9 |
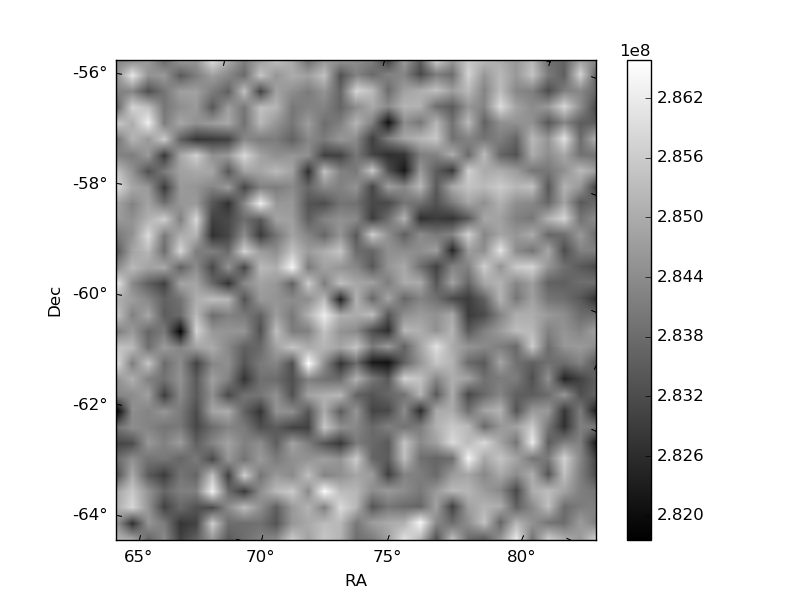
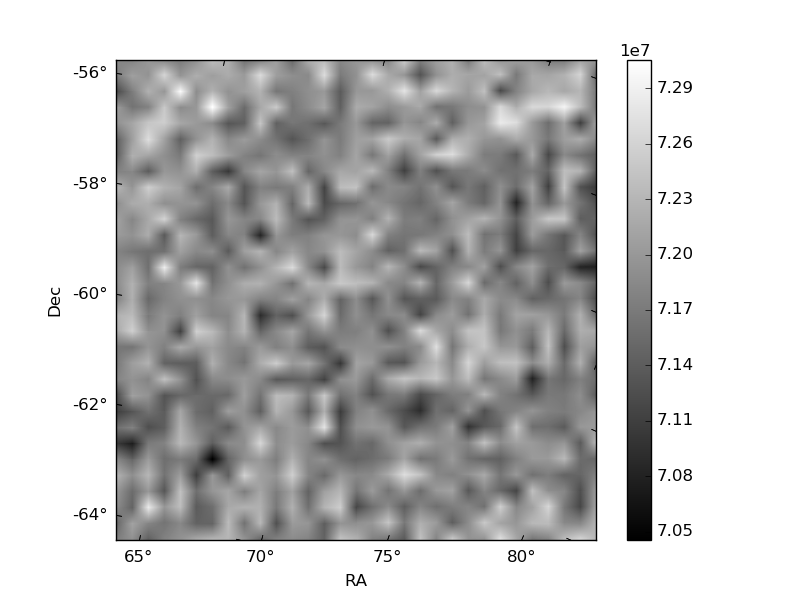
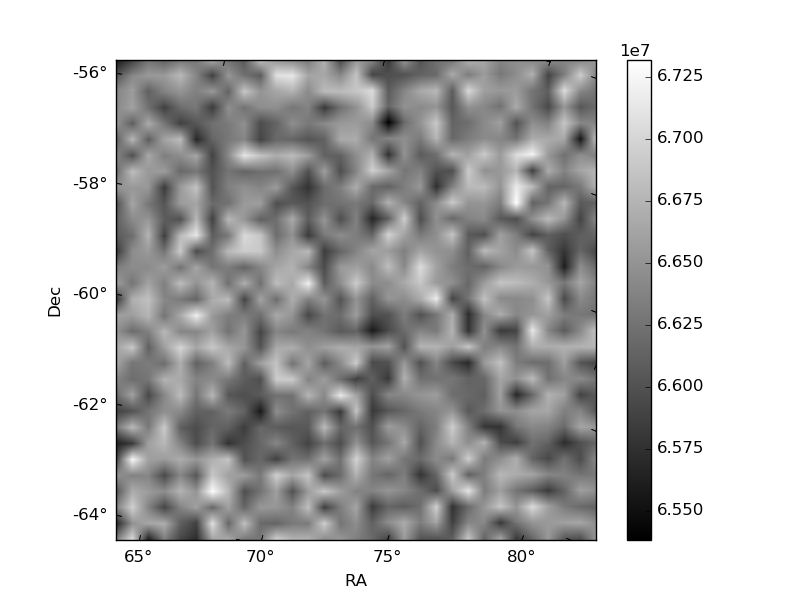
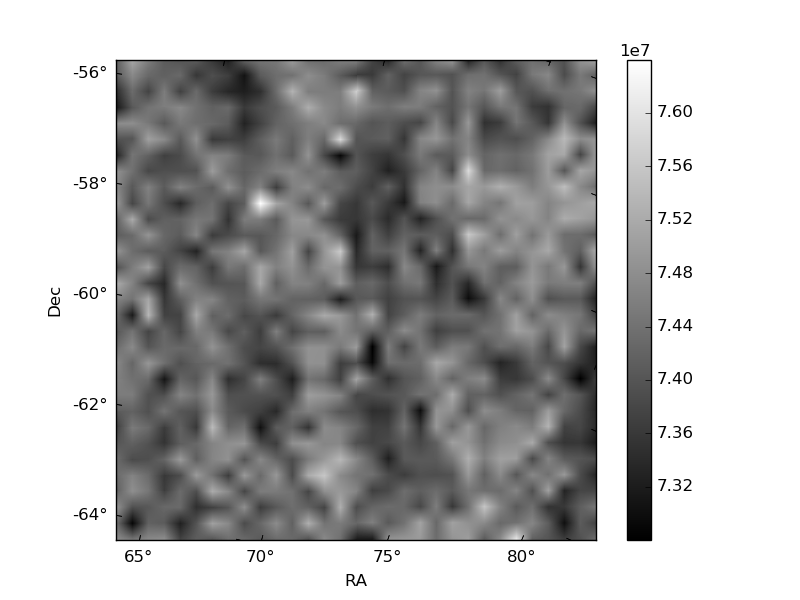
Histogram calculated using DETX and DETY for each event in the final _common_clean file
| Quadrant A | 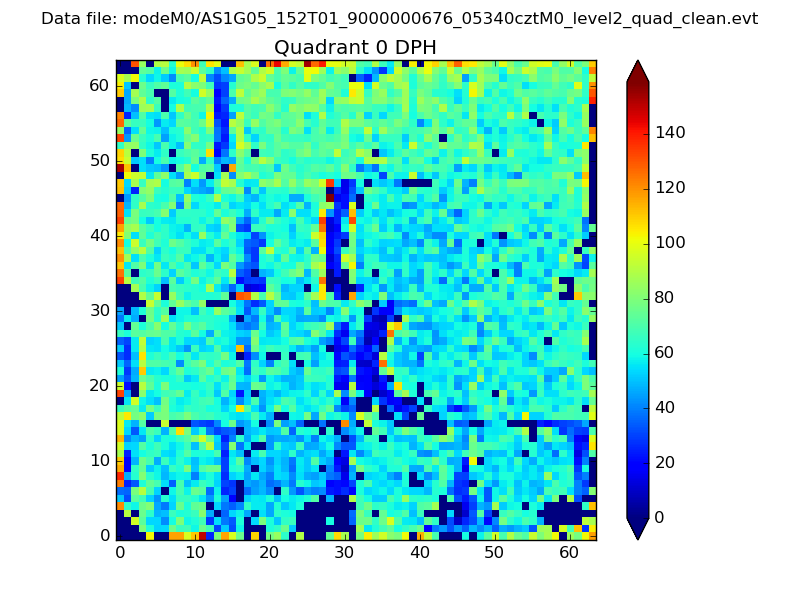 |
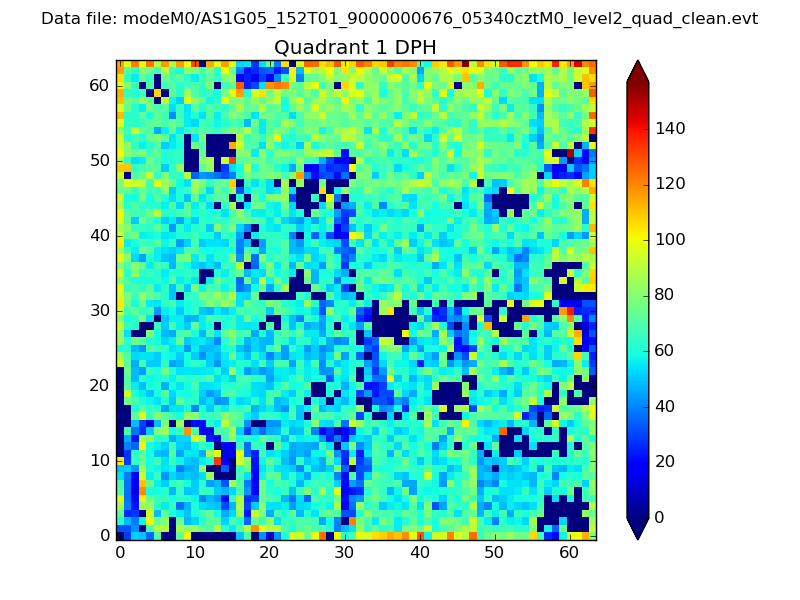 |
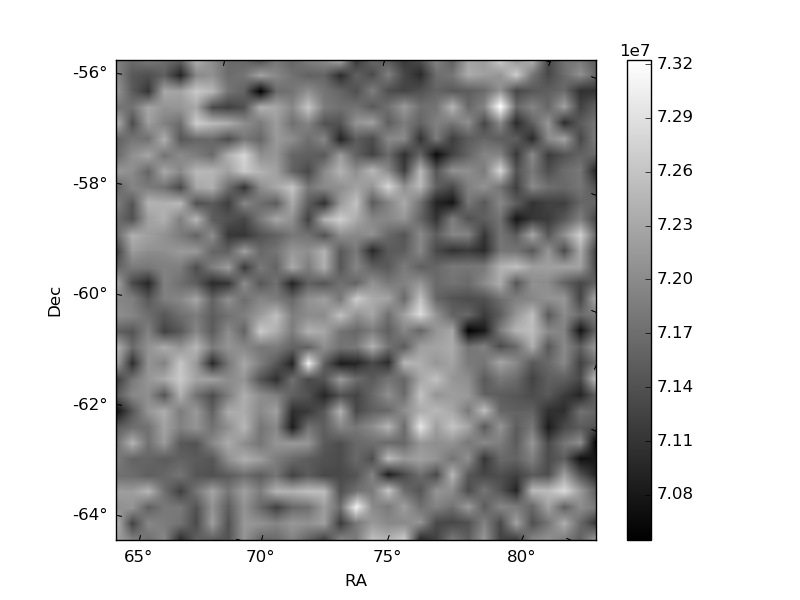
Quadrant B |
|---|---|---|---|
| Quadrant D | 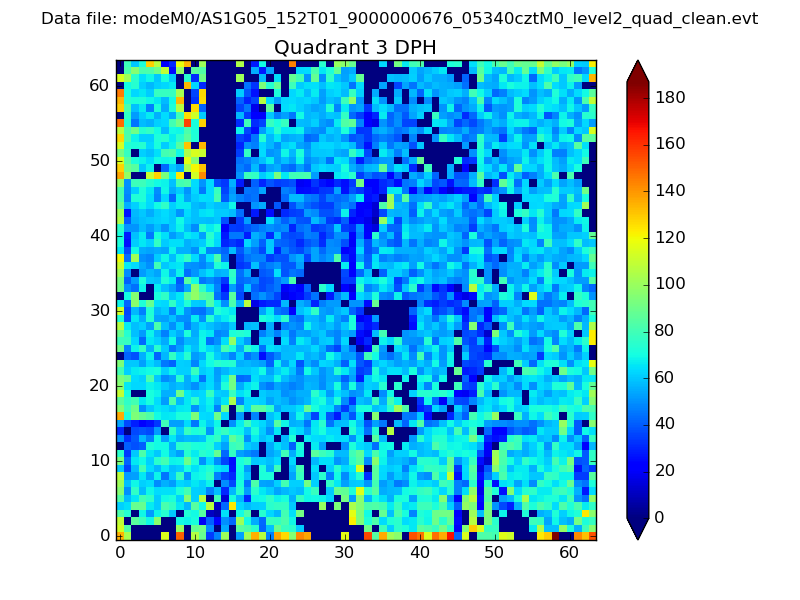 |
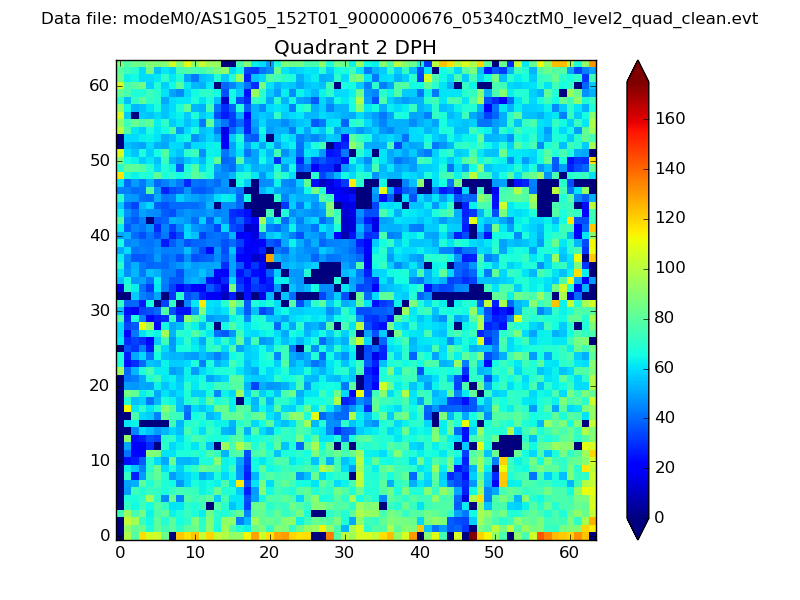 |
Quadrant C |
| Plot type | Count rate plots | Images |
|---|---|---|
| Comparison with Poisson distribution Blue bars denote a histogram of data divided into 1 sec bins. Red curve is a Poisson curve with rate = median count rate of data. |
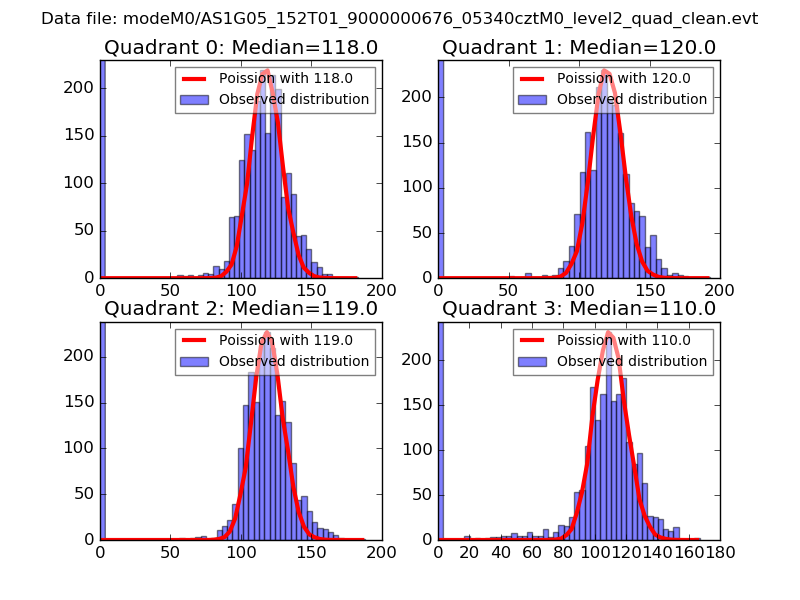 |
 |
| Quadrant-wise count rates Data is divided into 100 sec bins |
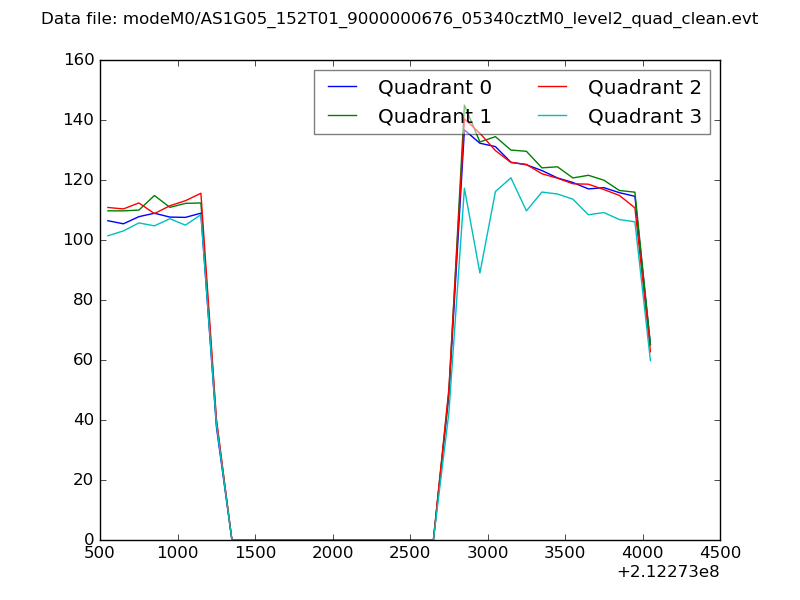 |
|
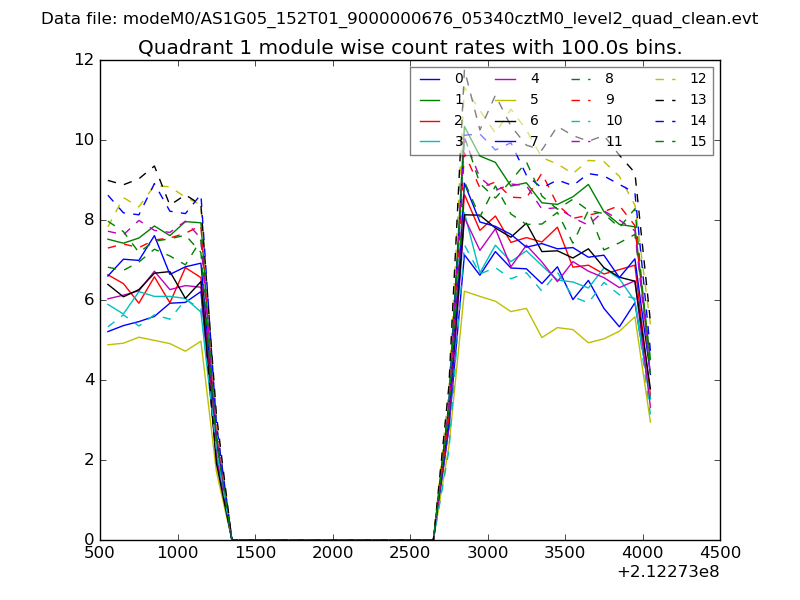
| Module-wise count rates for Quadrant A Data is divided into 100 sec bins |
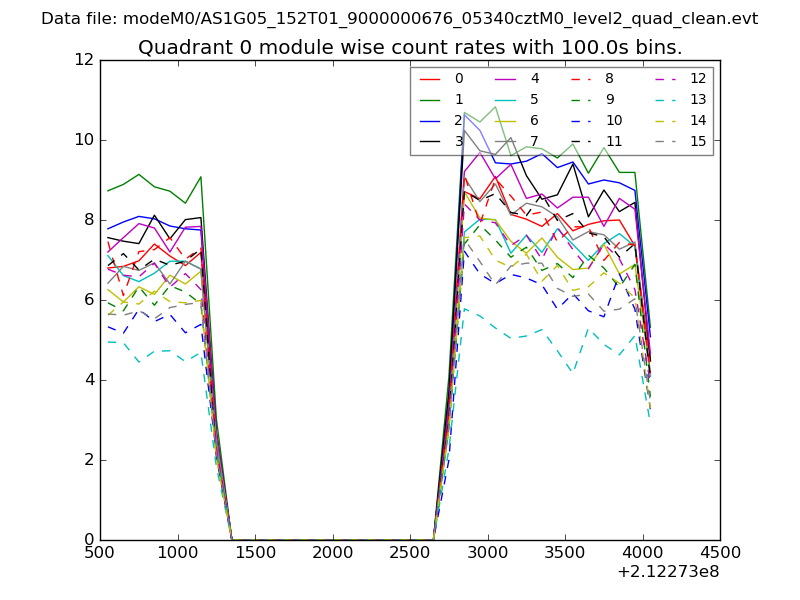 |
 |
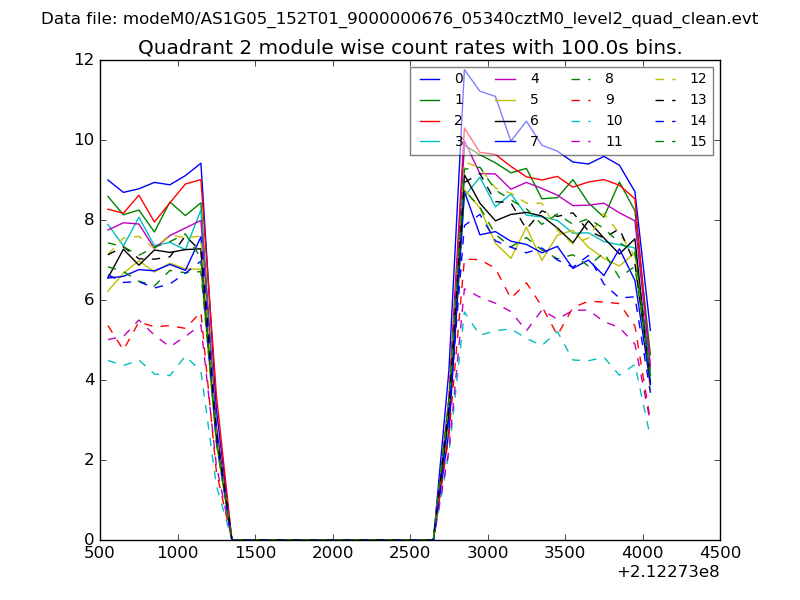
| Module-wise count rates for Quadrant B Data is divided into 100 sec bins |
 |
 |
| Module-wise count rates for Quadrant C Data is divided into 100 sec bins |
 |
 |
| Module-wise count rates for Quadrant D Data is divided into 100 sec bins |
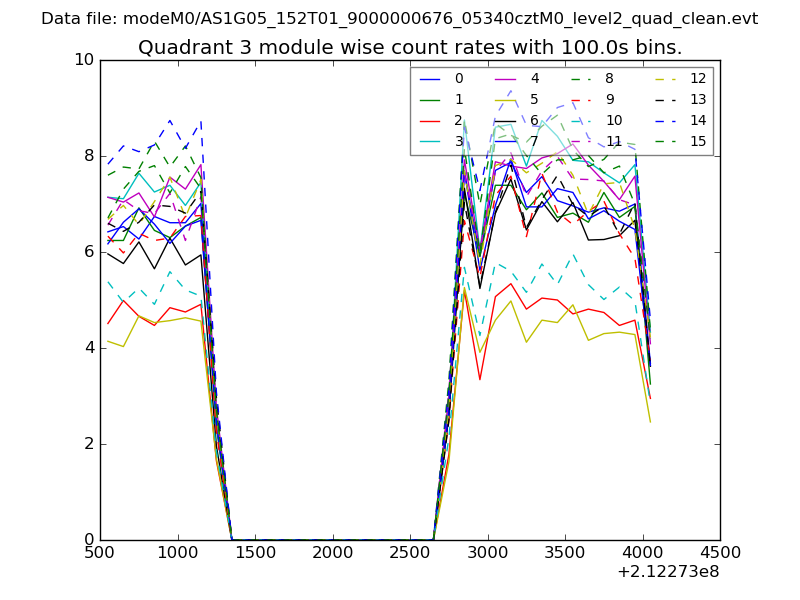 |
 |
| Parameter | Plot |
|---|---|
| CZT HV Monitor | 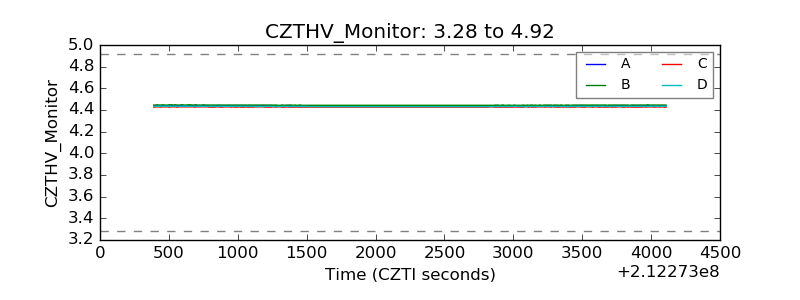 |
| D_VDD | 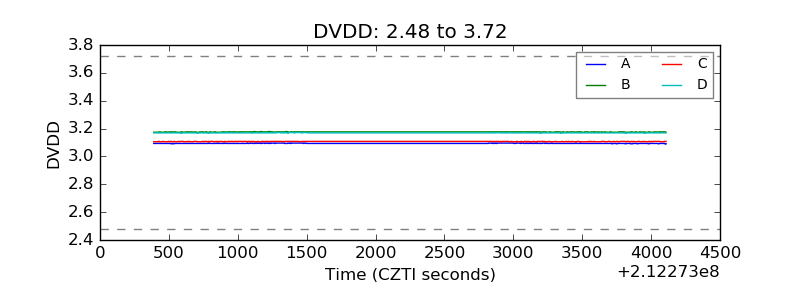 |
| Temperature 1 | 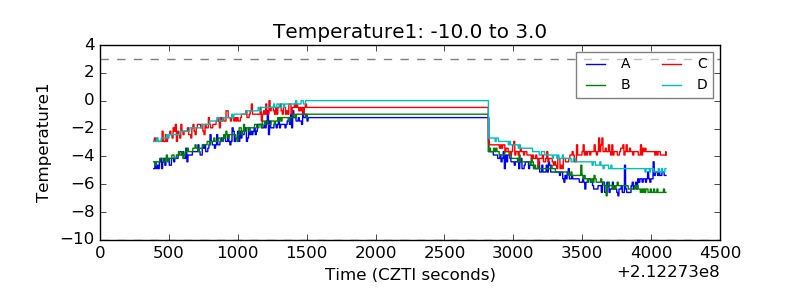 |
| Veto HV Monitor | 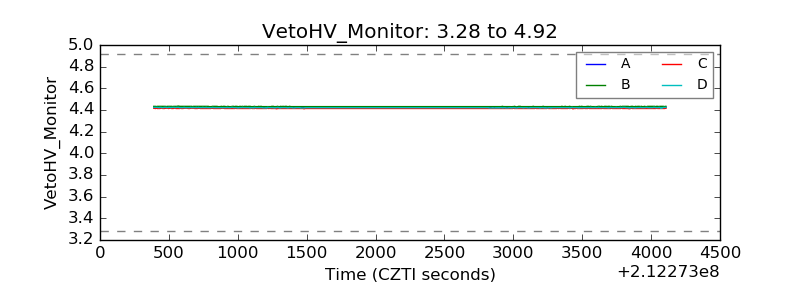 |
| Veto LLD | 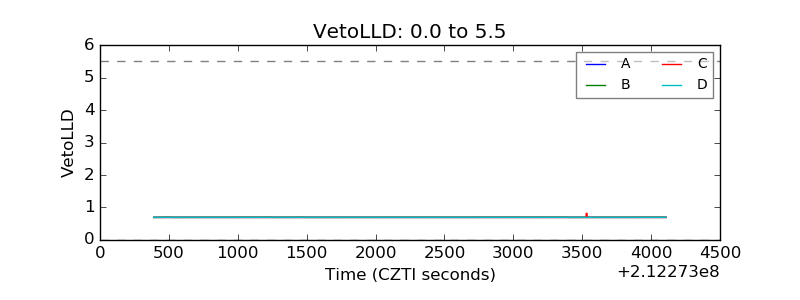 |
| Alpha Counter |  |
| _CPM_Rate | 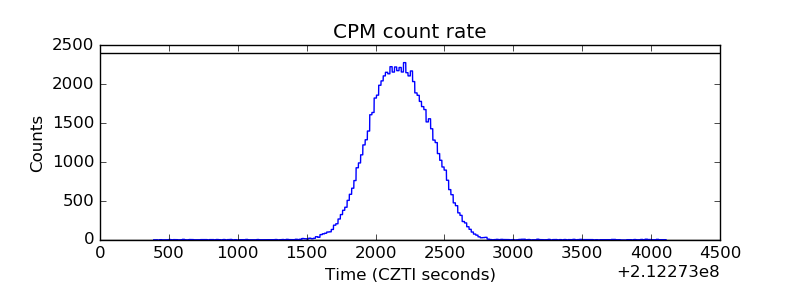 |
| CZT Counter | 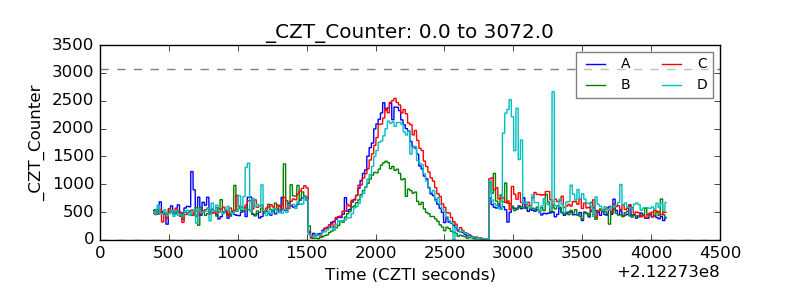 |
| +2.5 Volts monitor | 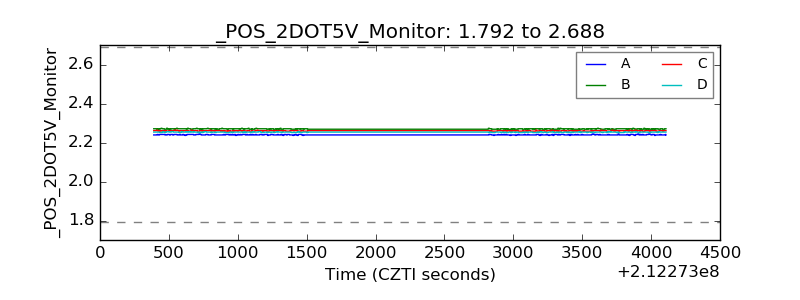 |
| +5 Volts monitor |  |
| _ROLL_ROT | 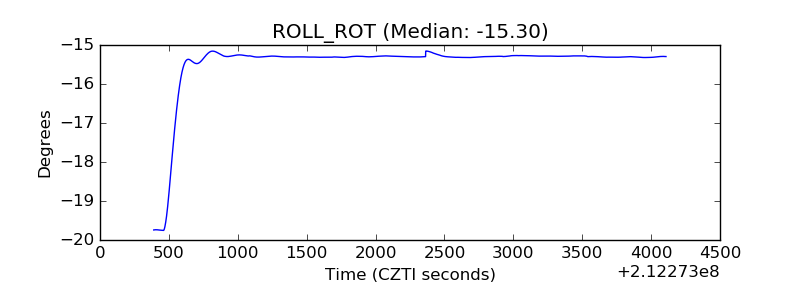 |
| _Roll_DEC | 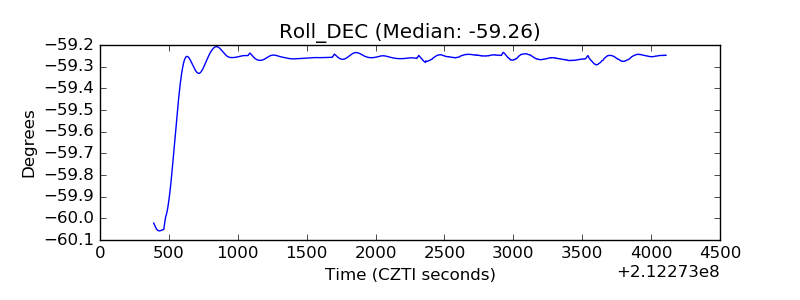 |
| _Roll_RA | 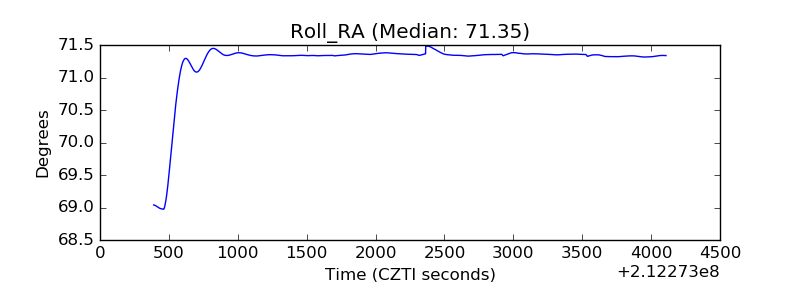 |
| Veto Counter | 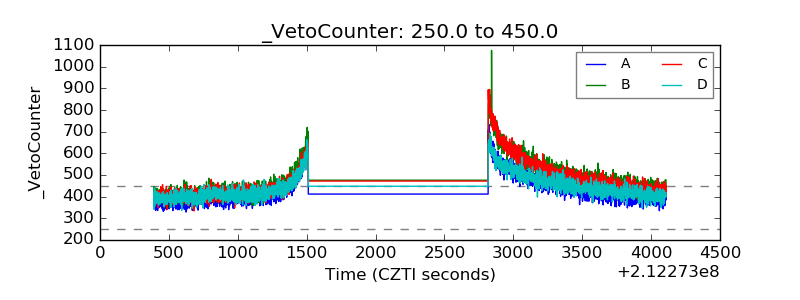 |