| Param | Original file | Final file |
|---|---|---|
| Filename | modeM0/AS1G05_152T01_9000000676_05341cztM0_level2.evt | modeM0/AS1G05_152T01_9000000676_05341cztM0_level2_quad_clean.evt |
| Size (bytes) | 519,949,440 | 95,060,160 |
| Size | 495.9 MB | 90.7 MB |
| Events in quadrant A | 2,900,278 | 626,649 |
| Events in quadrant B | 3,189,780 | 643,341 |
| Events in quadrant C | 3,753,323 | 629,681 |
| Events in quadrant D | 5,482,101 | 545,344 |
| Mode M9 | |||
|---|---|---|---|
| Quadrant | BADHDUFLAG | Total packets | Discarded packets |
| A | 0 | 18 | 0 |
| B | 0 | 18 | 0 |
| C | 0 | 18 | 0 |
| D | 0 | 19 | 0 |
| Mode M0 | |||
|---|---|---|---|
| Quadrant | BADHDUFLAG | Total packets | Discarded packets |
| A | 0 | 12980 | 3 |
| B | 0 | 13701 | 2 |
| C | 0 | 15219 | 4 |
| D | 0 | 20555 | 2 |
| Mode SS | |||
|---|---|---|---|
| Quadrant | BADHDUFLAG | Total packets | Discarded packets |
| A | 0 | 126 | 0 |
| B | 0 | 126 | 0 |
| C | 0 | 126 | 0 |
| D | 0 | 126 | 0 |
| Quadrant | Total seconds | Saturated seconds | Saturation percentage |
|---|---|---|---|
| A | 6211 | 51 | 0.821124% |
| B | 6211 | 76 | 1.223635% |
| C | 6210 | 20 | 0.322061% |
| D | 6211 | 831 | 13.379488% |
Noise dominated data is calculated using 1-second bins in cleaned event files. If a bin has >2000 counts, and if more than 50% of those come from <1% of pixels, then it is considered to be noise-dominated and hence unusable.
| Quadrant | # 1 sec bins | Bins with >0 counts | Bins with >2000 counts | High rate bins dominated by noise | Noise dominated (total time) | Noise dominated (detector-on time) | Marked lightcurve |
|---|---|---|---|---|---|---|---|
| A | 7566 | 6212 | 30 | 30 | 0.40% | 0.48% | 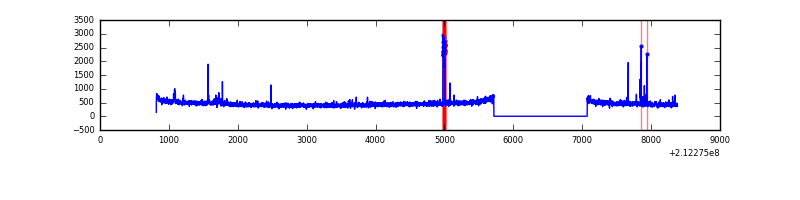 |
| B | 7566 | 6212 | 35 | 35 | 0.46% | 0.56% | 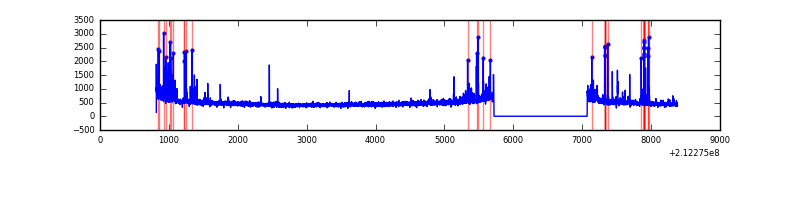 |
| C | 7566 | 6212 | 0 | 0 | 0.00% | 0.00% | 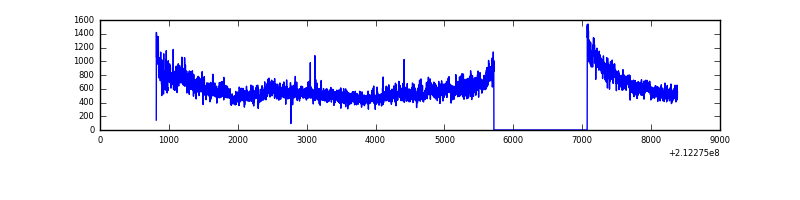 |
| D | 7565 | 6211 | 829 | 829 | 10.96% | 13.35% | 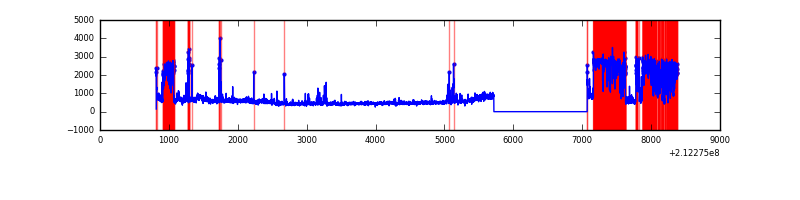 |
Top three noisy pixels from each quadrant. If the there are fewer than three noisy pixels in the level2.evt file, extra rows are filled as -1
| Pixel properties | Quadrant properties | ||||||
|---|---|---|---|---|---|---|---|
| Quadrant | DetID | PixID | Counts | Sigma | Mean | Median | Sigma |
| A | 15 | 174 | 70635 | 483.86 | 717 | 703 | 144.5 |
| A | 0 | 50 | 41951 | 285.39 | 717 | 703 | 144.5 |
| A | 13 | 251 | 29767 | 201.09 | 717 | 703 | 144.5 |
| B | 10 | 16 | 166570 | 1216.93 | 737 | 720 | 136.3 |
| B | 4 | 48 | 51247 | 370.74 | 737 | 720 | 136.3 |
| B | 15 | 204 | 49920 | 361.01 | 737 | 720 | 136.3 |
| C | 1 | 16 | 953119 | 5811.92 | 715 | 717 | 163.9 |
| C | 13 | 61 | 5885 | 31.54 | 715 | 717 | 163.9 |
| C | 14 | 67 | 3755 | 18.54 | 715 | 717 | 163.9 |
| D | 2 | 63 | 2268740 | 14177.04 | 655 | 636 | 160.0 |
| D | 9 | 82 | 497589 | 3106.26 | 655 | 636 | 160.0 |
| D | 8 | 195 | 42018 | 258.66 | 655 | 636 | 160.0 |
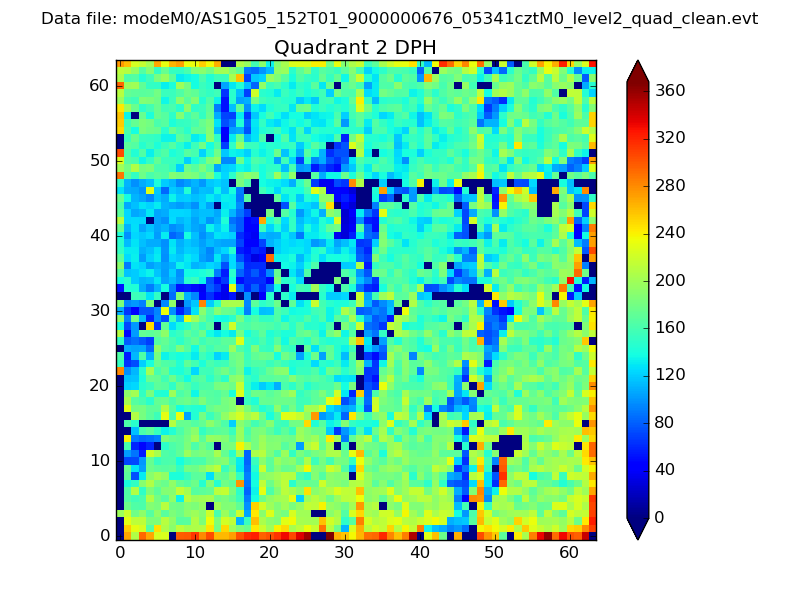
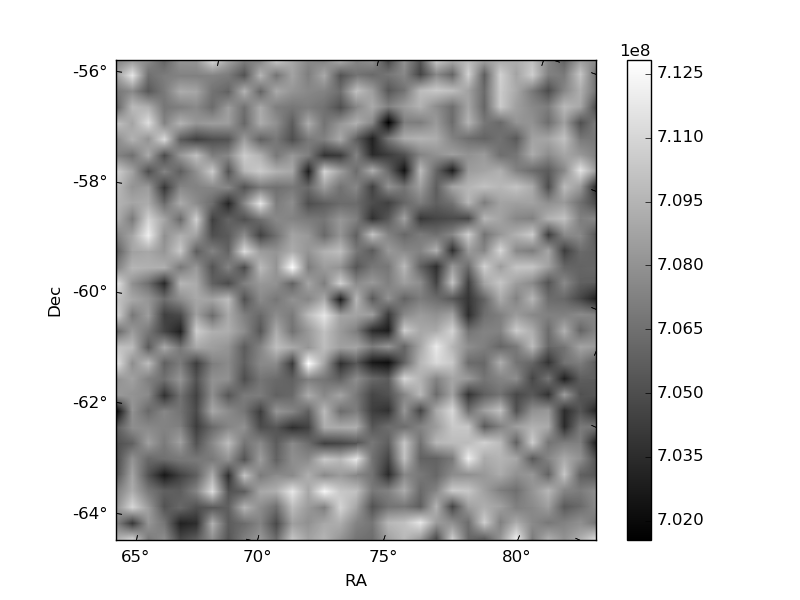
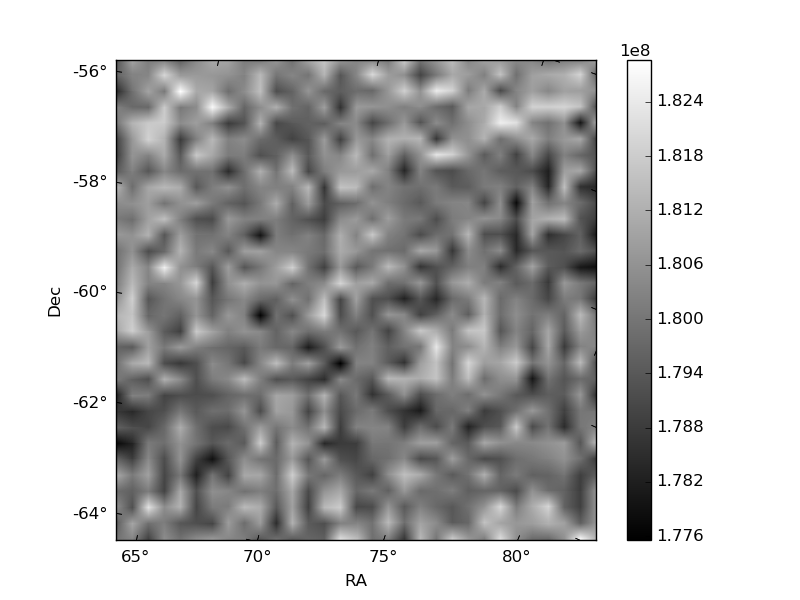
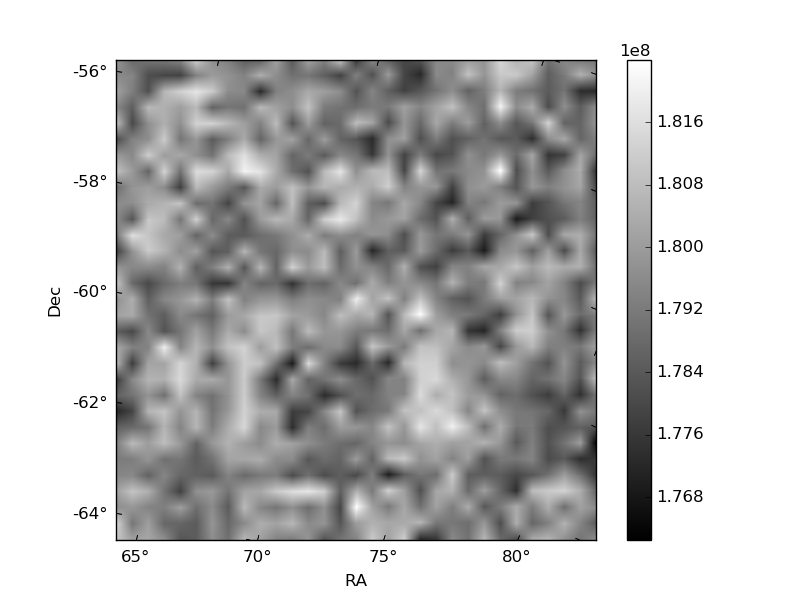
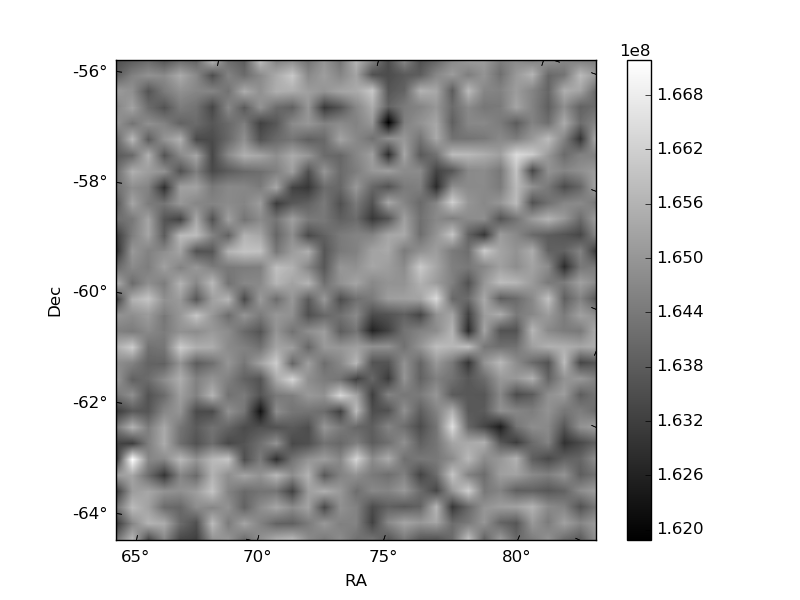
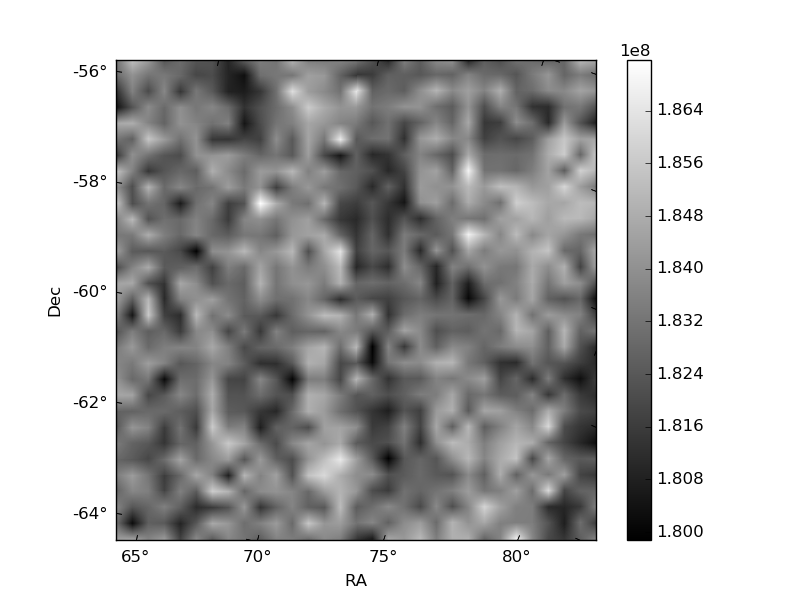
Histogram calculated using DETX and DETY for each event in the final _common_clean file
| Quadrant A | 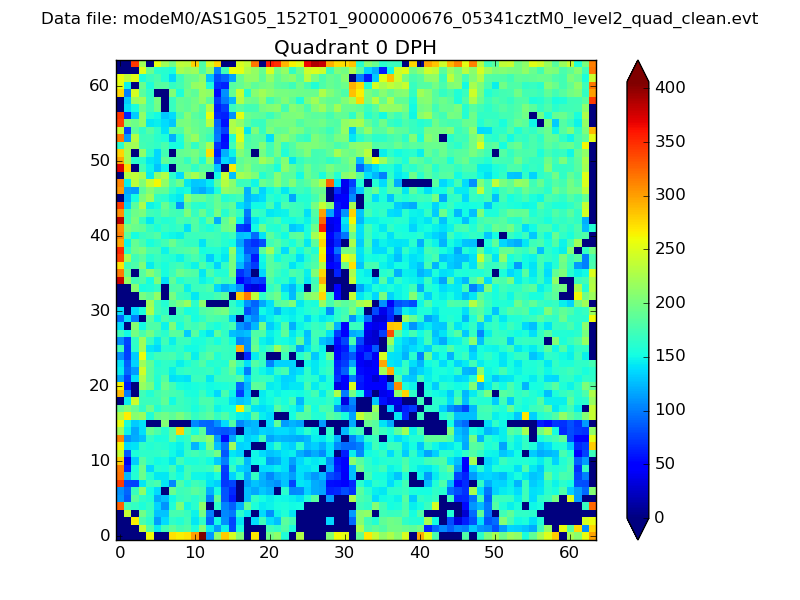 |
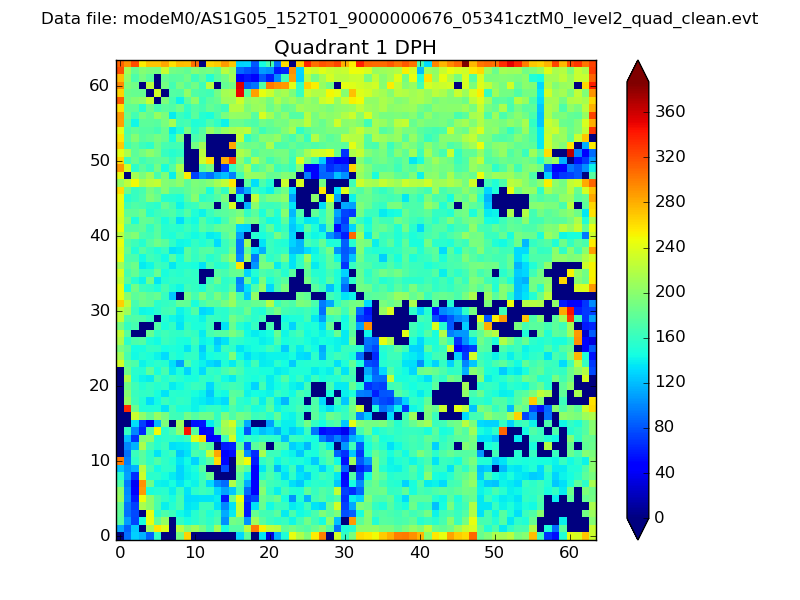 |
Quadrant B |
|---|---|---|---|
| Quadrant D | 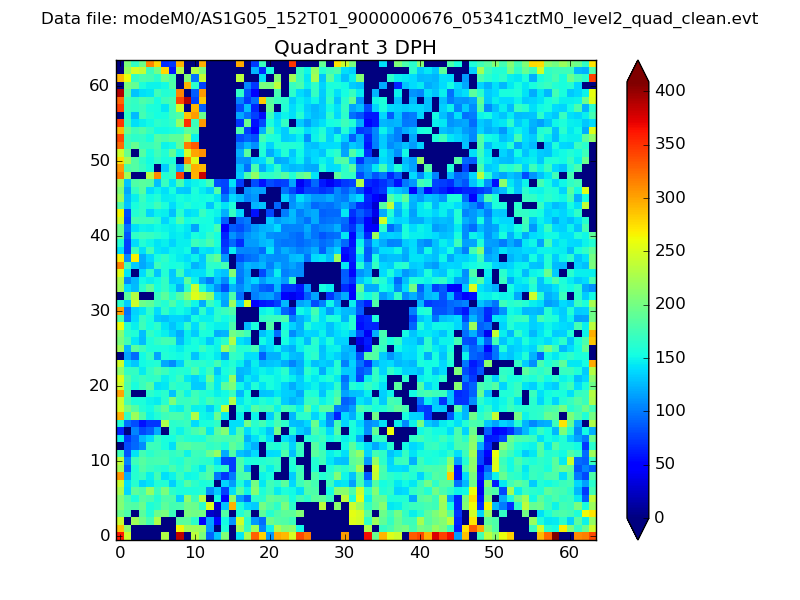 |
 |
Quadrant C |
| Plot type | Count rate plots | Images |
|---|---|---|
| Comparison with Poisson distribution Blue bars denote a histogram of data divided into 1 sec bins. Red curve is a Poisson curve with rate = median count rate of data. |
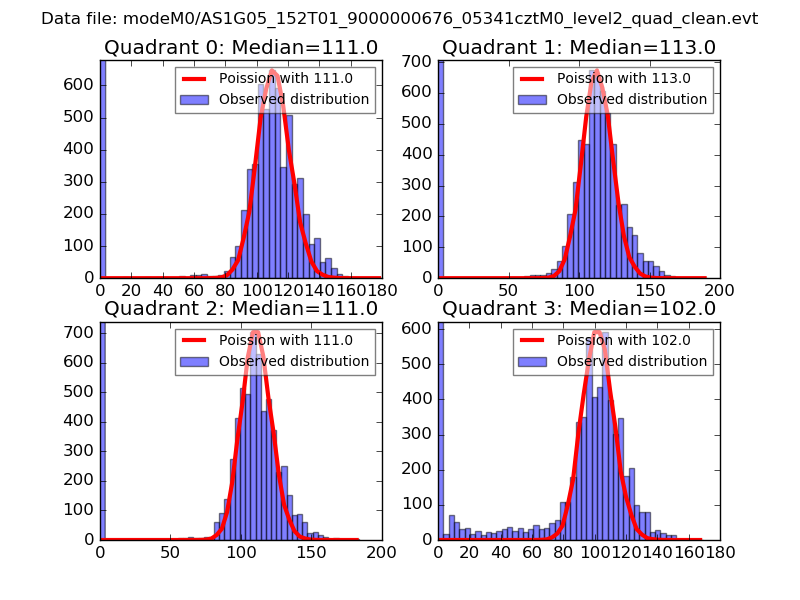 |
 |
| Quadrant-wise count rates Data is divided into 100 sec bins |
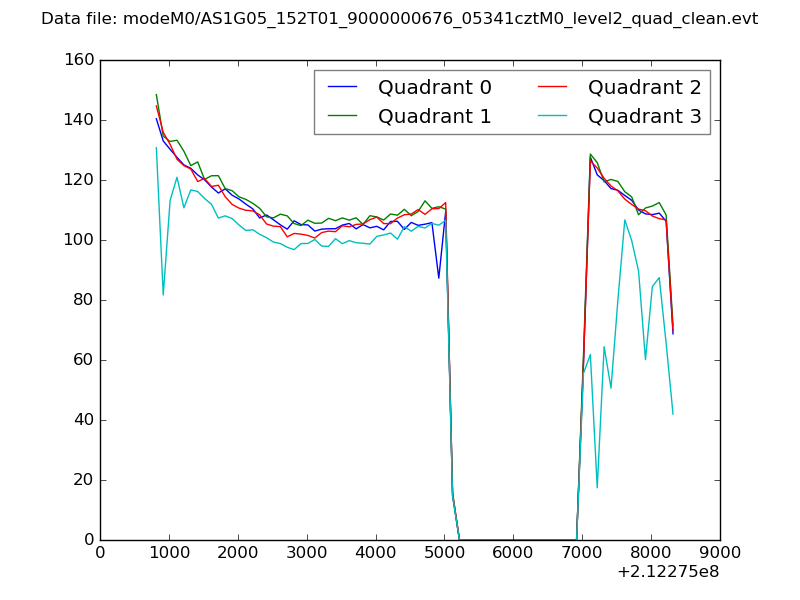 |
|
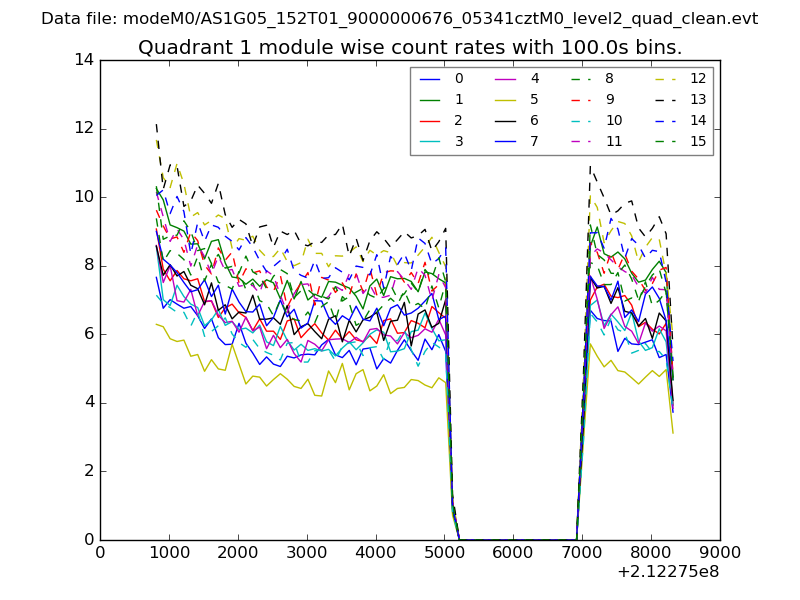
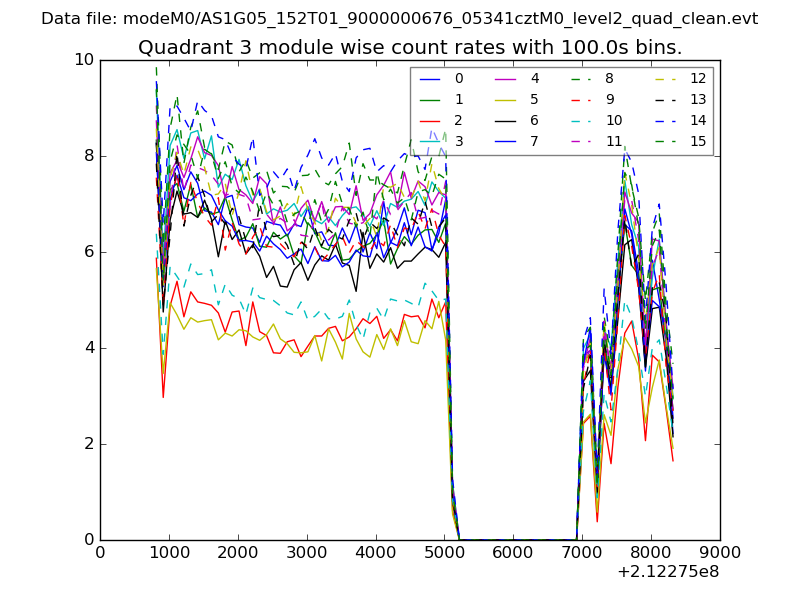
| Module-wise count rates for Quadrant A Data is divided into 100 sec bins |
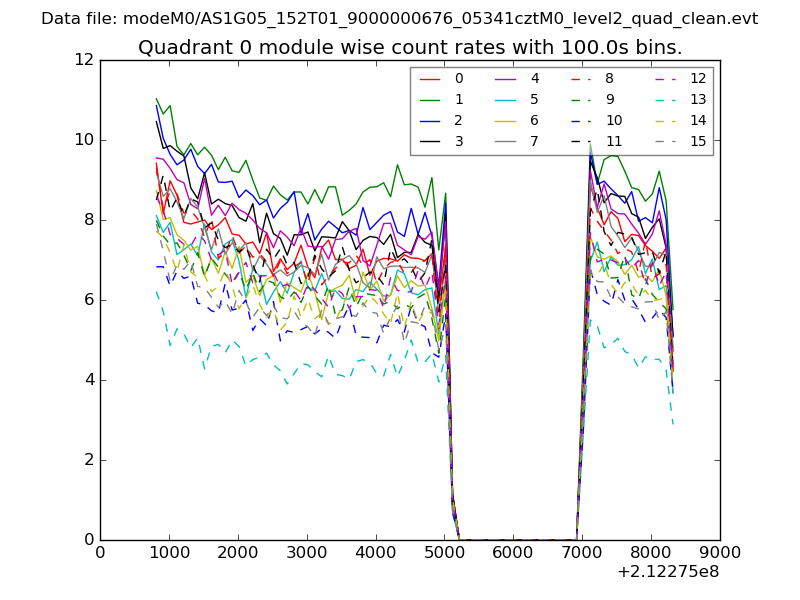 |
 |
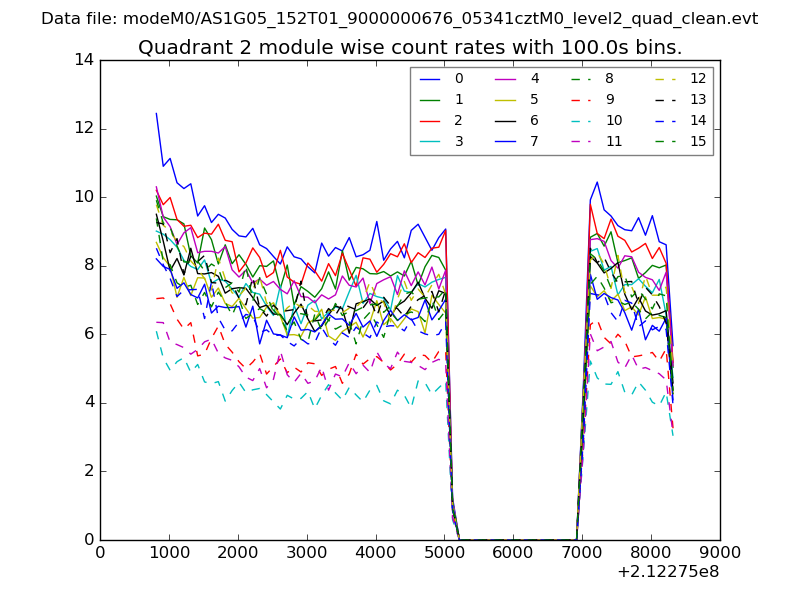
| Module-wise count rates for Quadrant B Data is divided into 100 sec bins |
 |
 |
| Module-wise count rates for Quadrant C Data is divided into 100 sec bins |
 |
 |
| Module-wise count rates for Quadrant D Data is divided into 100 sec bins |
 |
 |
| Parameter | Plot |
|---|---|
| CZT HV Monitor | 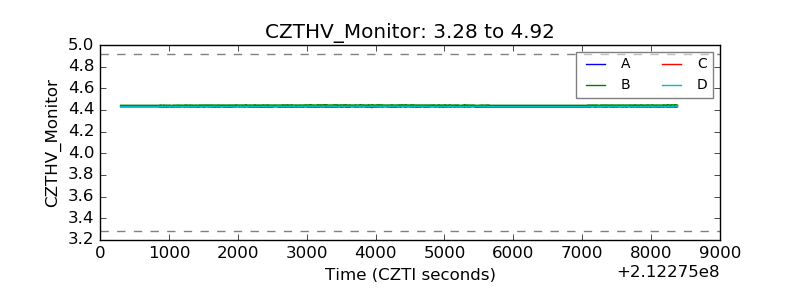 |
| D_VDD | 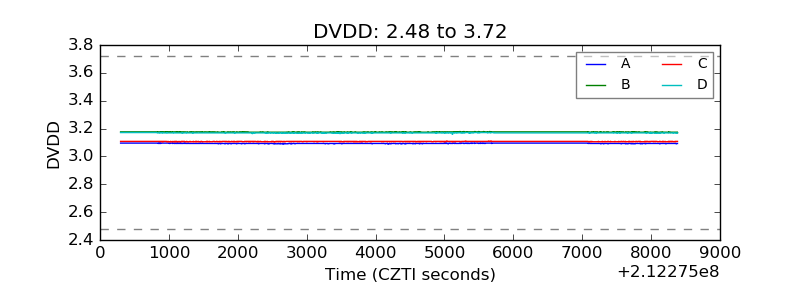 |
| Temperature 1 | 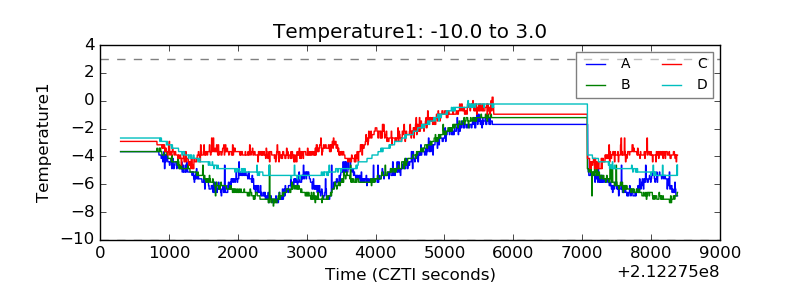 |
| Veto HV Monitor | 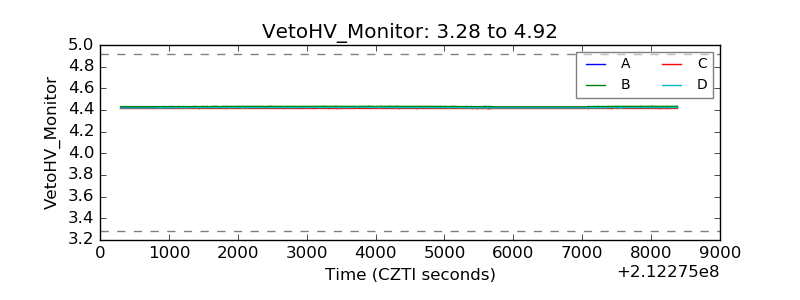 |
| Veto LLD | 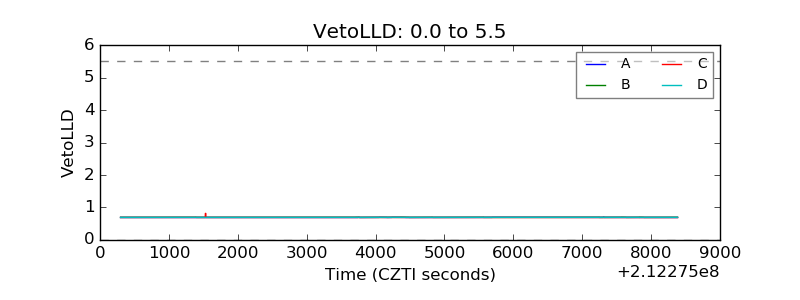 |
| Alpha Counter |  |
| _CPM_Rate |  |
| CZT Counter | 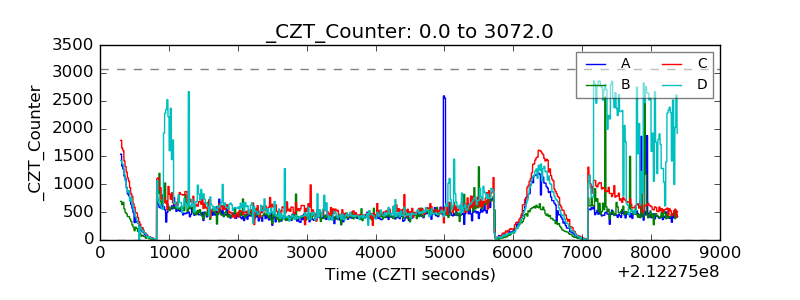 |
| +2.5 Volts monitor |  |
| +5 Volts monitor |  |
| _ROLL_ROT | 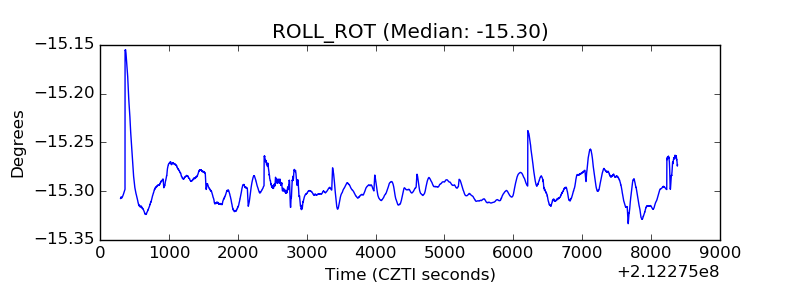 |
| _Roll_DEC | 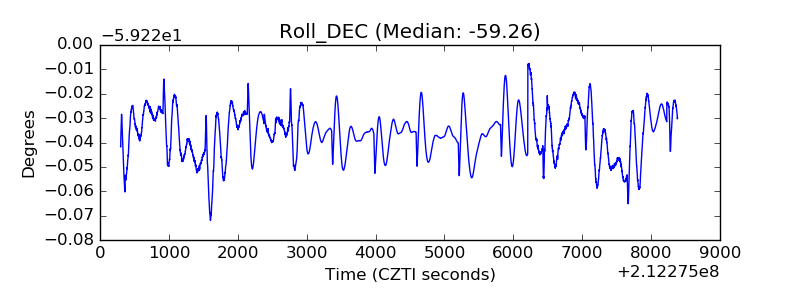 |
| _Roll_RA | 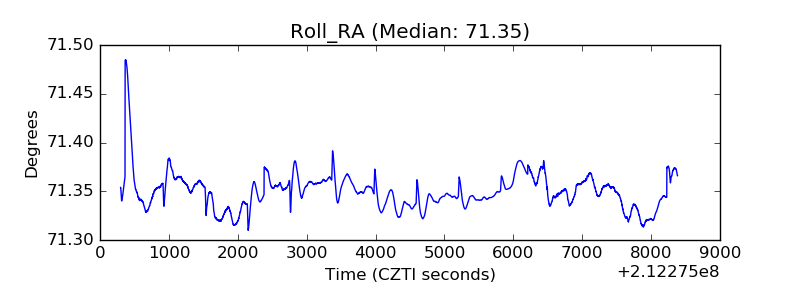 |
| Veto Counter | 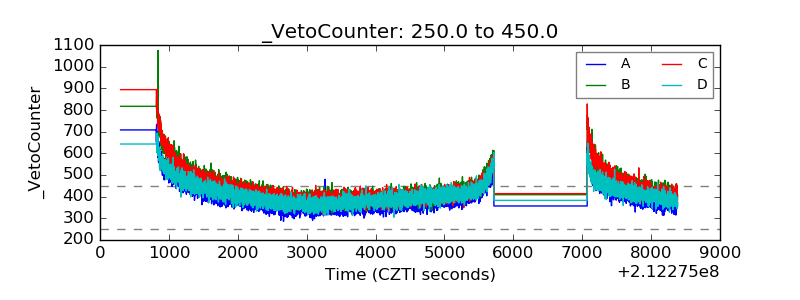 |