| Param | Original file | Final file |
|---|---|---|
| Filename | modeM0/AS1G05_152T01_9000000676_05342cztM0_level2.evt | modeM0/AS1G05_152T01_9000000676_05342cztM0_level2_quad_clean.evt |
| Size (bytes) | 682,810,560 | 90,092,160 |
| Size | 651.2 MB | 85.9 MB |
| Events in quadrant A | 3,024,172 | 591,101 |
| Events in quadrant B | 3,314,884 | 604,799 |
| Events in quadrant C | 5,249,209 | 587,093 |
| Events in quadrant D | 8,641,030 | 480,842 |
| Mode M9 | |||
|---|---|---|---|
| Quadrant | BADHDUFLAG | Total packets | Discarded packets |
| A | 0 | 24 | 0 |
| B | 0 | 24 | 0 |
| C | 0 | 24 | 0 |
| D | 0 | 24 | 0 |
| Mode M0 | |||
|---|---|---|---|
| Quadrant | BADHDUFLAG | Total packets | Discarded packets |
| A | 0 | 13854 | 3 |
| B | 0 | 14425 | 2 |
| C | 0 | 20433 | 2 |
| D | 0 | 30390 | 2 |
| Mode SS | |||
|---|---|---|---|
| Quadrant | BADHDUFLAG | Total packets | Discarded packets |
| A | 0 | 136 | 0 |
| B | 0 | 136 | 0 |
| C | 0 | 136 | 0 |
| D | 0 | 136 | 0 |
| Quadrant | Total seconds | Saturated seconds | Saturation percentage |
|---|---|---|---|
| A | 6648 | 21 | 0.315884% |
| B | 6648 | 69 | 1.037906% |
| C | 6648 | 96 | 1.444043% |
| D | 6648 | 1881 | 28.294224% |
Noise dominated data is calculated using 1-second bins in cleaned event files. If a bin has >2000 counts, and if more than 50% of those come from <1% of pixels, then it is considered to be noise-dominated and hence unusable.
| Quadrant | # 1 sec bins | Bins with >0 counts | Bins with >2000 counts | High rate bins dominated by noise | Noise dominated (total time) | Noise dominated (detector-on time) | Marked lightcurve |
|---|---|---|---|---|---|---|---|
| A | 7873 | 6650 | 9 | 9 | 0.11% | 0.14% | 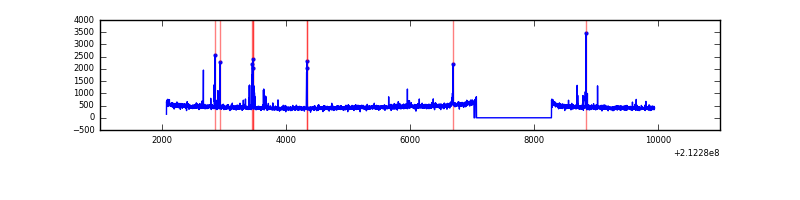 |
| B | 7873 | 6650 | 27 | 27 | 0.34% | 0.41% | 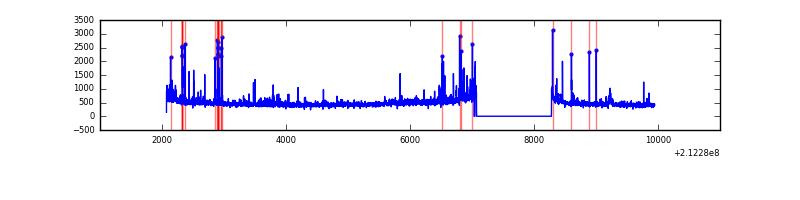 |
| C | 7873 | 6650 | 2 | 2 | 0.03% | 0.03% | 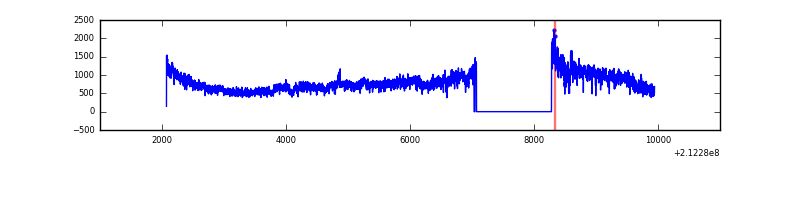 |
| D | 7873 | 6650 | 1808 | 1808 | 22.96% | 27.19% | 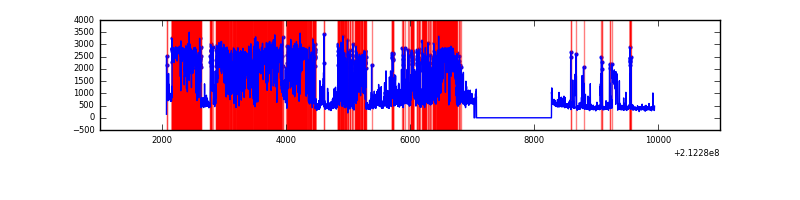 |
Top three noisy pixels from each quadrant. If the there are fewer than three noisy pixels in the level2.evt file, extra rows are filled as -1
| Pixel properties | Quadrant properties | ||||||
|---|---|---|---|---|---|---|---|
| Quadrant | DetID | PixID | Counts | Sigma | Mean | Median | Sigma |
| A | 0 | 50 | 131029 | 858.15 | 748 | 731 | 151.8 |
| A | 13 | 251 | 10042 | 61.32 | 748 | 731 | 151.8 |
| A | 12 | 194 | 7344 | 43.55 | 748 | 731 | 151.8 |
| B | 4 | 80 | 123612 | 860.15 | 767 | 748 | 142.8 |
| B | 10 | 16 | 95799 | 665.43 | 767 | 748 | 142.8 |
| B | 4 | 48 | 60459 | 418.03 | 767 | 748 | 142.8 |
| C | 1 | 16 | 2343433 | 13765.58 | 742 | 746 | 170.2 |
| C | 14 | 67 | 7702 | 40.87 | 742 | 746 | 170.2 |
| C | 13 | 61 | 6057 | 31.21 | 742 | 746 | 170.2 |
| D | 2 | 63 | 5506452 | 34794.6 | 645 | 626 | 158.2 |
| D | 13 | 61 | 107363 | 674.53 | 645 | 626 | 158.2 |
| D | 2 | 33 | 100677 | 632.28 | 645 | 626 | 158.2 |
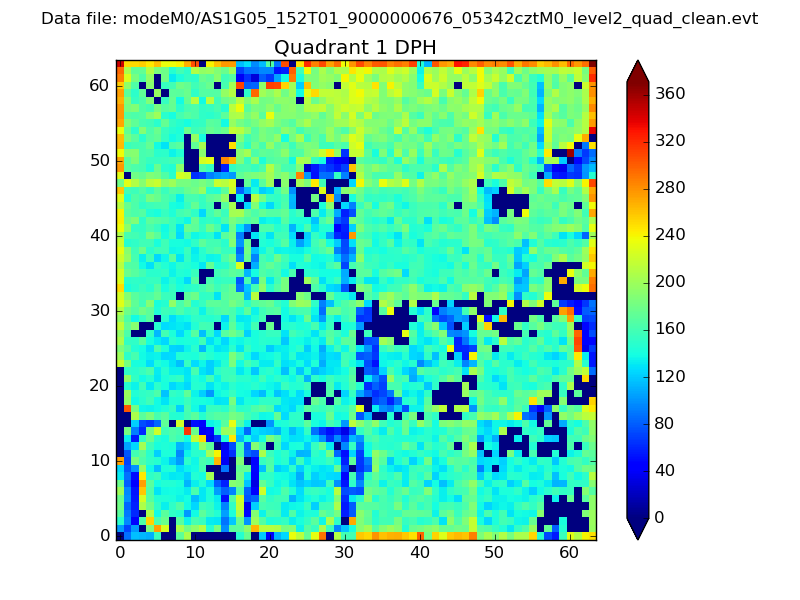
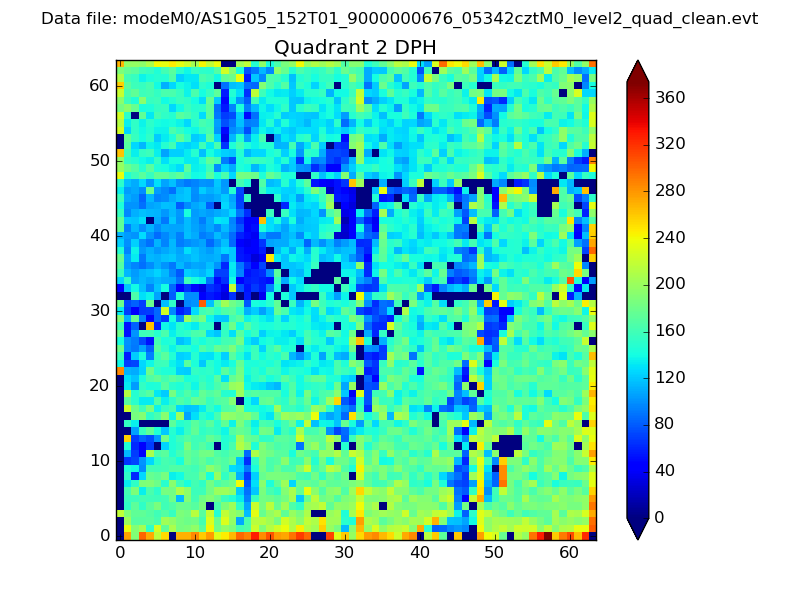
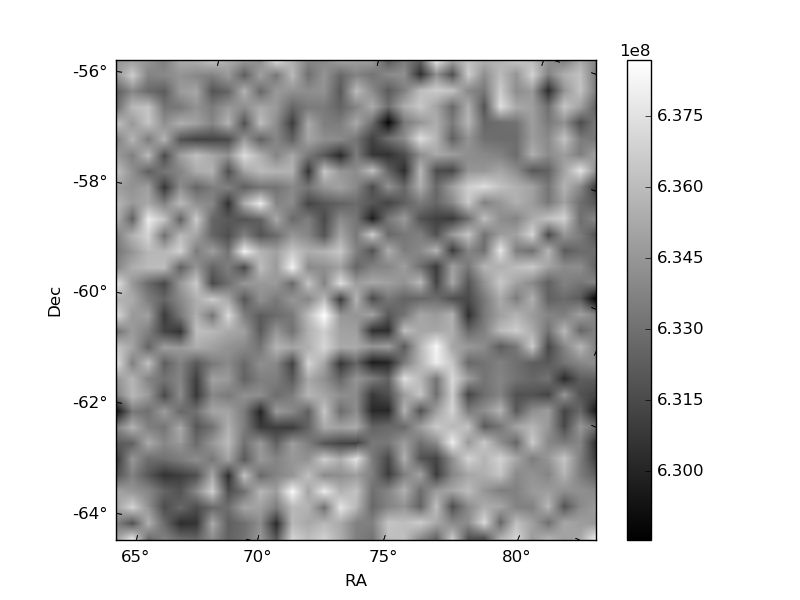
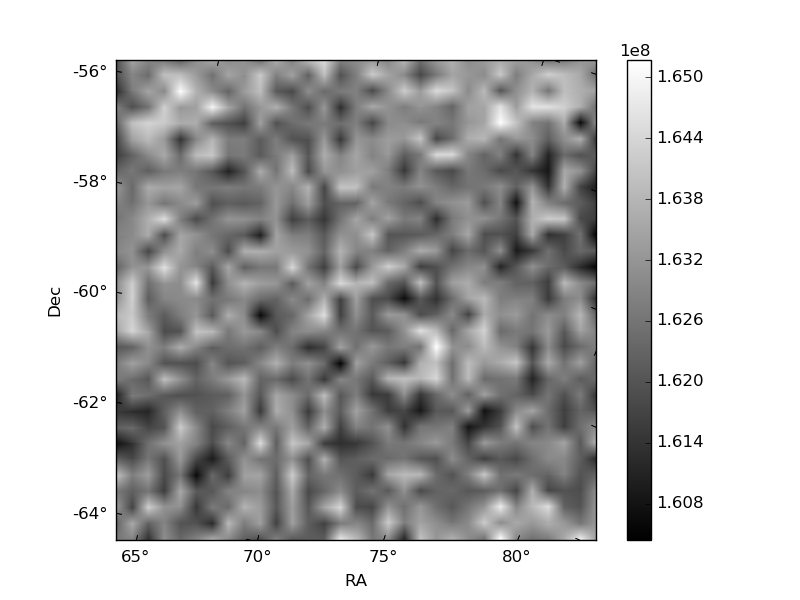
Histogram calculated using DETX and DETY for each event in the final _common_clean file
| Quadrant A |  |
 |
Quadrant B |
|---|---|---|---|
| Quadrant D | 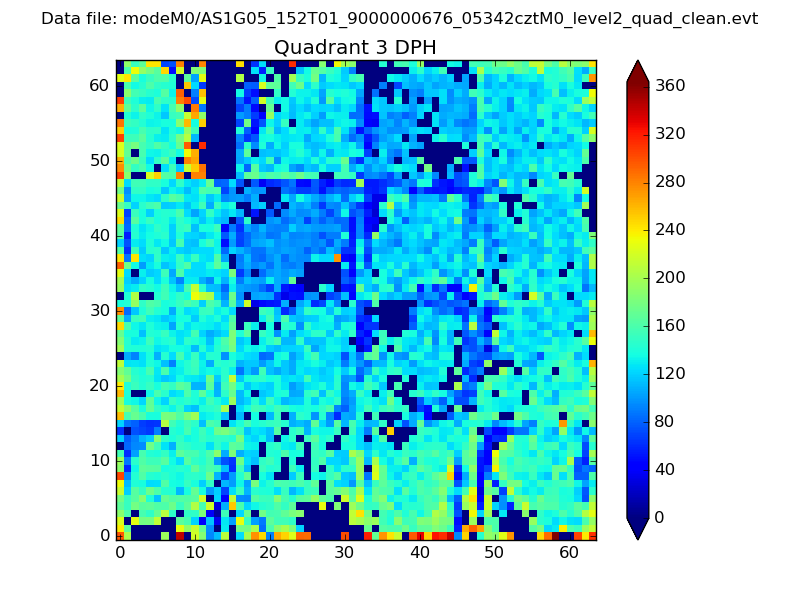 |
 |
Quadrant C |
| Plot type | Count rate plots | Images |
|---|---|---|
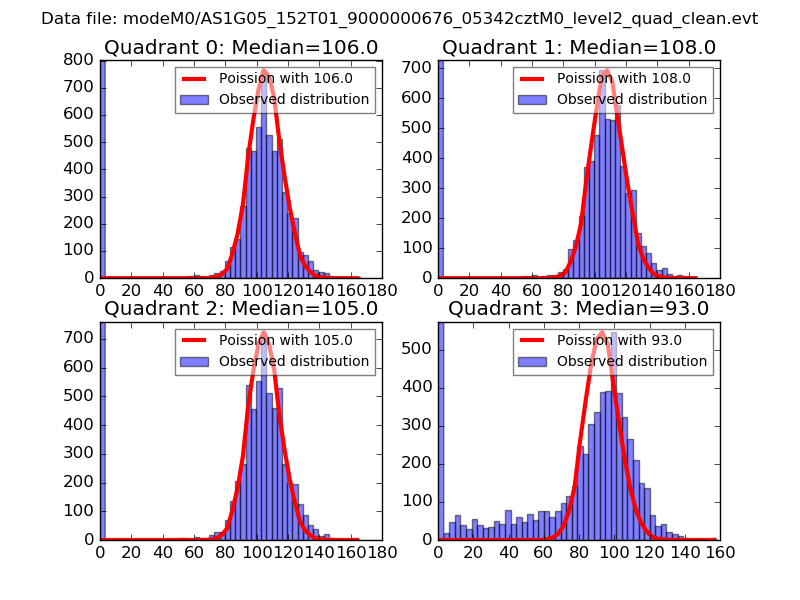
| Comparison with Poisson distribution Blue bars denote a histogram of data divided into 1 sec bins. Red curve is a Poisson curve with rate = median count rate of data. |
 |
 |
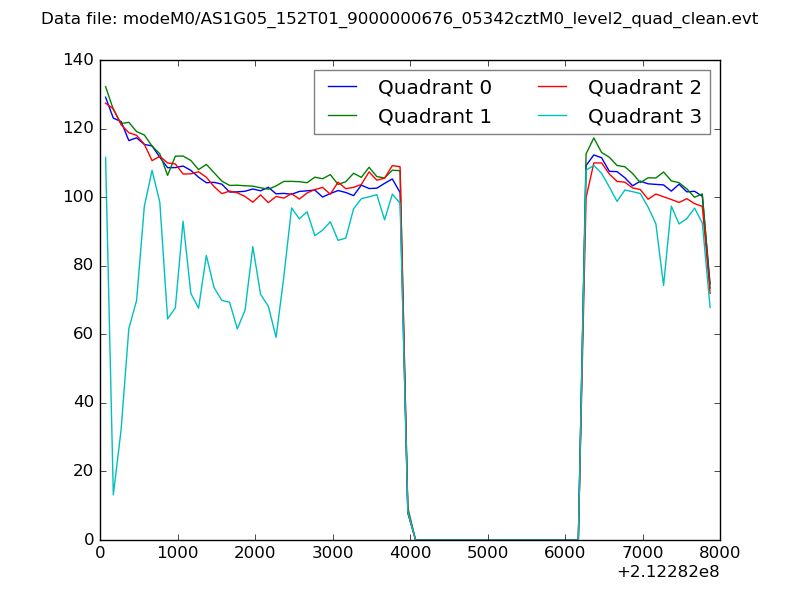
| Quadrant-wise count rates Data is divided into 100 sec bins |
 |
|
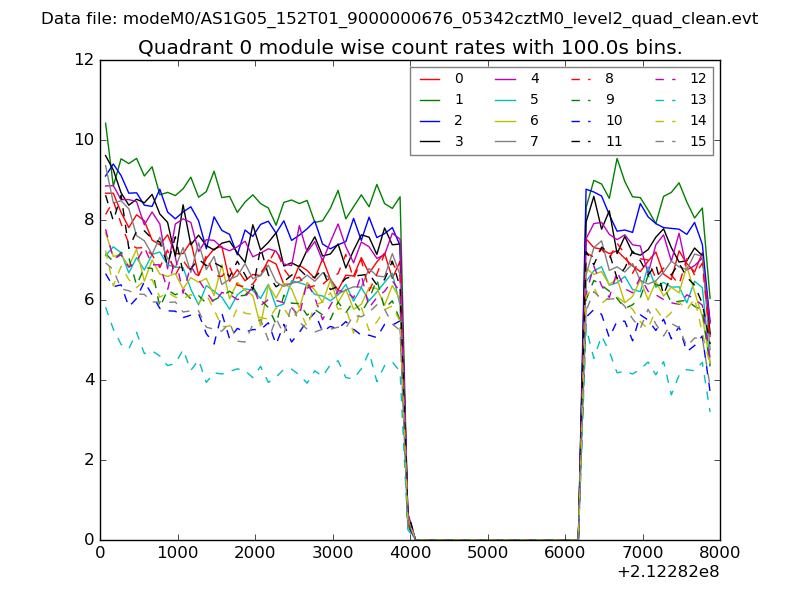
| Module-wise count rates for Quadrant A Data is divided into 100 sec bins |
 |
 |
| Module-wise count rates for Quadrant B Data is divided into 100 sec bins |
 |
 |
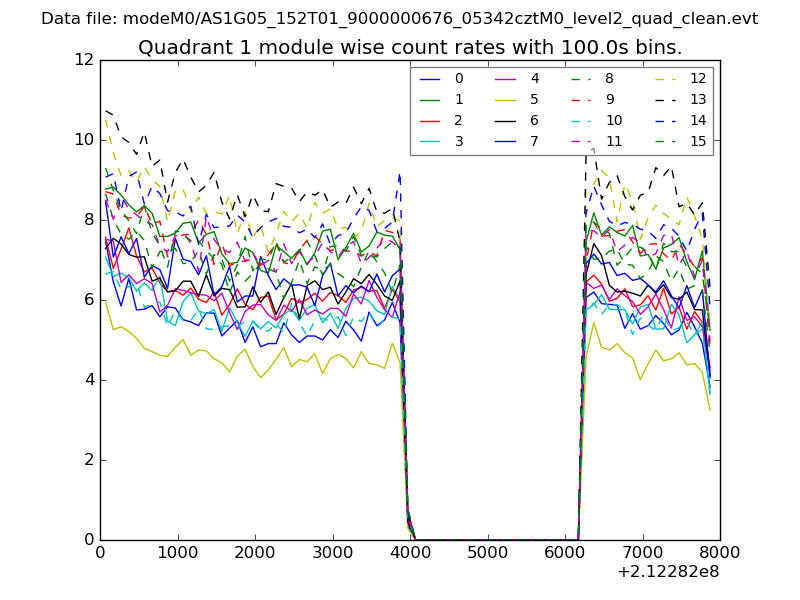
| Module-wise count rates for Quadrant C Data is divided into 100 sec bins |
 |
 |
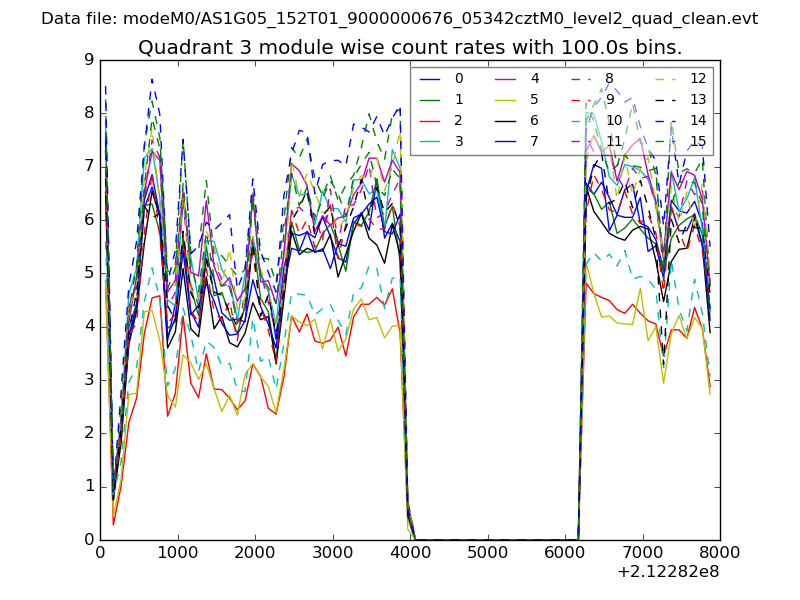
| Module-wise count rates for Quadrant D Data is divided into 100 sec bins |
 |
 |
| Parameter | Plot |
|---|---|
| CZT HV Monitor | 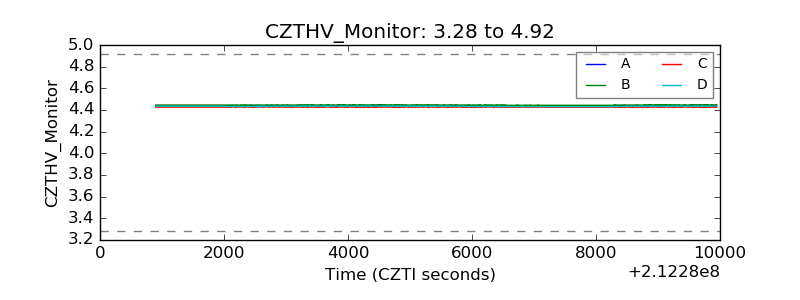 |
| D_VDD | 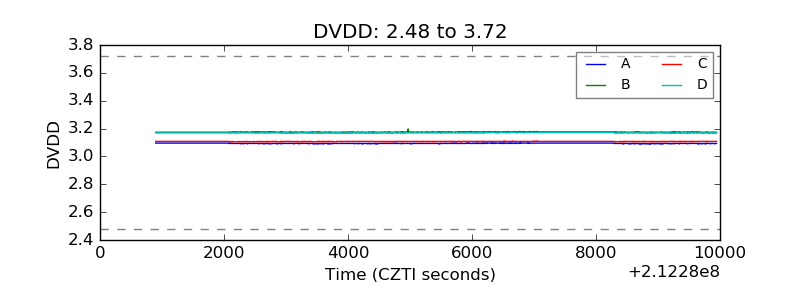 |
| Temperature 1 | 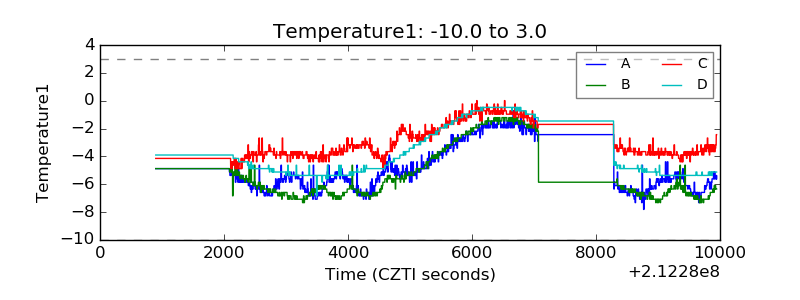 |
| Veto HV Monitor | 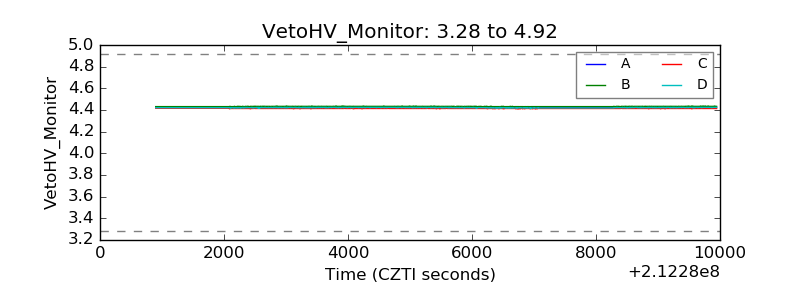 |
| Veto LLD | 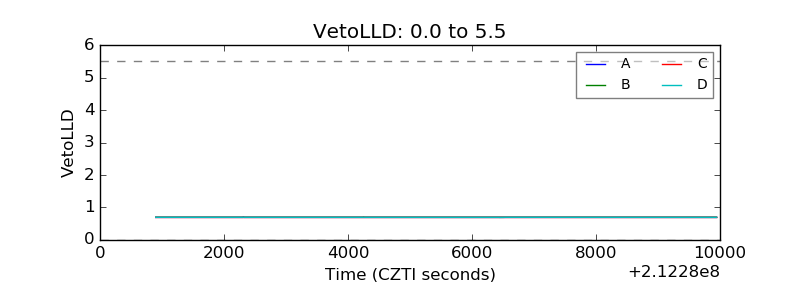 |
| Alpha Counter | 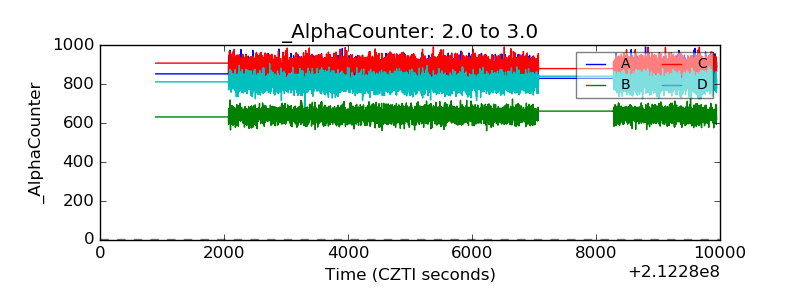 |
| _CPM_Rate | 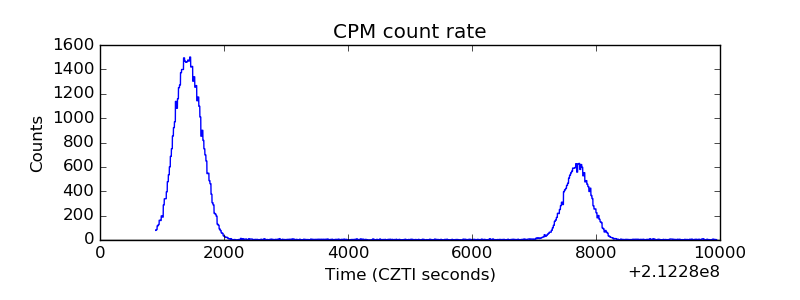 |
| CZT Counter | 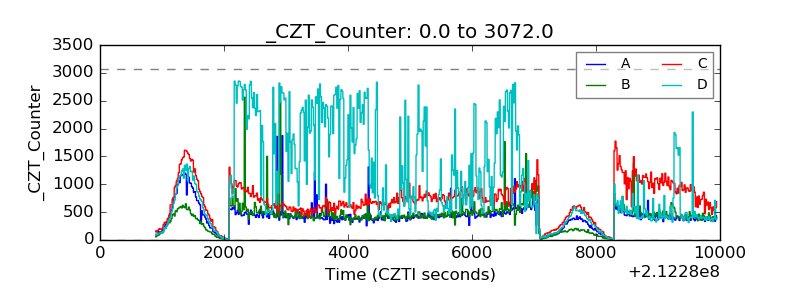 |
| +2.5 Volts monitor |  |
| +5 Volts monitor |  |
| _ROLL_ROT | 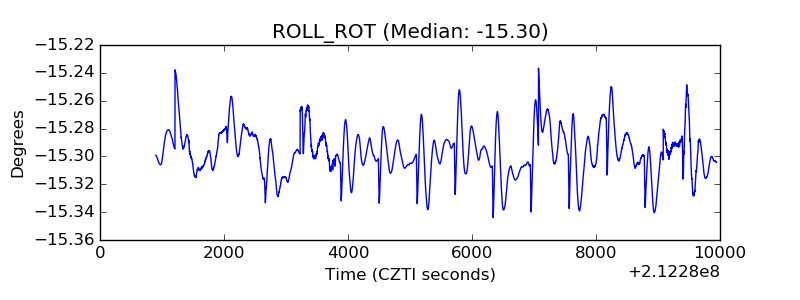 |
| _Roll_DEC |  |
| _Roll_RA | 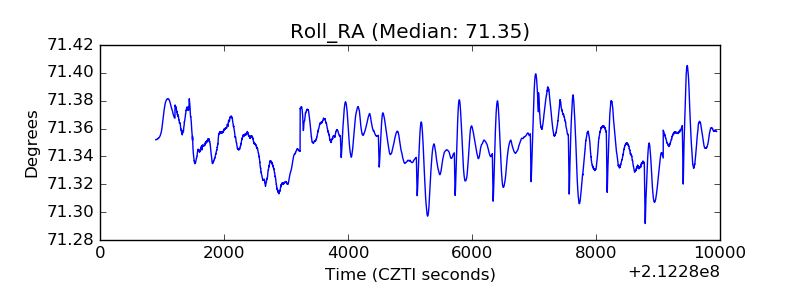 |
| Veto Counter | 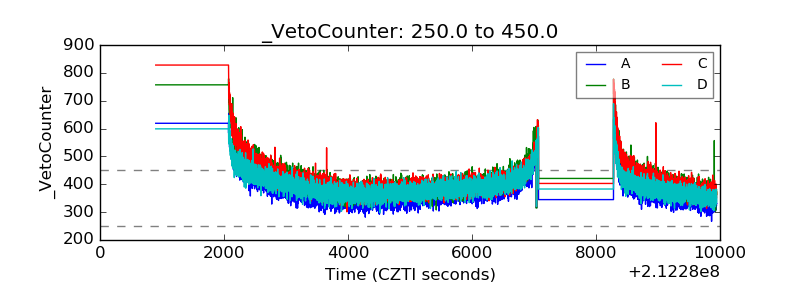 |