| Param | Original file | Final file |
|---|---|---|
| Filename | modeM0/AS1G05_152T01_9000000676_05343cztM0_level2.evt | modeM0/AS1G05_152T01_9000000676_05343cztM0_level2_quad_clean.evt |
| Size (bytes) | 572,109,120 | 82,278,720 |
| Size | 545.6 MB | 78.5 MB |
| Events in quadrant A | 2,779,177 | 524,912 |
| Events in quadrant B | 3,132,251 | 535,849 |
| Events in quadrant C | 4,842,257 | 523,569 |
| Events in quadrant D | 6,140,861 | 462,177 |
| Mode M9 | |||
|---|---|---|---|
| Quadrant | BADHDUFLAG | Total packets | Discarded packets |
| A | 0 | 9 | 0 |
| B | 0 | 9 | 0 |
| C | 0 | 9 | 0 |
| D | 0 | 9 | 0 |
| Mode M0 | |||
|---|---|---|---|
| Quadrant | BADHDUFLAG | Total packets | Discarded packets |
| A | 0 | 13064 | 6 |
| B | 0 | 13825 | 8 |
| C | 0 | 18805 | 6 |
| D | 0 | 22898 | 13 |
| Mode SS | |||
|---|---|---|---|
| Quadrant | BADHDUFLAG | Total packets | Discarded packets |
| A | 0 | 130 | 0 |
| B | 0 | 130 | 0 |
| C | 0 | 130 | 0 |
| D | 0 | 130 | 0 |
| Quadrant | Total seconds | Saturated seconds | Saturation percentage |
|---|---|---|---|
| A | 6372 | 31 | 0.486503% |
| B | 6371 | 68 | 1.067336% |
| C | 6372 | 41 | 0.643440% |
| D | 6369 | 1060 | 16.643115% |
Noise dominated data is calculated using 1-second bins in cleaned event files. If a bin has >2000 counts, and if more than 50% of those come from <1% of pixels, then it is considered to be noise-dominated and hence unusable.
| Quadrant | # 1 sec bins | Bins with >0 counts | Bins with >2000 counts | High rate bins dominated by noise | Noise dominated (total time) | Noise dominated (detector-on time) | Marked lightcurve |
|---|---|---|---|---|---|---|---|
| A | 7304 | 6375 | 18 | 18 | 0.25% | 0.28% | 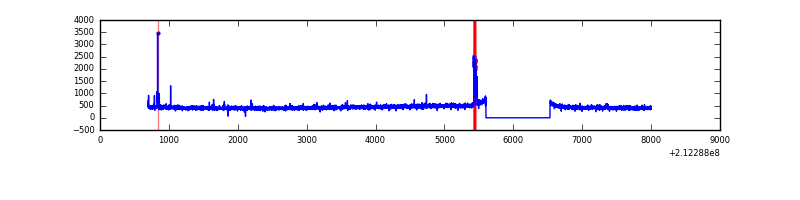 |
| B | 7304 | 6375 | 33 | 33 | 0.45% | 0.52% | 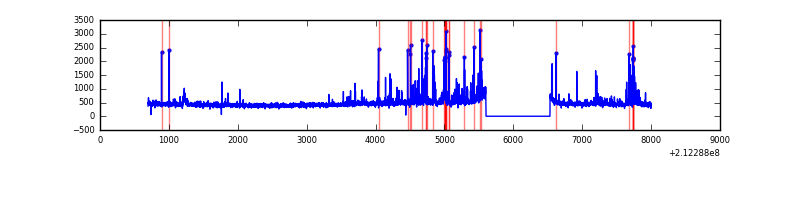 |
| C | 7304 | 6375 | 0 | 0 | 0.00% | 0.00% | 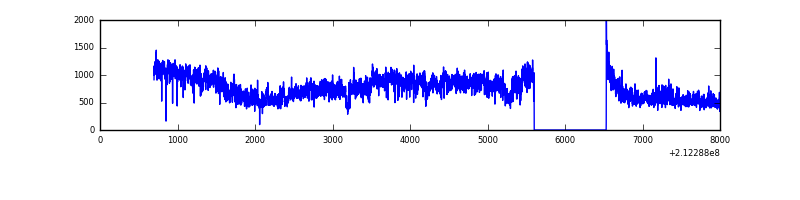 |
| D | 7304 | 6374 | 640 | 640 | 8.76% | 10.04% | 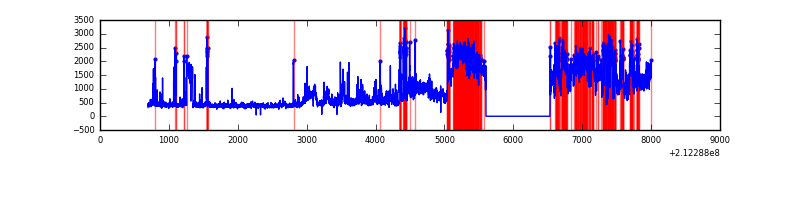 |
Top three noisy pixels from each quadrant. If the there are fewer than three noisy pixels in the level2.evt file, extra rows are filled as -1
| Pixel properties | Quadrant properties | ||||||
|---|---|---|---|---|---|---|---|
| Quadrant | DetID | PixID | Counts | Sigma | Mean | Median | Sigma |
| A | 0 | 50 | 65478 | 450.19 | 702 | 685 | 143.9 |
| A | 12 | 194 | 6942 | 43.47 | 702 | 685 | 143.9 |
| A | 0 | 226 | 6793 | 42.44 | 702 | 685 | 143.9 |
| B | 10 | 16 | 188285 | 1383.79 | 716 | 700 | 135.6 |
| B | 4 | 80 | 95050 | 696.01 | 716 | 700 | 135.6 |
| B | 15 | 54 | 20645 | 147.13 | 716 | 700 | 135.6 |
| C | 1 | 16 | 2093711 | 13075.33 | 699 | 703 | 160.1 |
| C | 14 | 67 | 10430 | 60.77 | 699 | 703 | 160.1 |
| C | 12 | 4 | 6833 | 38.3 | 699 | 703 | 160.1 |
| D | 2 | 63 | 2662151 | 16790.99 | 649 | 628 | 158.5 |
| D | 2 | 16 | 504937 | 3181.58 | 649 | 628 | 158.5 |
| D | 13 | 61 | 127896 | 802.9 | 649 | 628 | 158.5 |
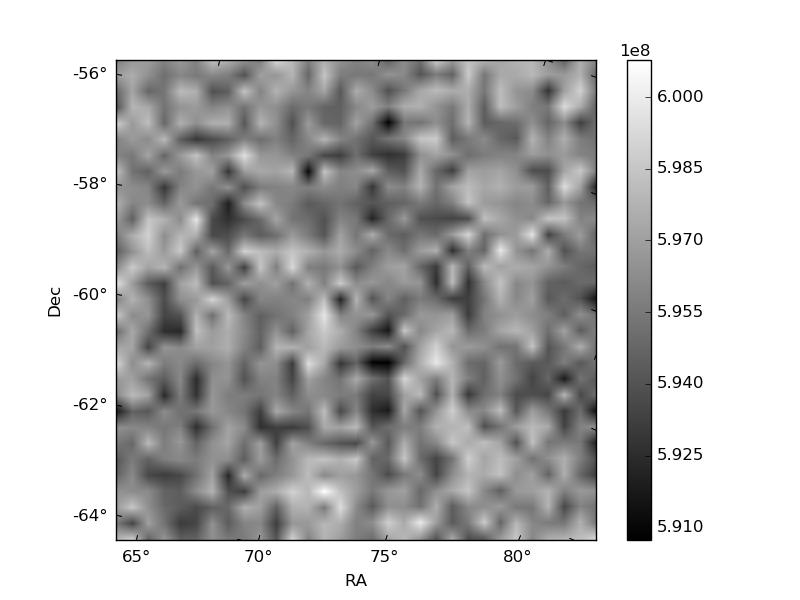
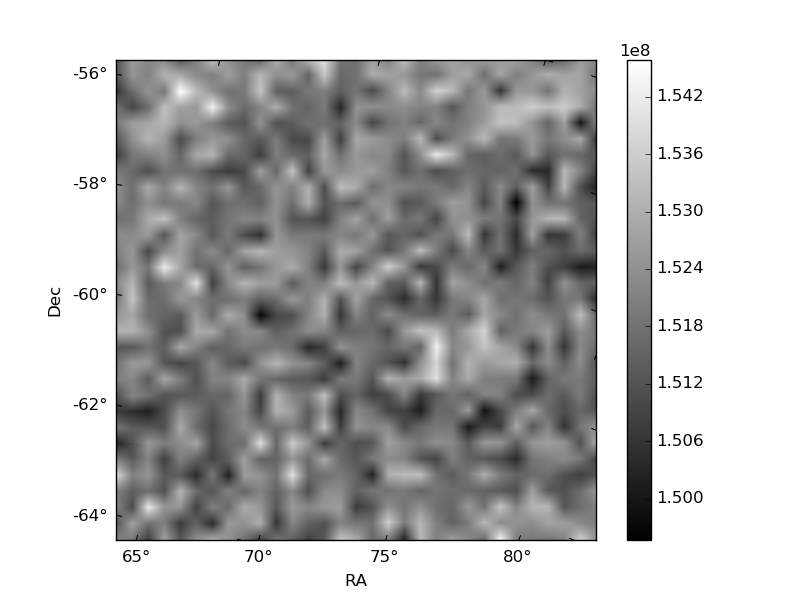
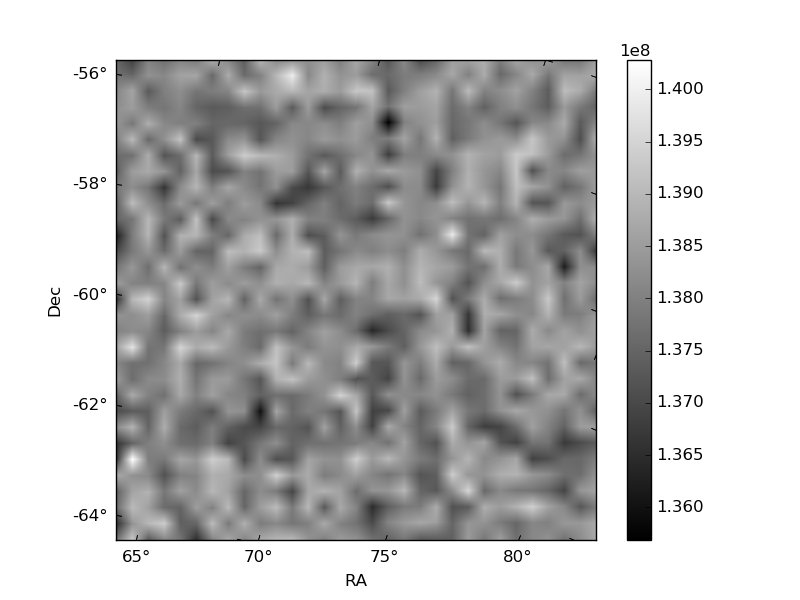
Histogram calculated using DETX and DETY for each event in the final _common_clean file
| Quadrant A | 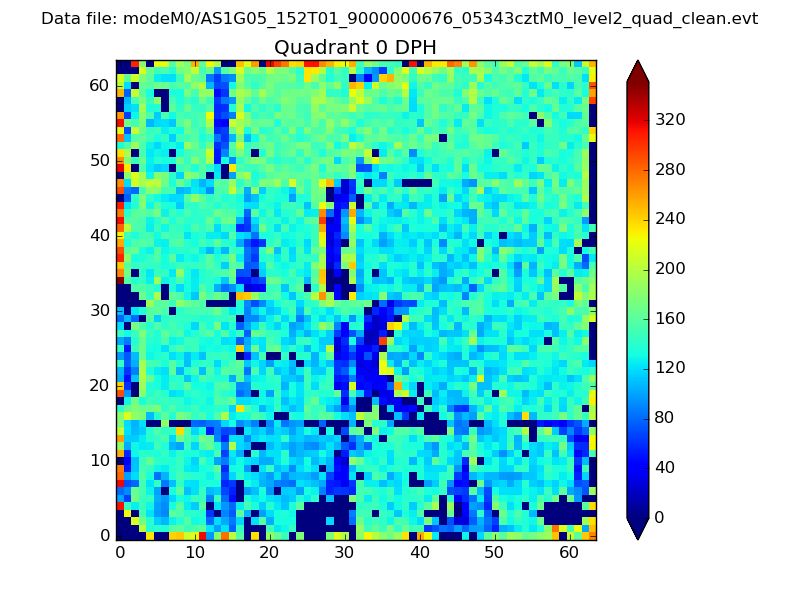 |
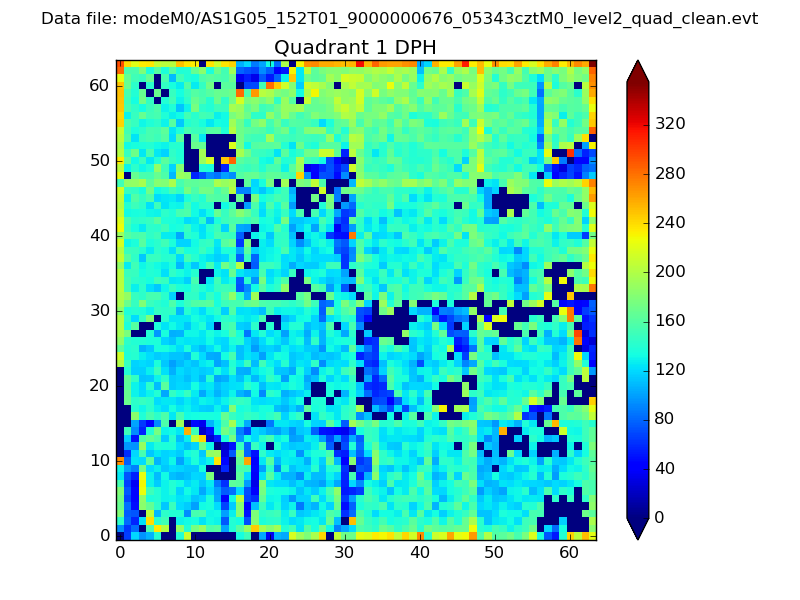 |
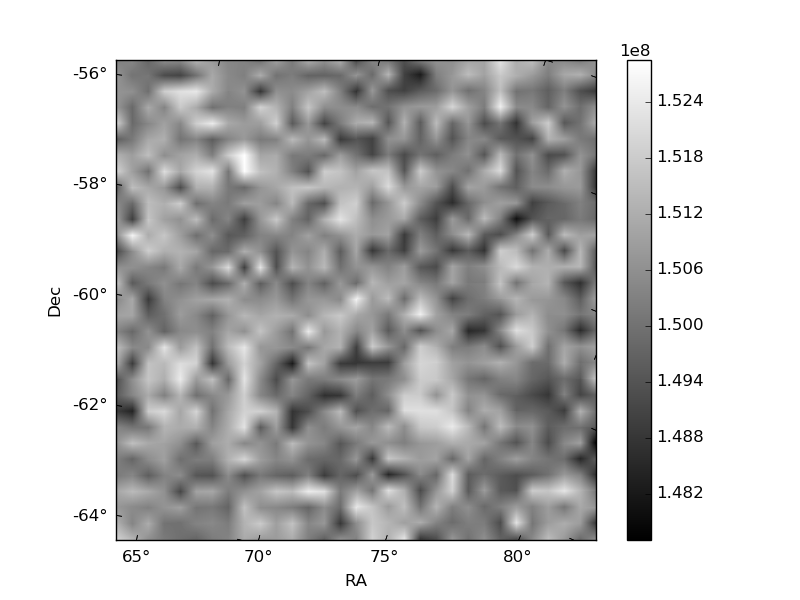
Quadrant B |
|---|---|---|---|
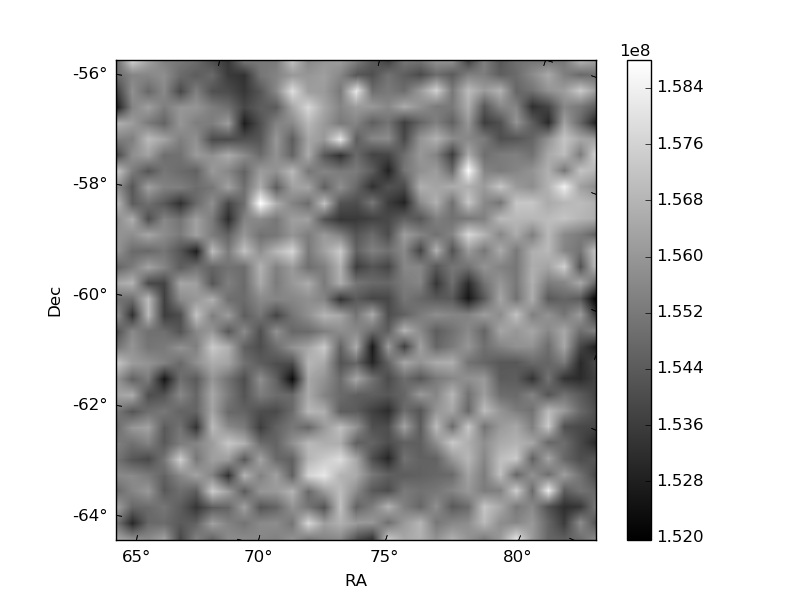
| Quadrant D | 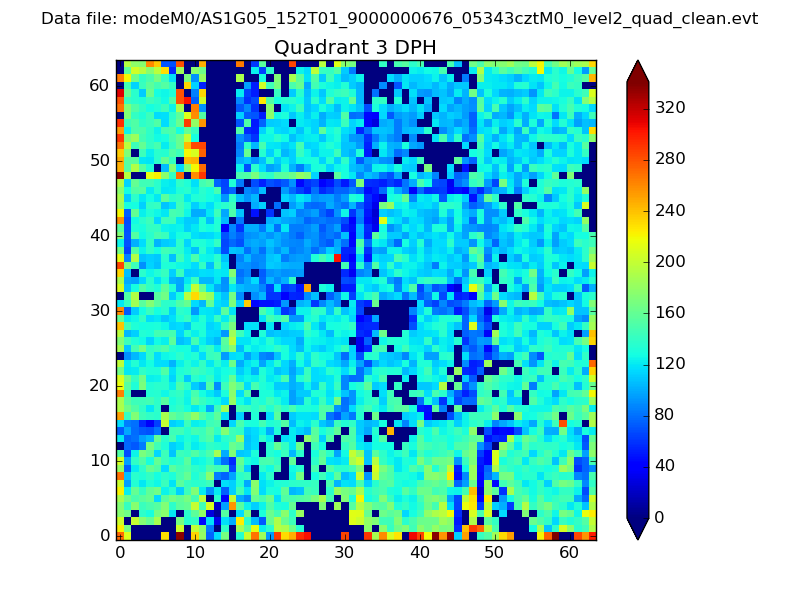 |
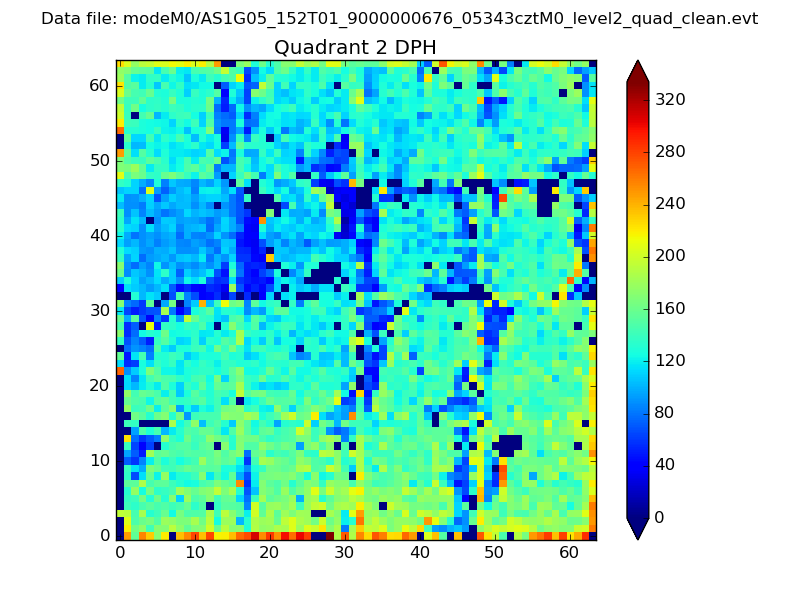 |
Quadrant C |
| Plot type | Count rate plots | Images |
|---|---|---|
| Comparison with Poisson distribution Blue bars denote a histogram of data divided into 1 sec bins. Red curve is a Poisson curve with rate = median count rate of data. |
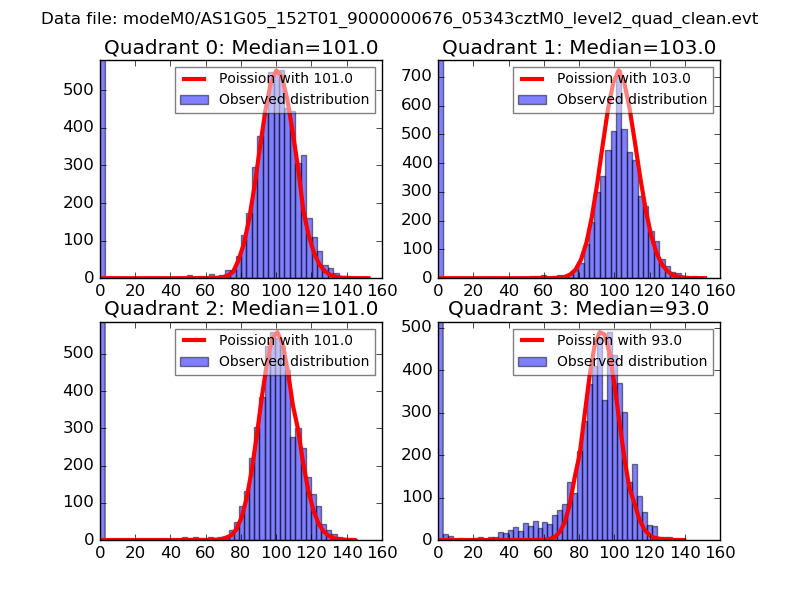 |
 |
| Quadrant-wise count rates Data is divided into 100 sec bins |
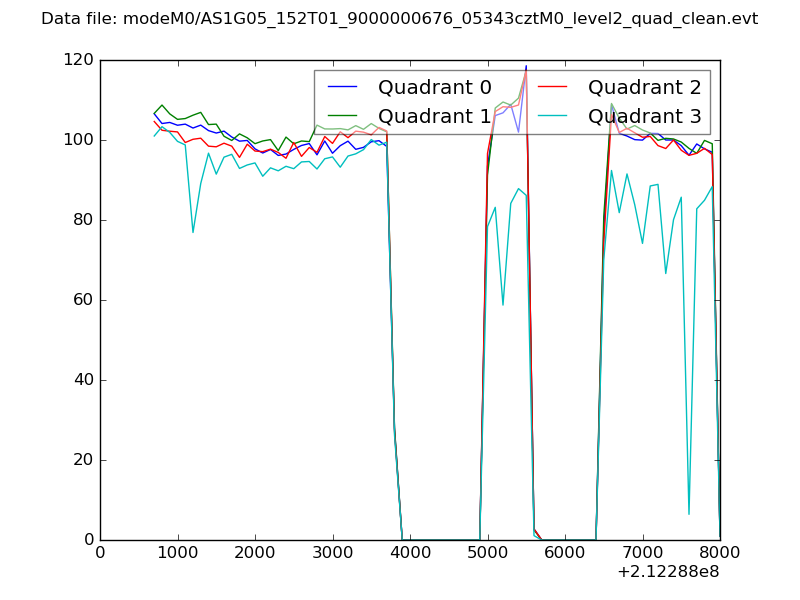 |
|
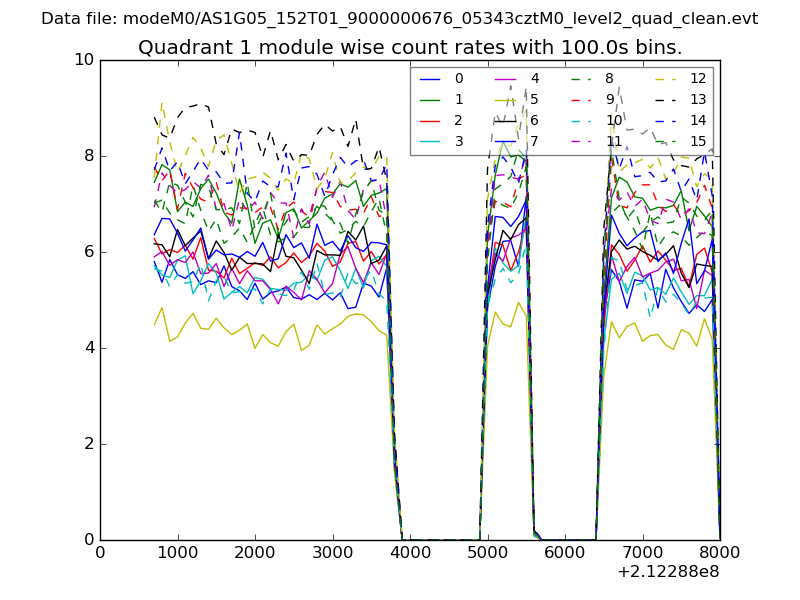
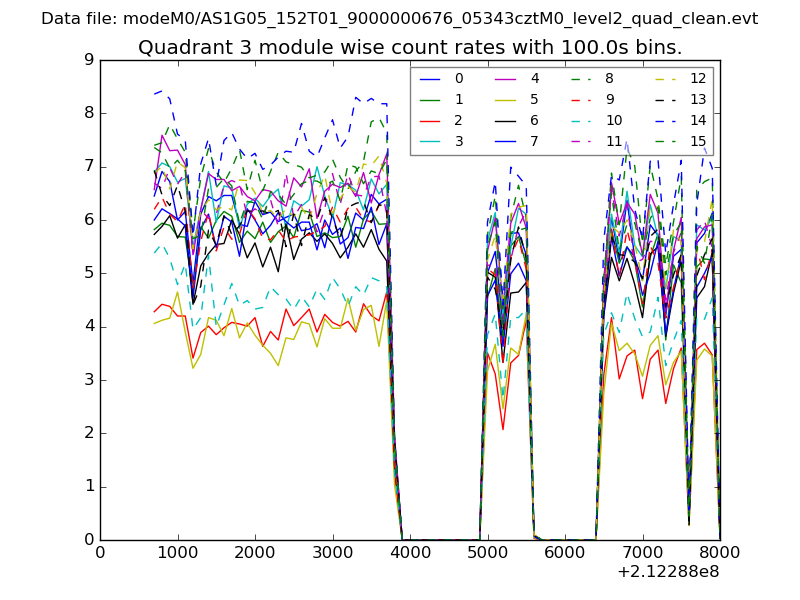
| Module-wise count rates for Quadrant A Data is divided into 100 sec bins |
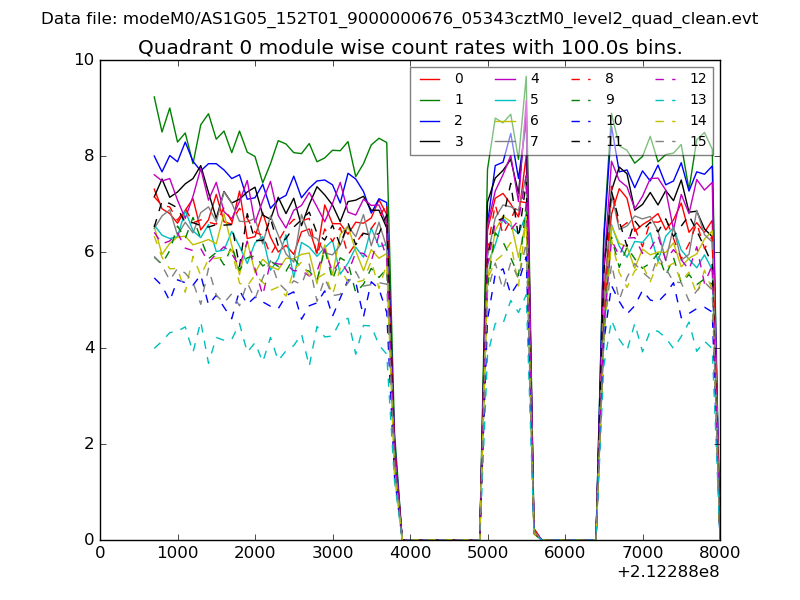 |
 |
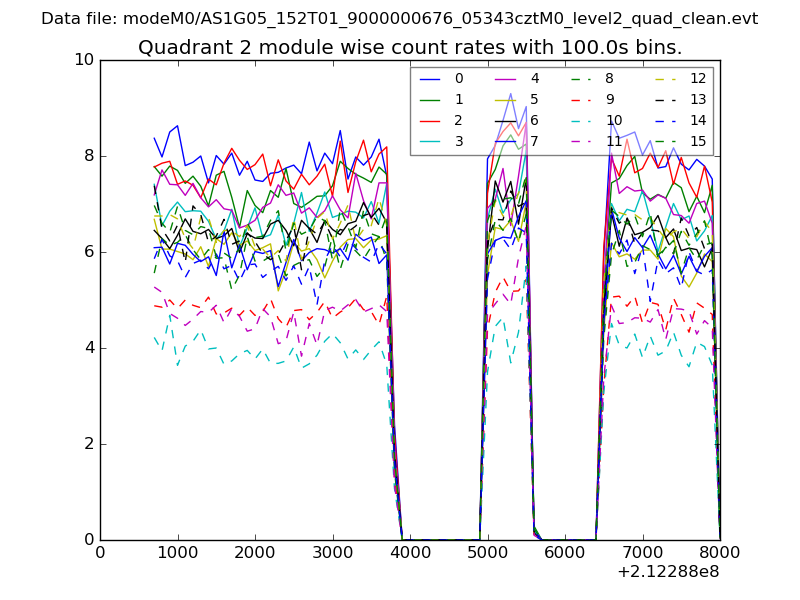
| Module-wise count rates for Quadrant B Data is divided into 100 sec bins |
 |
 |
| Module-wise count rates for Quadrant C Data is divided into 100 sec bins |
 |
 |
| Module-wise count rates for Quadrant D Data is divided into 100 sec bins |
 |
 |
| Parameter | Plot |
|---|---|
| CZT HV Monitor | 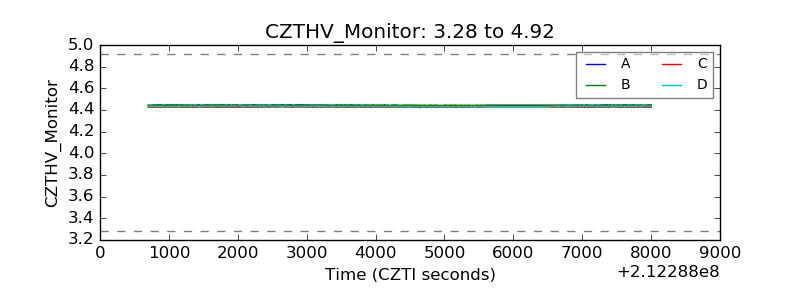 |
| D_VDD | 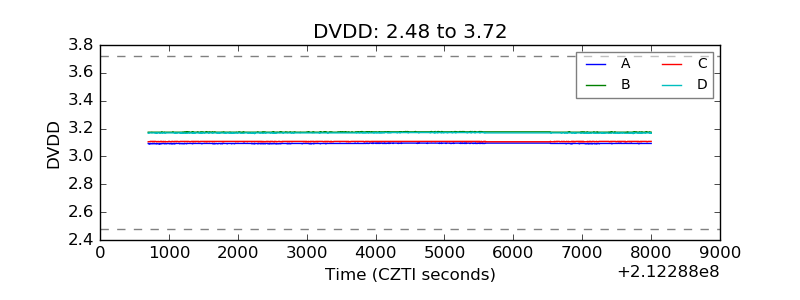 |
| Temperature 1 | 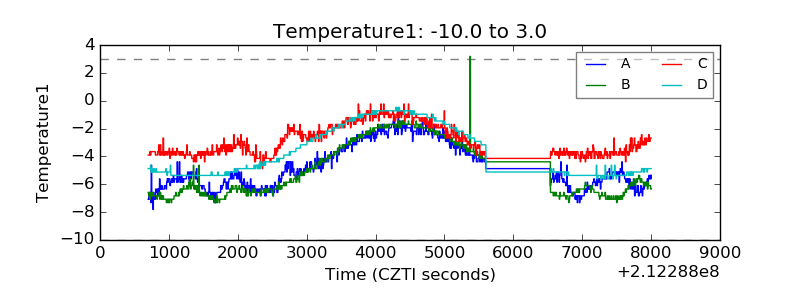 |
| Veto HV Monitor | 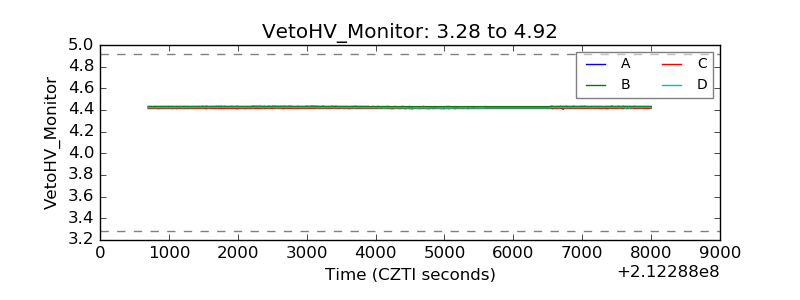 |
| Veto LLD | 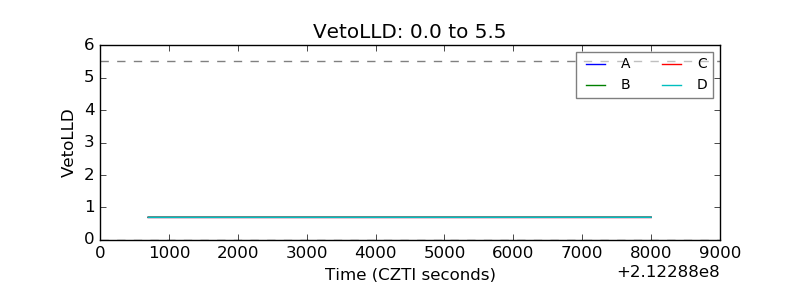 |
| Alpha Counter | 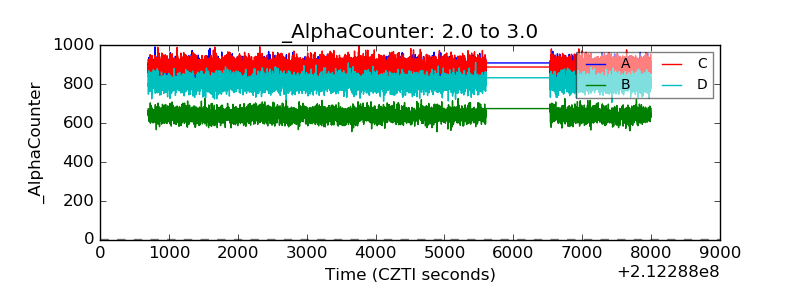 |
| _CPM_Rate | 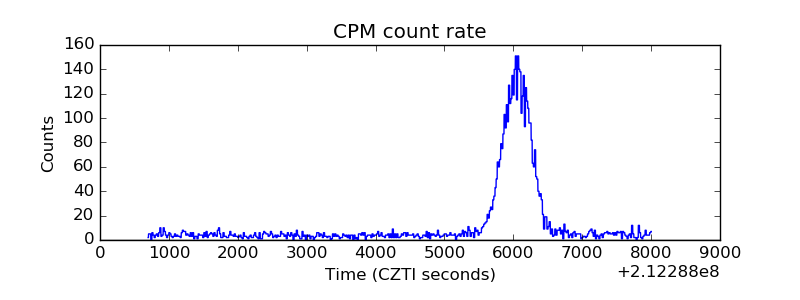 |
| CZT Counter | 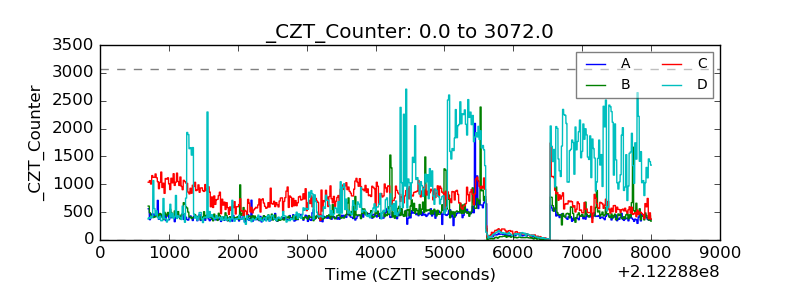 |
| +2.5 Volts monitor | 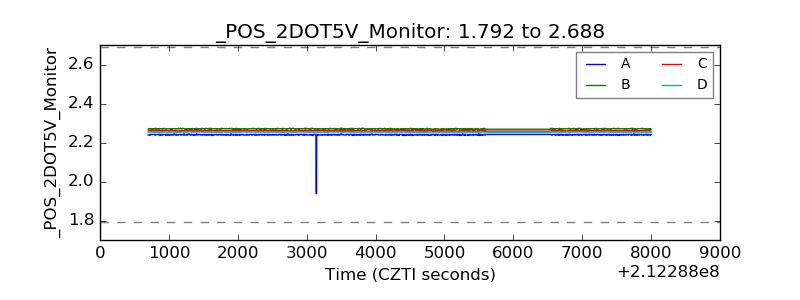 |
| +5 Volts monitor | 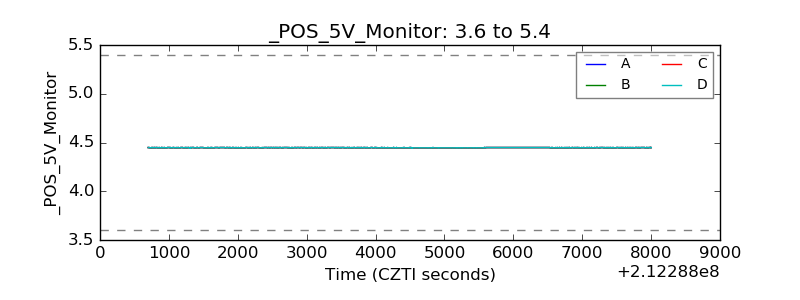 |
| _ROLL_ROT | 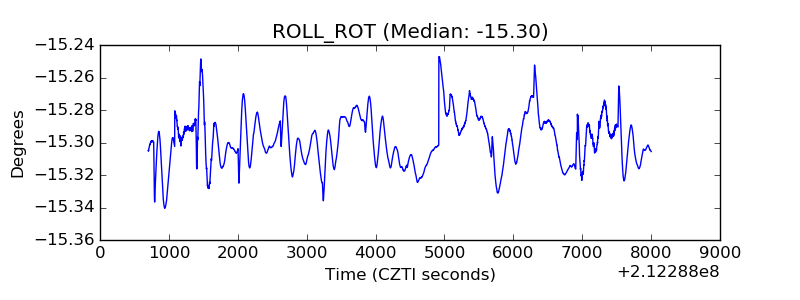 |
| _Roll_DEC | 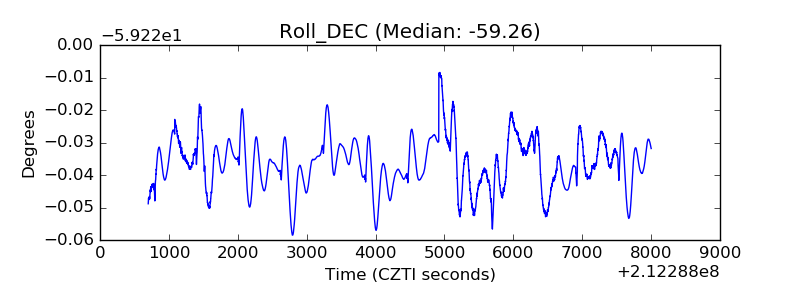 |
| _Roll_RA | 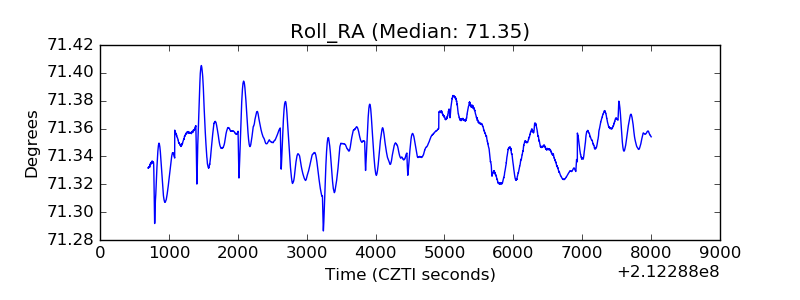 |
| Veto Counter | 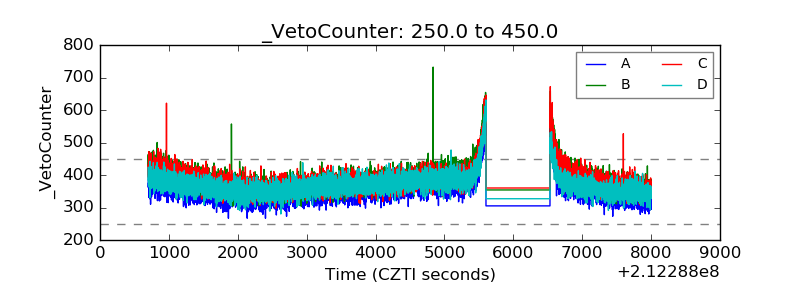 |