| Param | Original file | Final file |
|---|---|---|
| Filename | modeM0/AS1G05_152T01_9000000676_05344cztM0_level2.evt | modeM0/AS1G05_152T01_9000000676_05344cztM0_level2_quad_clean.evt |
| Size (bytes) | 719,608,320 | 96,742,080 |
| Size | 686.3 MB | 92.3 MB |
| Events in quadrant A | 3,397,630 | 618,602 |
| Events in quadrant B | 3,778,500 | 630,578 |
| Events in quadrant C | 3,853,744 | 624,036 |
| Events in quadrant D | 10,263,277 | 541,269 |
| Mode M9 | |||
|---|---|---|---|
| Quadrant | BADHDUFLAG | Total packets | Discarded packets |
| A | 0 | 13 | 0 |
| B | 0 | 13 | 0 |
| C | 0 | 13 | 0 |
| D | 0 | 13 | 1 |
| Mode M0 | |||
|---|---|---|---|
| Quadrant | BADHDUFLAG | Total packets | Discarded packets |
| A | 0 | 15667 | 30 |
| B | 0 | 16260 | 28 |
| C | 0 | 16184 | 18 |
| D | 0 | 35717 | 79 |
| Mode SS | |||
|---|---|---|---|
| Quadrant | BADHDUFLAG | Total packets | Discarded packets |
| A | 0 | 154 | 0 |
| B | 0 | 154 | 0 |
| C | 0 | 154 | 0 |
| D | 0 | 154 | 0 |
| Quadrant | Total seconds | Saturated seconds | Saturation percentage |
|---|---|---|---|
| A | 7384 | 104 | 1.408451% |
| B | 7387 | 103 | 1.394341% |
| C | 7390 | 95 | 1.285521% |
| D | 7381 | 1970 | 26.690150% |
Noise dominated data is calculated using 1-second bins in cleaned event files. If a bin has >2000 counts, and if more than 50% of those come from <1% of pixels, then it is considered to be noise-dominated and hence unusable.
| Quadrant | # 1 sec bins | Bins with >0 counts | Bins with >2000 counts | High rate bins dominated by noise | Noise dominated (total time) | Noise dominated (detector-on time) | Marked lightcurve |
|---|---|---|---|---|---|---|---|
| A | 8760 | 7397 | 56 | 56 | 0.64% | 0.76% | 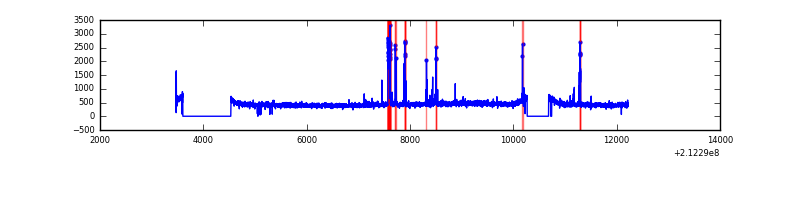 |
| B | 8760 | 7397 | 36 | 36 | 0.41% | 0.49% | 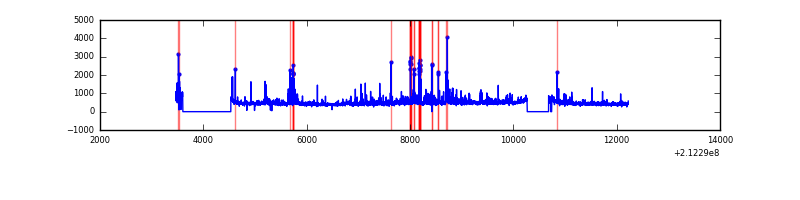 |
| C | 8760 | 7397 | 0 | 0 | 0.00% | 0.00% | 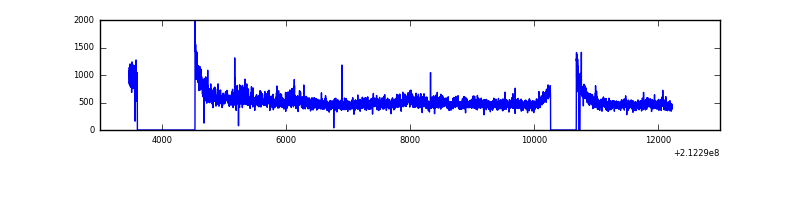 |
| D | 8760 | 7393 | 1267 | 1267 | 14.46% | 17.14% | 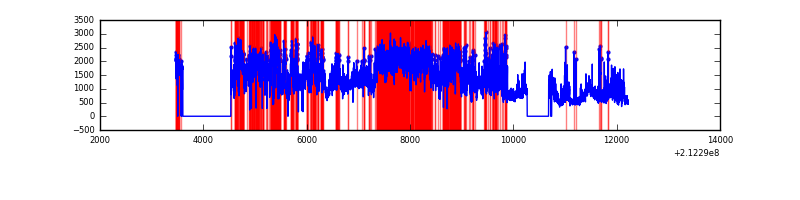 |
Top three noisy pixels from each quadrant. If the there are fewer than three noisy pixels in the level2.evt file, extra rows are filled as -1
| Pixel properties | Quadrant properties | ||||||
|---|---|---|---|---|---|---|---|
| Quadrant | DetID | PixID | Counts | Sigma | Mean | Median | Sigma |
| A | 15 | 174 | 169686 | 1005.88 | 818 | 798 | 167.9 |
| A | 0 | 50 | 65411 | 384.83 | 818 | 798 | 167.9 |
| A | 13 | 251 | 10184 | 55.9 | 818 | 798 | 167.9 |
| B | 4 | 80 | 253330 | 1595.78 | 837 | 815 | 158.2 |
| B | 10 | 16 | 160331 | 1008.07 | 837 | 815 | 158.2 |
| B | 0 | 199 | 31247 | 192.31 | 837 | 815 | 158.2 |
| C | 1 | 16 | 618081 | 3270.95 | 818 | 819 | 188.7 |
| C | 9 | 16 | 26276 | 134.9 | 818 | 819 | 188.7 |
| C | 14 | 67 | 11917 | 58.81 | 818 | 819 | 188.7 |
| D | 2 | 63 | 6958496 | 38335.01 | 742 | 717 | 181.5 |
| D | 2 | 16 | 88538 | 483.86 | 742 | 717 | 181.5 |
| D | 13 | 61 | 72862 | 397.49 | 742 | 717 | 181.5 |
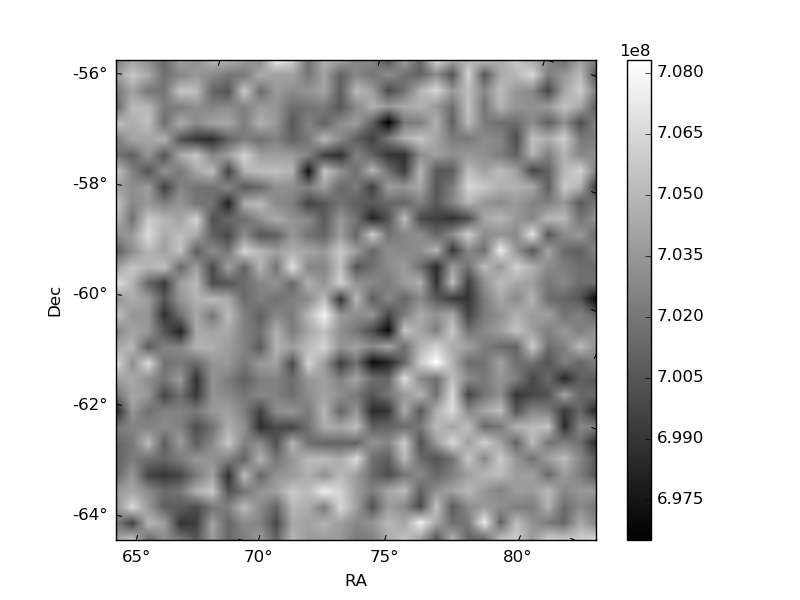
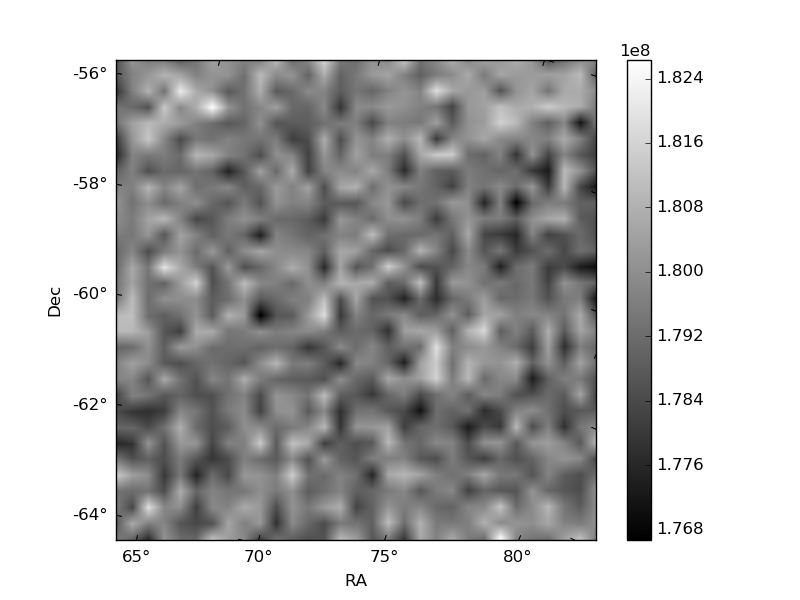
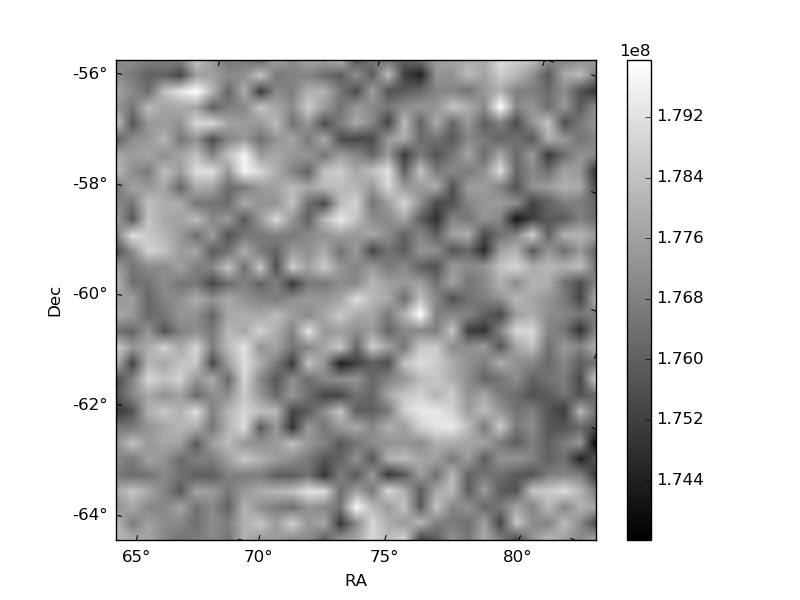
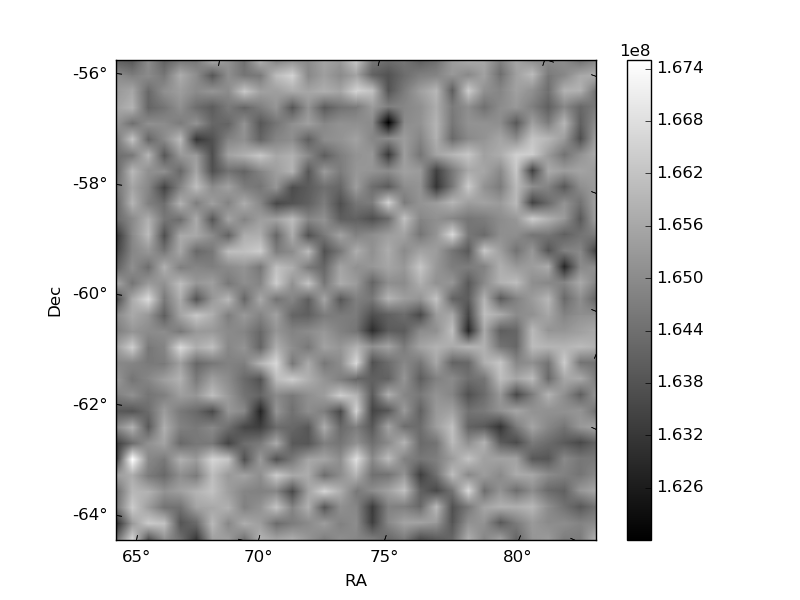
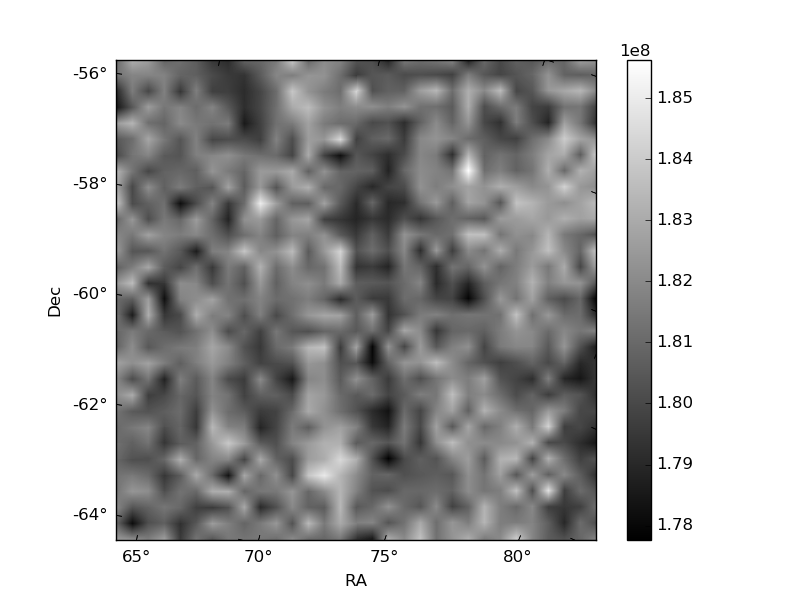
Histogram calculated using DETX and DETY for each event in the final _common_clean file
| Quadrant A | 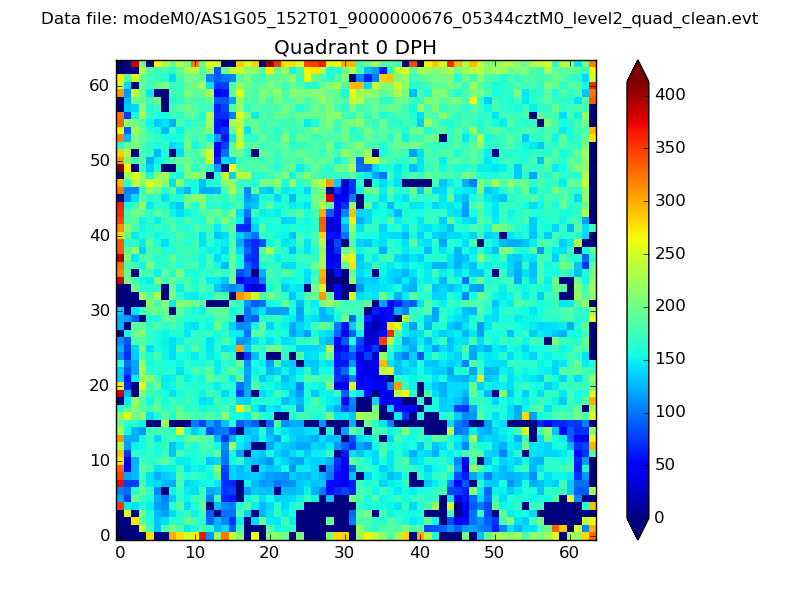 |
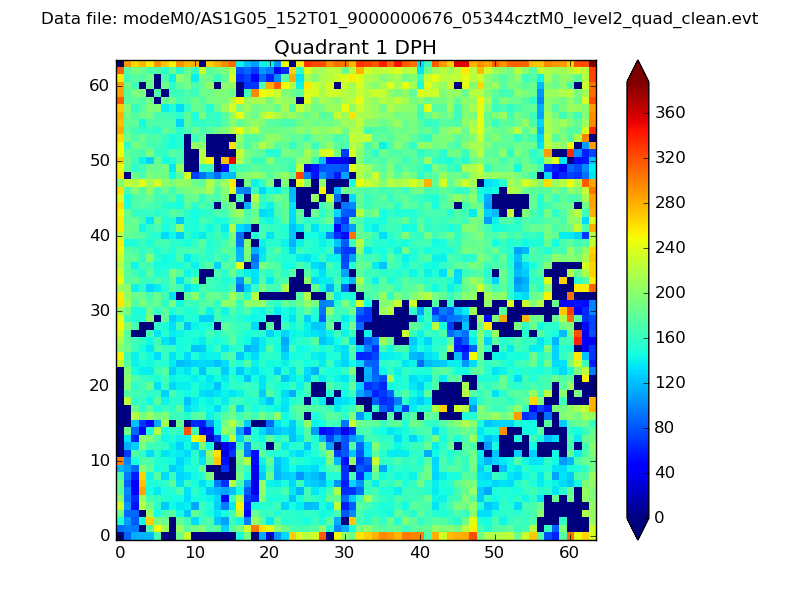 |
Quadrant B |
|---|---|---|---|
| Quadrant D | 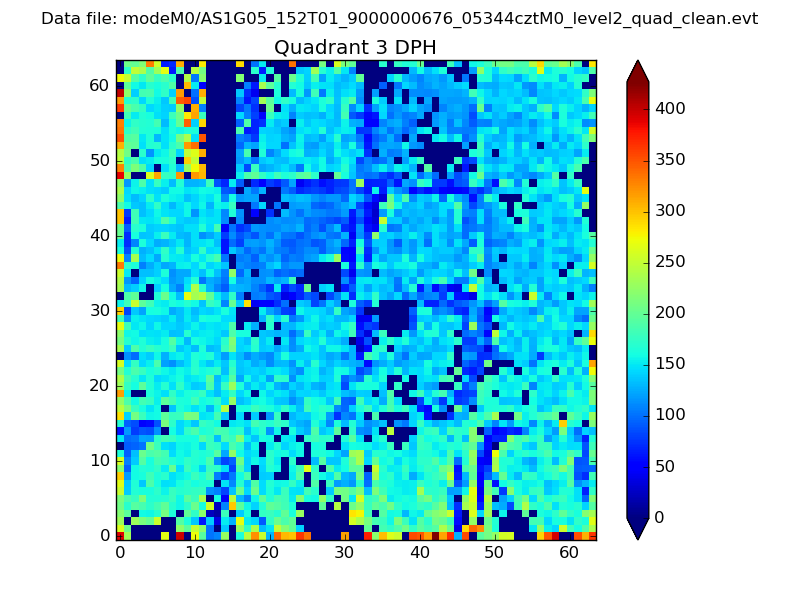 |
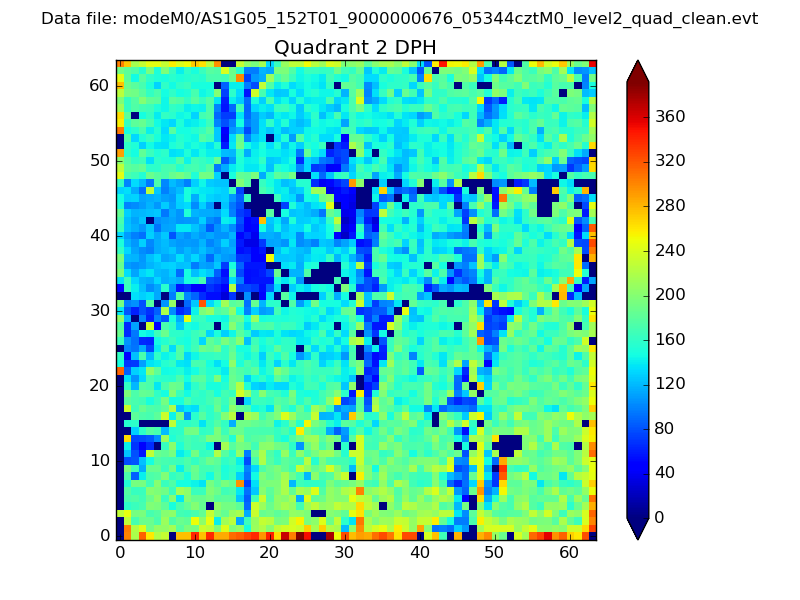 |
Quadrant C |
| Plot type | Count rate plots | Images |
|---|---|---|
| Comparison with Poisson distribution Blue bars denote a histogram of data divided into 1 sec bins. Red curve is a Poisson curve with rate = median count rate of data. |
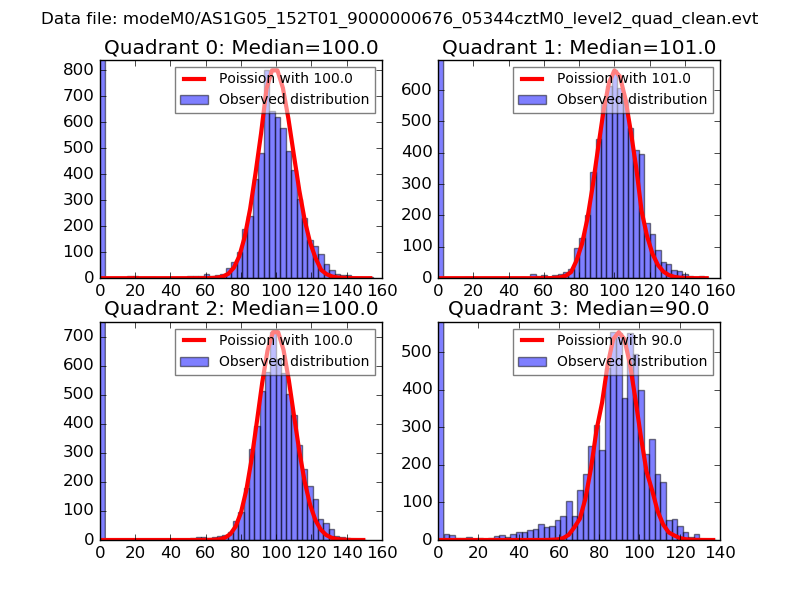 |
 |
| Quadrant-wise count rates Data is divided into 100 sec bins |
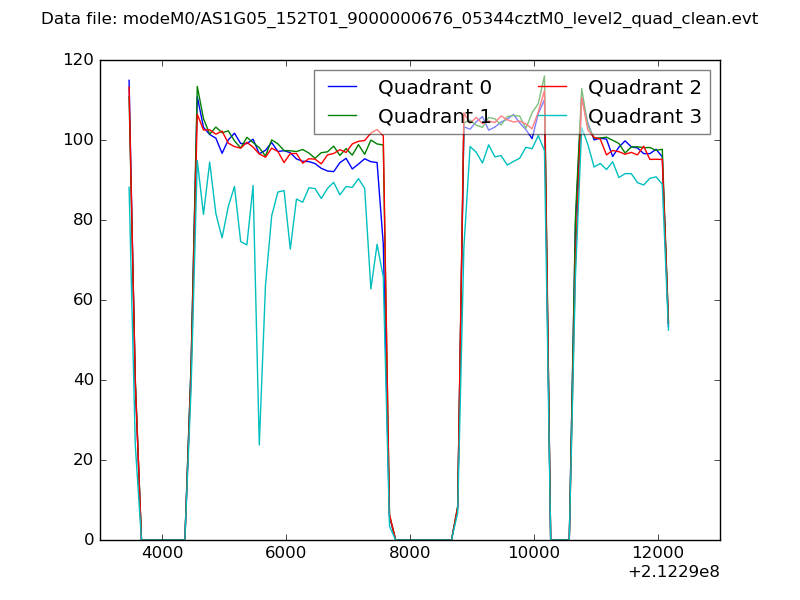 |
|
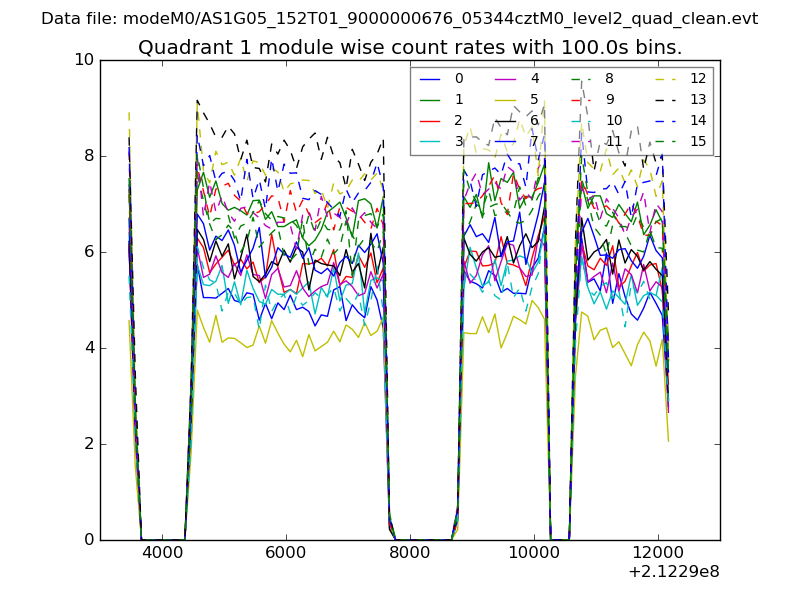
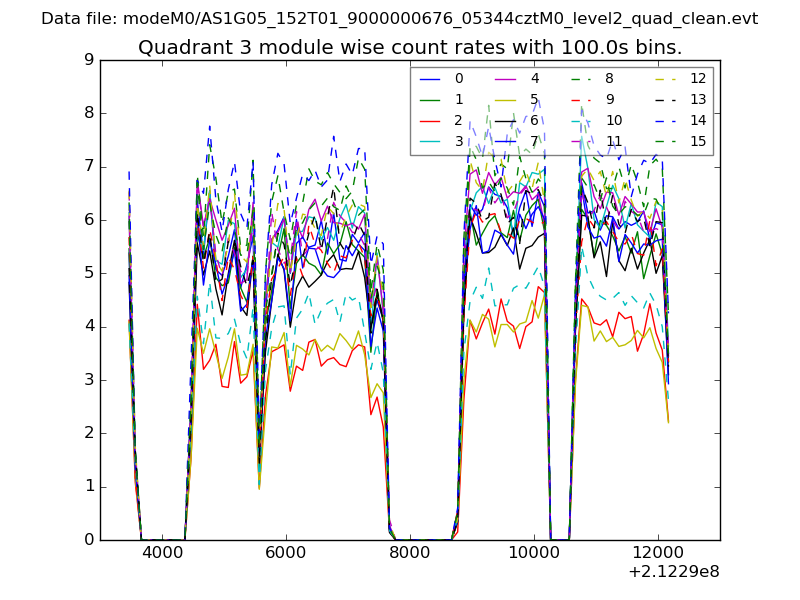
| Module-wise count rates for Quadrant A Data is divided into 100 sec bins |
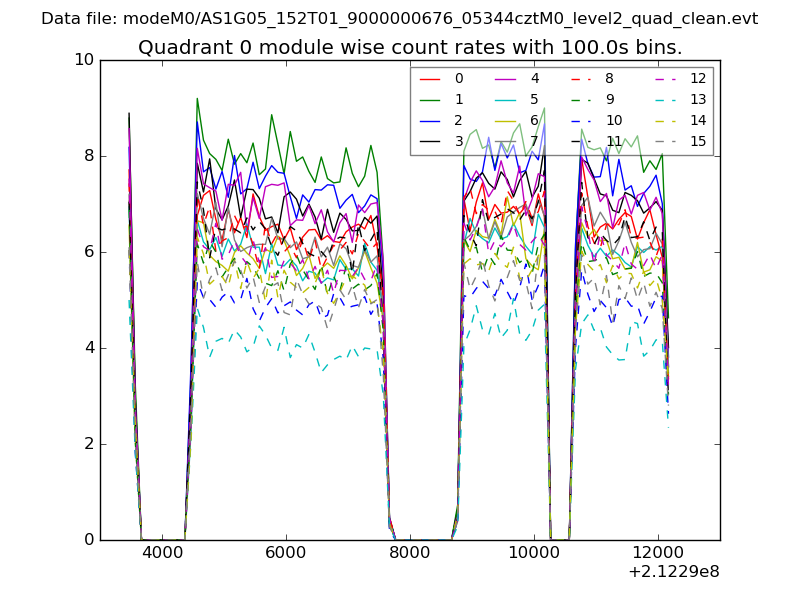 |
 |
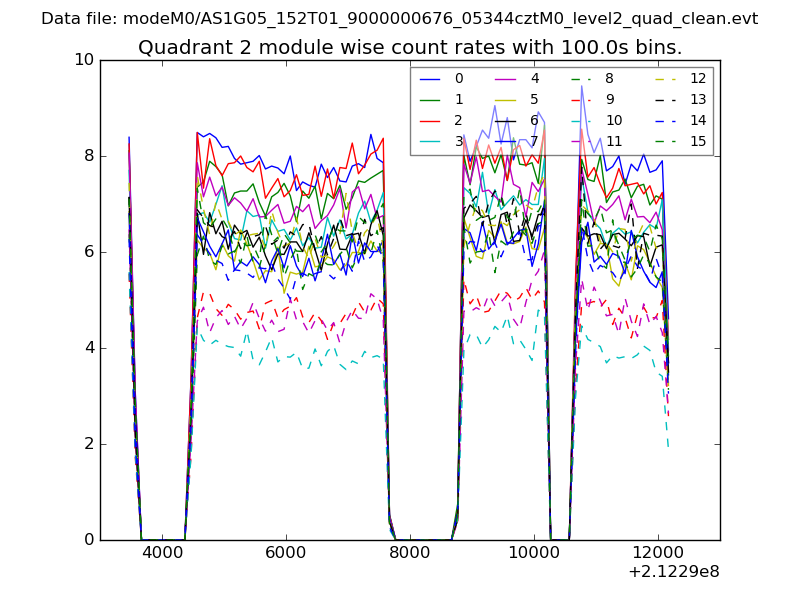
| Module-wise count rates for Quadrant B Data is divided into 100 sec bins |
 |
 |
| Module-wise count rates for Quadrant C Data is divided into 100 sec bins |
 |
 |
| Module-wise count rates for Quadrant D Data is divided into 100 sec bins |
 |
 |
| Parameter | Plot |
|---|---|
| CZT HV Monitor | 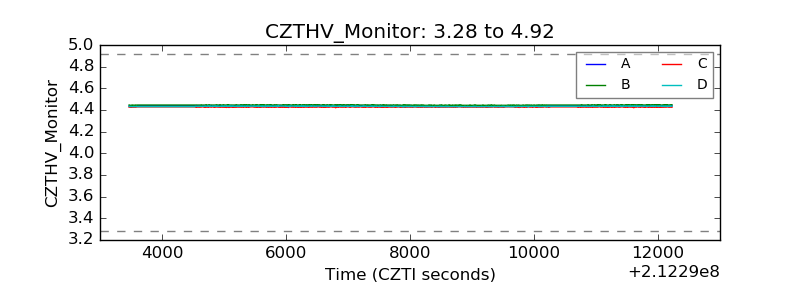 |
| D_VDD | 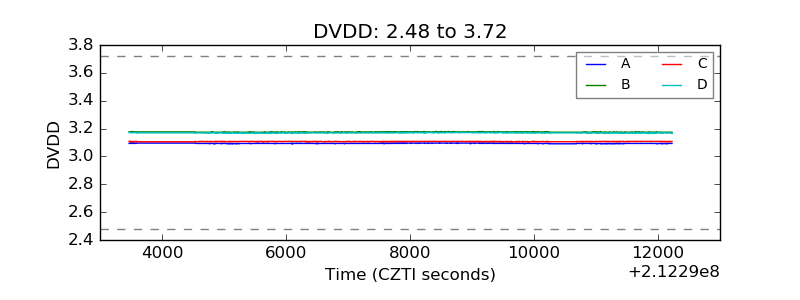 |
| Temperature 1 | 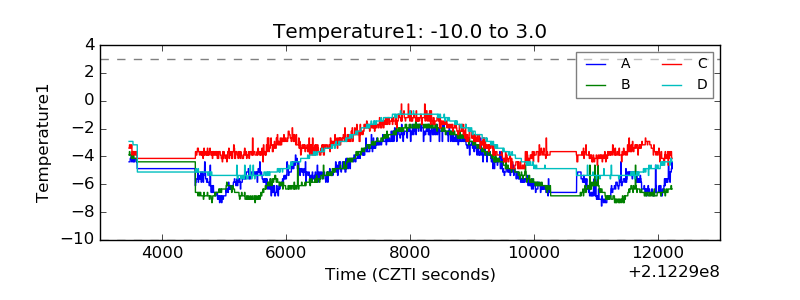 |
| Veto HV Monitor | 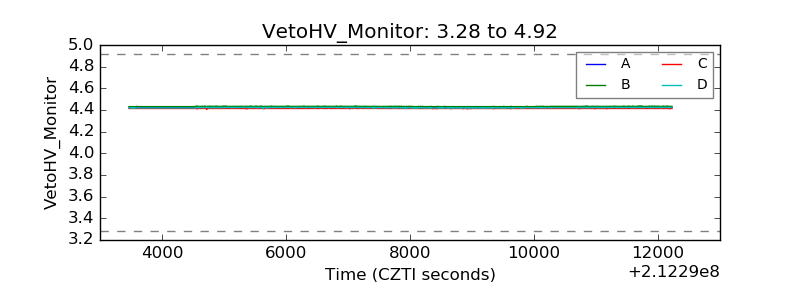 |
| Veto LLD |  |
| Alpha Counter | 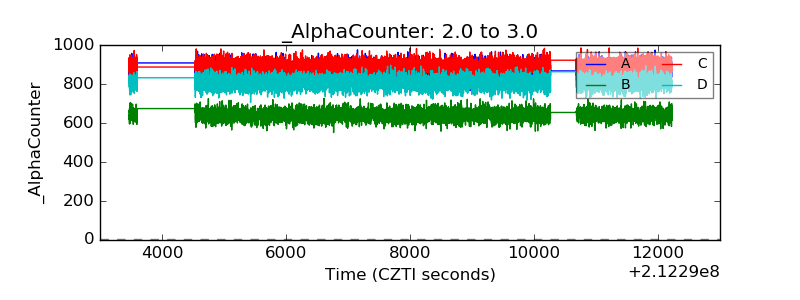 |
| _CPM_Rate | 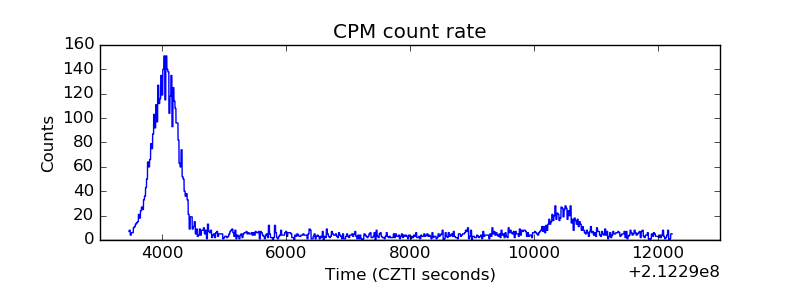 |
| CZT Counter | 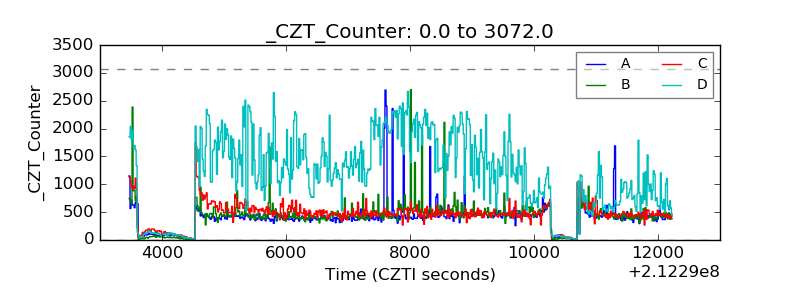 |
| +2.5 Volts monitor |  |
| +5 Volts monitor |  |
| _ROLL_ROT | 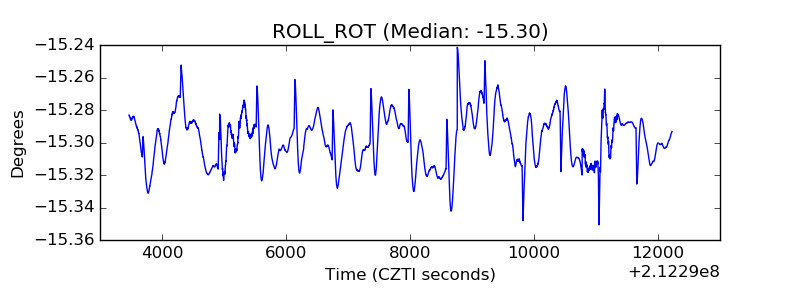 |
| _Roll_DEC | 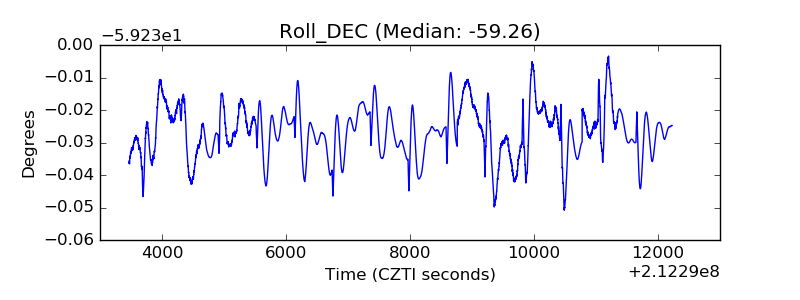 |
| _Roll_RA | 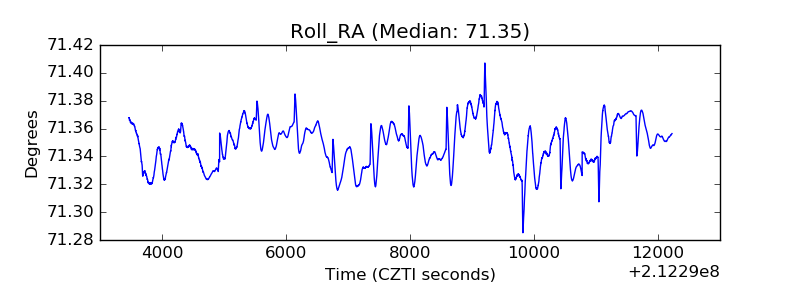 |
| Veto Counter | 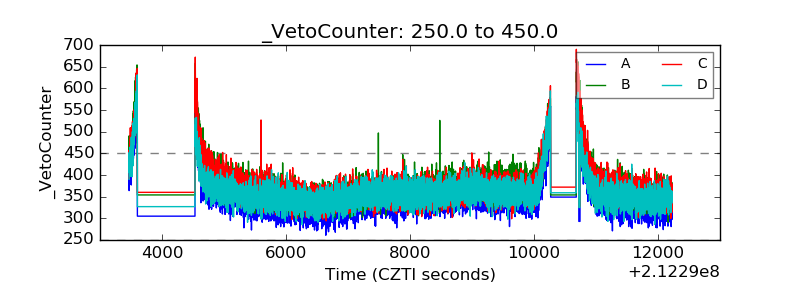 |