| Param | Original file | Final file |
|---|---|---|
| Filename | modeM0/AS1G05_152T01_9000000676_05345cztM0_level2.evt | modeM0/AS1G05_152T01_9000000676_05345cztM0_level2_quad_clean.evt |
| Size (bytes) | 94,150,080 | 19,154,880 |
| Size | 89.8 MB | 18.3 MB |
| Events in quadrant A | 585,922 | 124,550 |
| Events in quadrant B | 618,771 | 127,820 |
| Events in quadrant C | 650,575 | 127,367 |
| Events in quadrant D | 910,926 | 108,568 |
| Mode M9 | |||
|---|---|---|---|
| Quadrant | BADHDUFLAG | Total packets | Discarded packets |
| A | 0 | 4 | 1 |
| B | 0 | 4 | 1 |
| C | 0 | 4 | 0 |
| D | 0 | 4 | 0 |
| Mode M0 | |||
|---|---|---|---|
| Quadrant | BADHDUFLAG | Total packets | Discarded packets |
| A | 0 | 3178 | 539 |
| B | 0 | 3181 | 506 |
| C | 0 | 3225 | 457 |
| D | 0 | 4510 | 1024 |
| Mode SS | |||
|---|---|---|---|
| Quadrant | BADHDUFLAG | Total packets | Discarded packets |
| A | 0 | 30 | 8 |
| B | 0 | 30 | 2 |
| C | 0 | 30 | 8 |
| D | 0 | 30 | 8 |
| Quadrant | Total seconds | Saturated seconds | Saturation percentage |
|---|---|---|---|
| A | 1214 | 32 | 2.635914% |
| B | 1232 | 30 | 2.435065% |
| C | 1255 | 49 | 3.904382% |
| D | 1132 | 89 | 7.862191% |
Noise dominated data is calculated using 1-second bins in cleaned event files. If a bin has >2000 counts, and if more than 50% of those come from <1% of pixels, then it is considered to be noise-dominated and hence unusable.
| Quadrant | # 1 sec bins | Bins with >0 counts | Bins with >2000 counts | High rate bins dominated by noise | Noise dominated (total time) | Noise dominated (detector-on time) | Marked lightcurve |
|---|---|---|---|---|---|---|---|
| A | 1887 | 1401 | 3 | 3 | 0.16% | 0.21% | 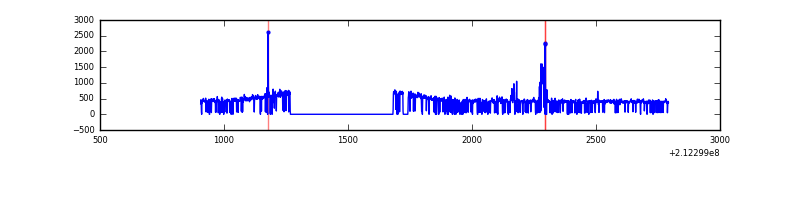 |
| B | 1887 | 1412 | 0 | 0 | 0.00% | 0.00% | 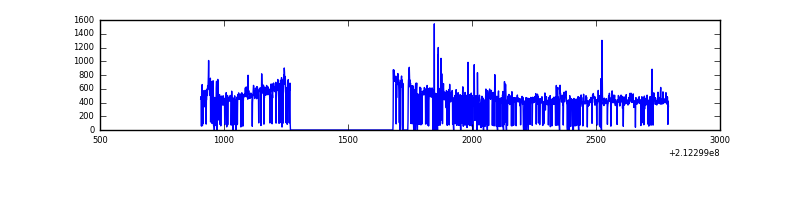 |
| C | 1887 | 1414 | 0 | 0 | 0.00% | 0.00% | 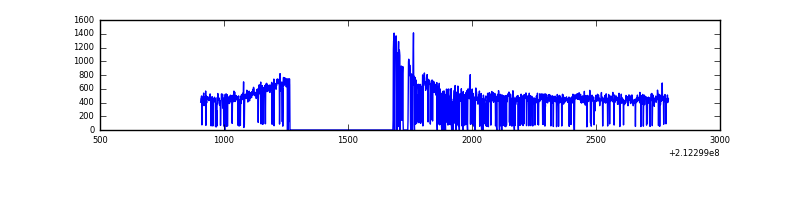 |
| D | 1887 | 1369 | 6 | 6 | 0.32% | 0.44% | 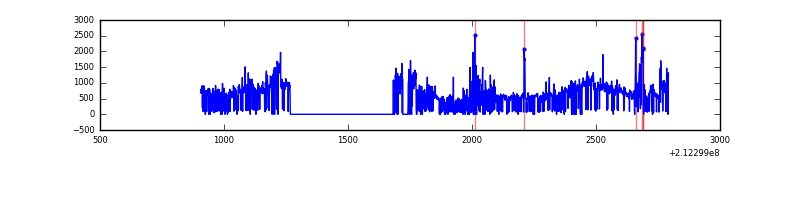 |
Top three noisy pixels from each quadrant. If the there are fewer than three noisy pixels in the level2.evt file, extra rows are filled as -1
| Pixel properties | Quadrant properties | ||||||
|---|---|---|---|---|---|---|---|
| Quadrant | DetID | PixID | Counts | Sigma | Mean | Median | Sigma |
| A | 15 | 174 | 24476 | 791.32 | 142 | 139 | 30.8 |
| A | 0 | 50 | 6575 | 209.27 | 142 | 139 | 30.8 |
| A | 13 | 251 | 5019 | 158.67 | 142 | 139 | 30.8 |
| B | 4 | 80 | 27650 | 896.48 | 149 | 145 | 30.7 |
| B | 0 | 199 | 3552 | 111.05 | 149 | 145 | 30.7 |
| B | 4 | 142 | 3263 | 101.63 | 149 | 145 | 30.7 |
| C | 1 | 16 | 69003 | 1889.9 | 148 | 147 | 36.4 |
| C | 9 | 16 | 1595 | 39.74 | 148 | 147 | 36.4 |
| C | 13 | 61 | 1174 | 28.19 | 148 | 147 | 36.4 |
| D | 2 | 63 | 374148 | 11292.49 | 129 | 124 | 33.1 |
| D | 2 | 16 | 21302 | 639.4 | 129 | 124 | 33.1 |
| D | 8 | 195 | 14498 | 433.98 | 129 | 124 | 33.1 |
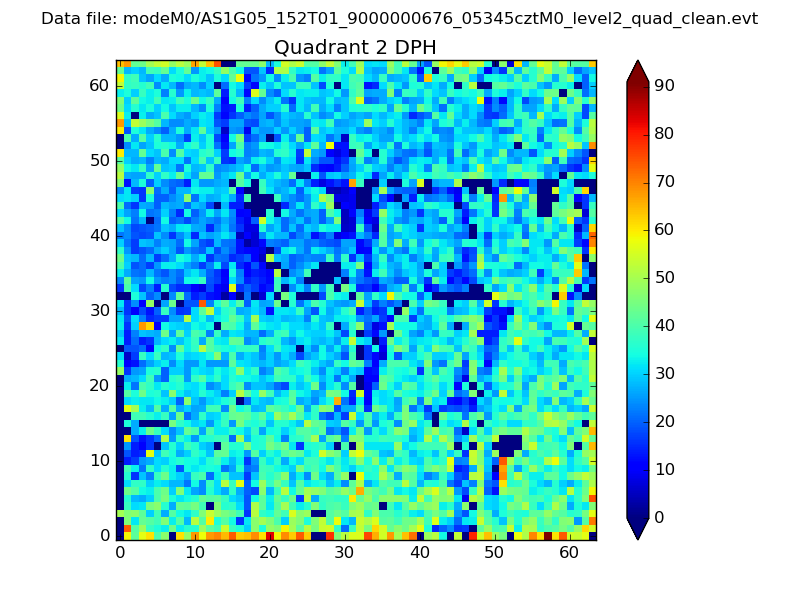
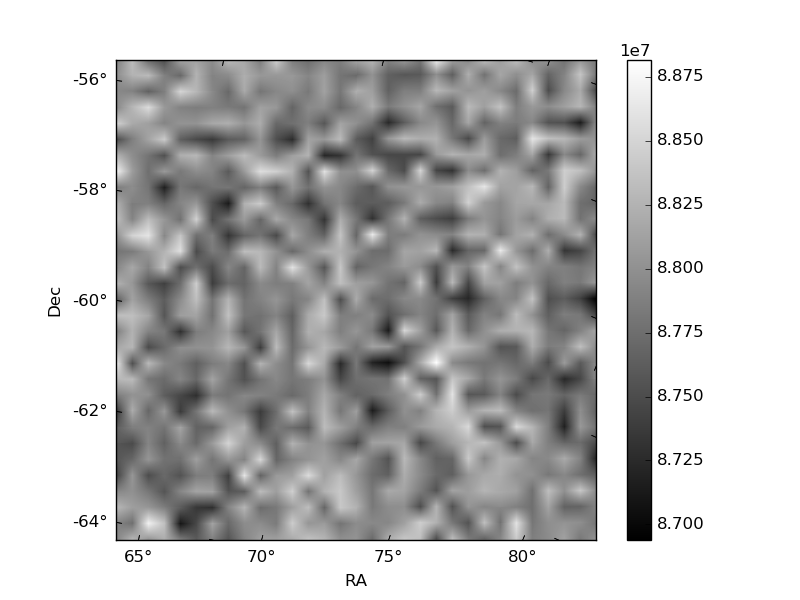
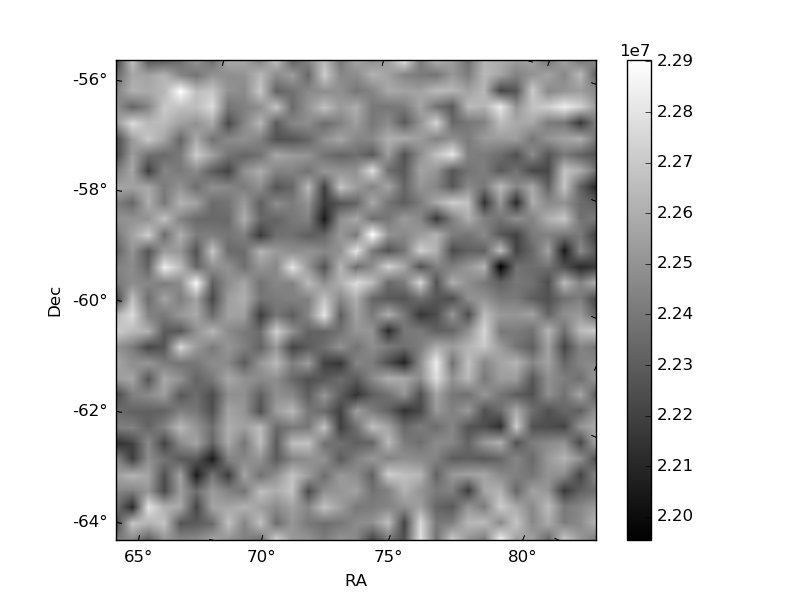
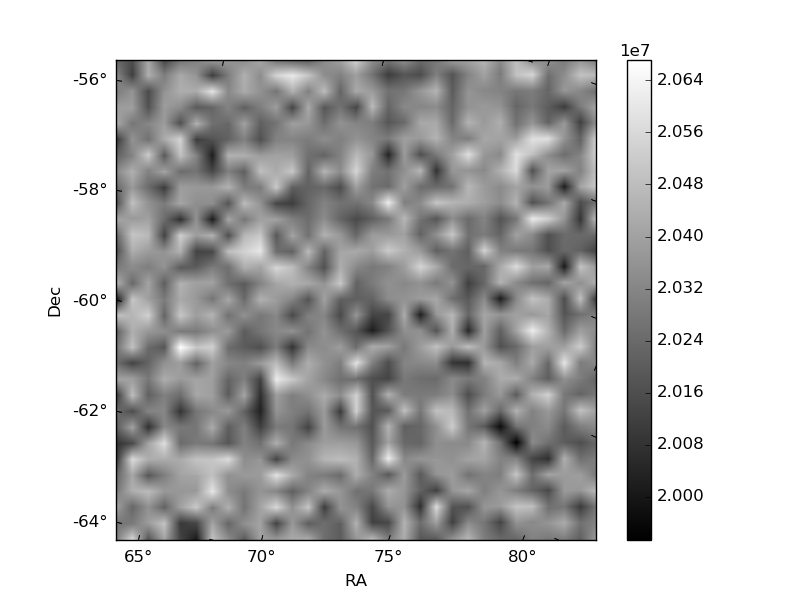
Histogram calculated using DETX and DETY for each event in the final _common_clean file
| Quadrant A | 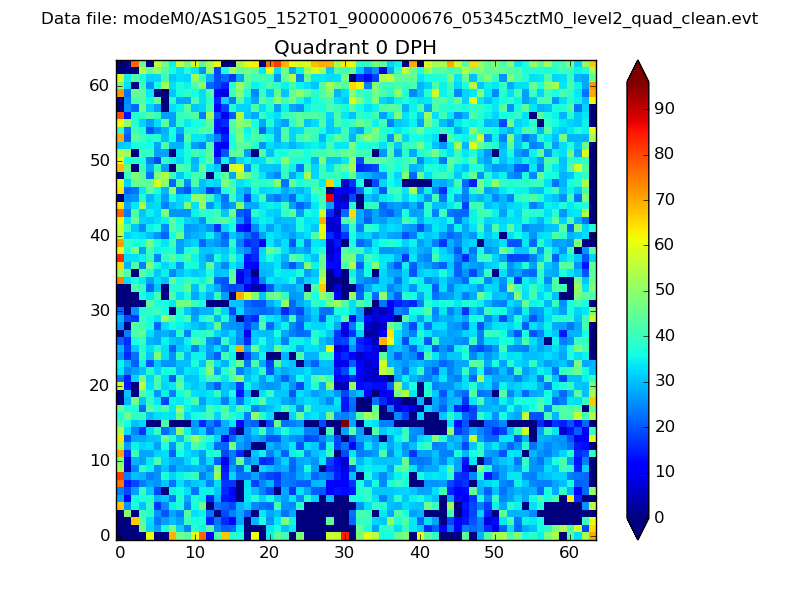 |
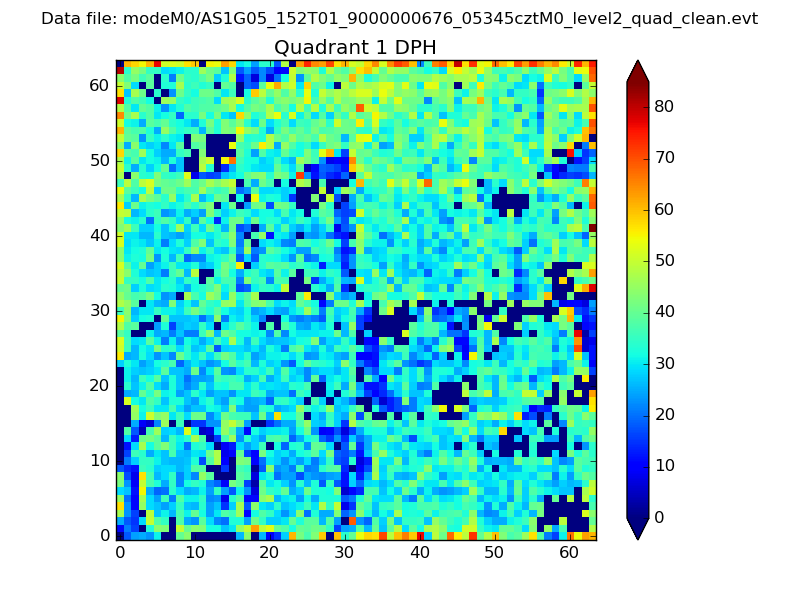 |
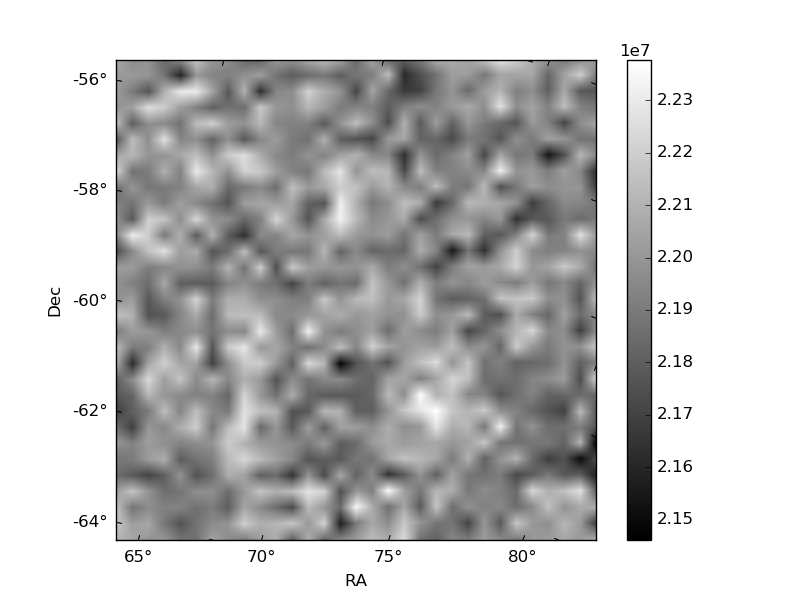
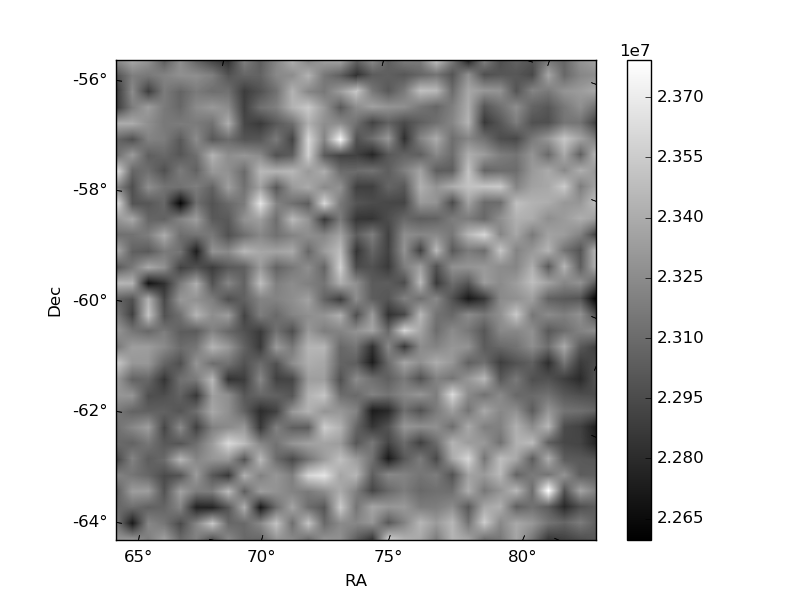
Quadrant B |
|---|---|---|---|
| Quadrant D | 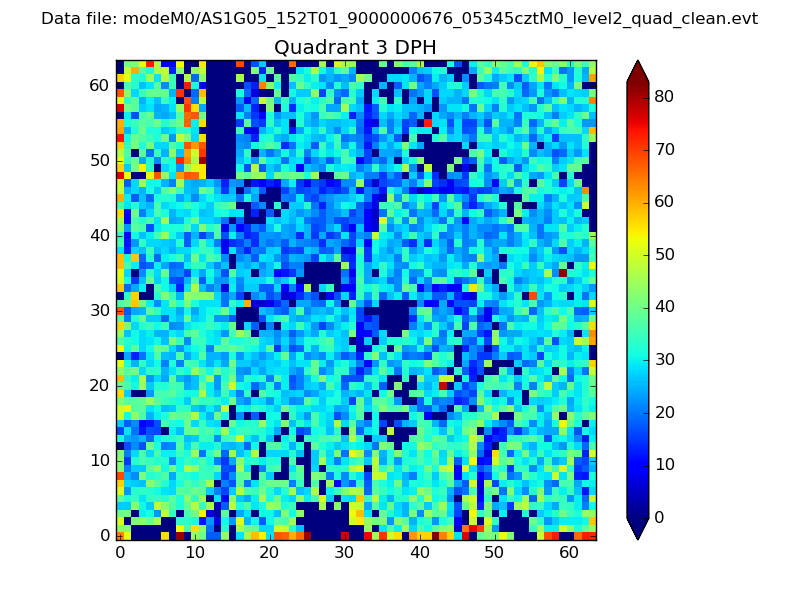 |
 |
Quadrant C |
| Plot type | Count rate plots | Images |
|---|---|---|
| Comparison with Poisson distribution Blue bars denote a histogram of data divided into 1 sec bins. Red curve is a Poisson curve with rate = median count rate of data. |
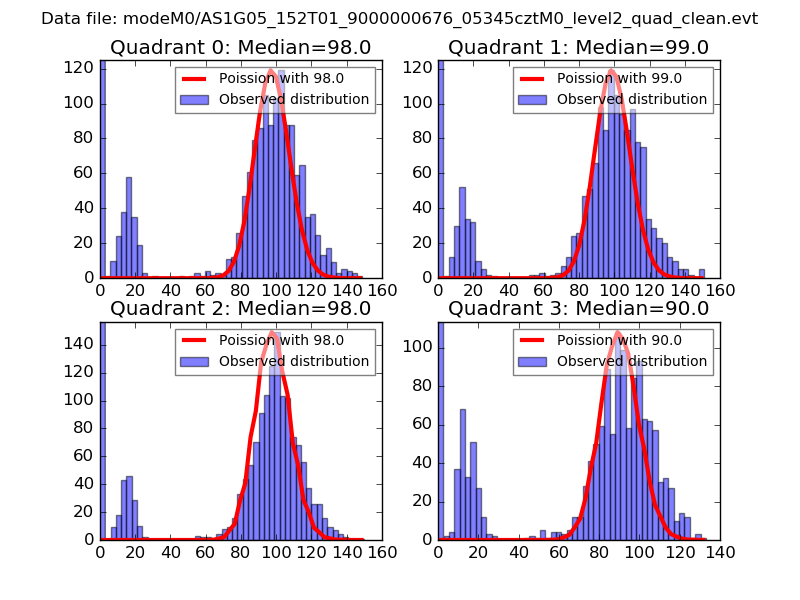 |
 |
| Quadrant-wise count rates Data is divided into 100 sec bins |
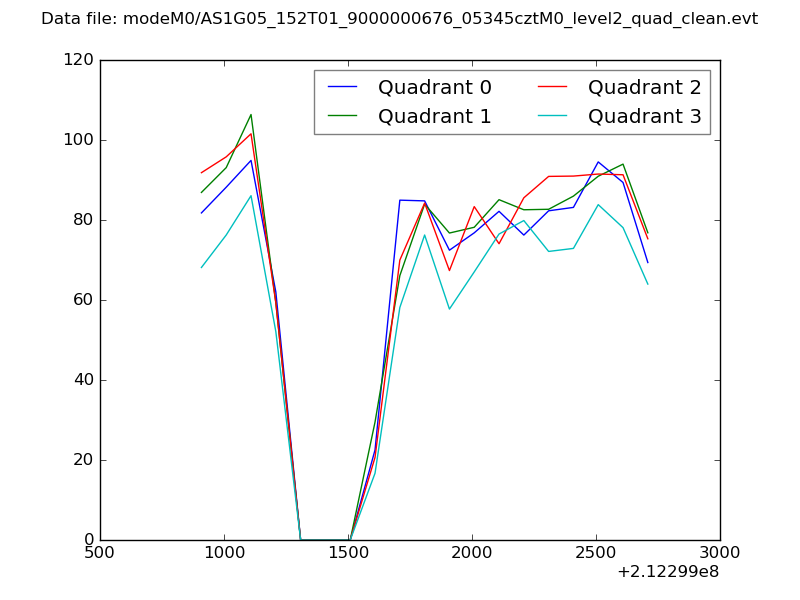 |
|
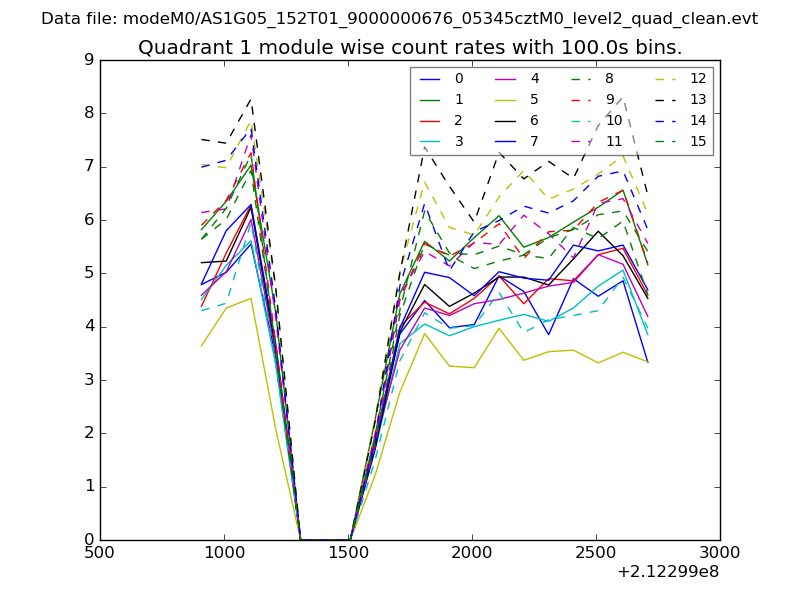
| Module-wise count rates for Quadrant A Data is divided into 100 sec bins |
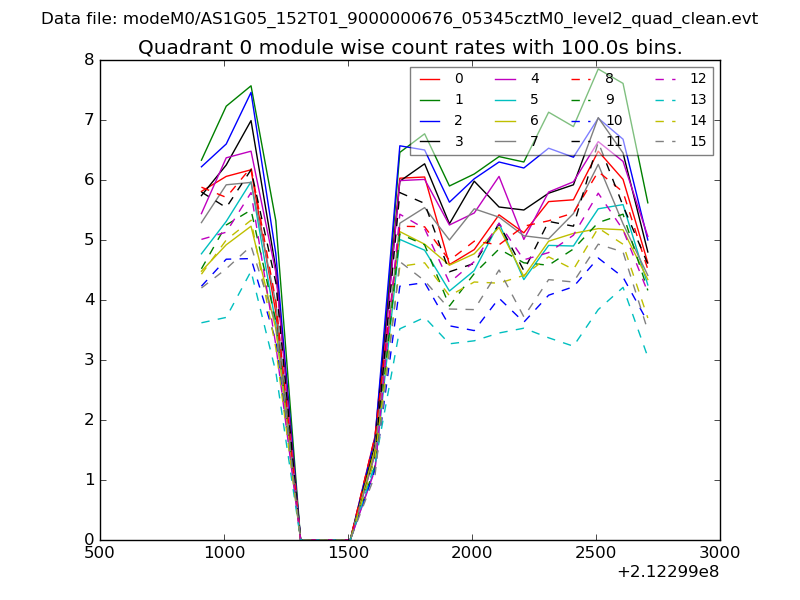 |
 |
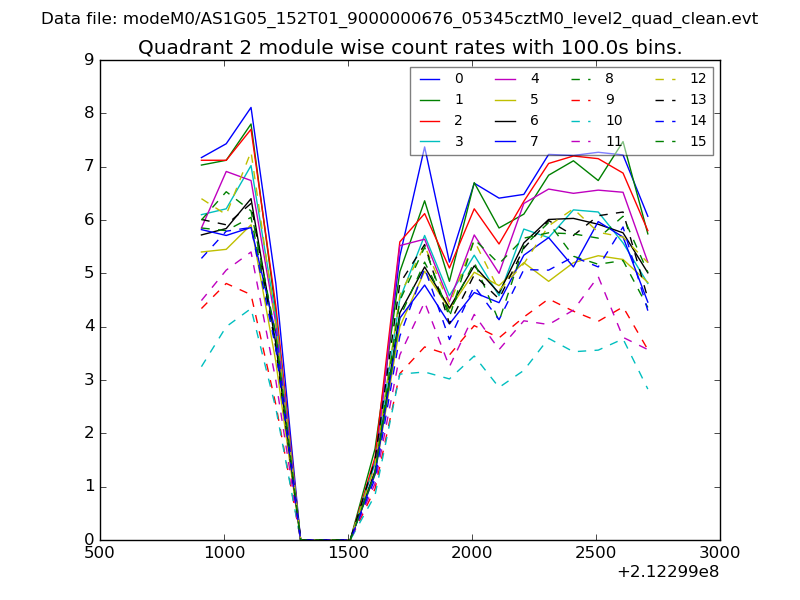
| Module-wise count rates for Quadrant B Data is divided into 100 sec bins |
 |
 |
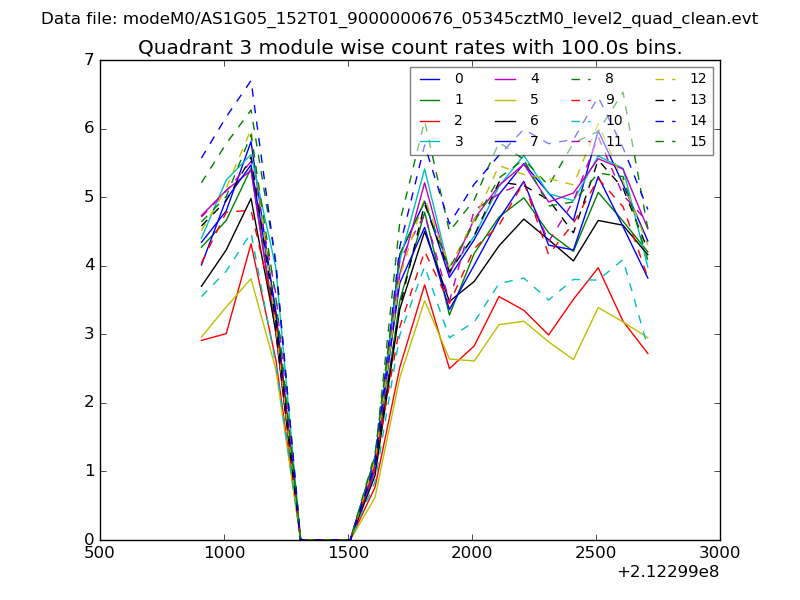
| Module-wise count rates for Quadrant C Data is divided into 100 sec bins |
 |
 |
| Module-wise count rates for Quadrant D Data is divided into 100 sec bins |
 |
 |
| Parameter | Plot |
|---|---|
| CZT HV Monitor | 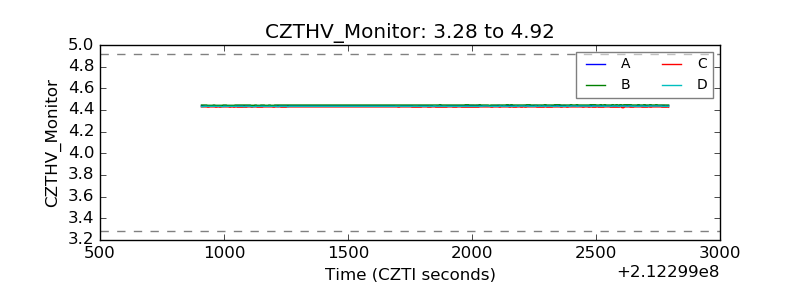 |
| D_VDD | 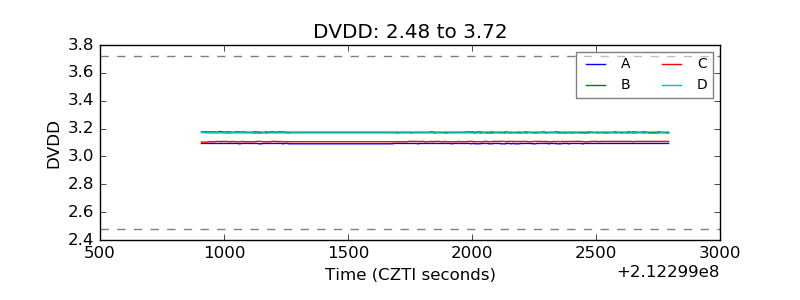 |
| Temperature 1 | 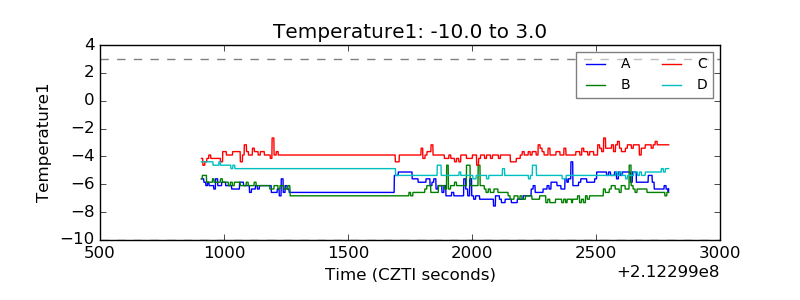 |
| Veto HV Monitor | 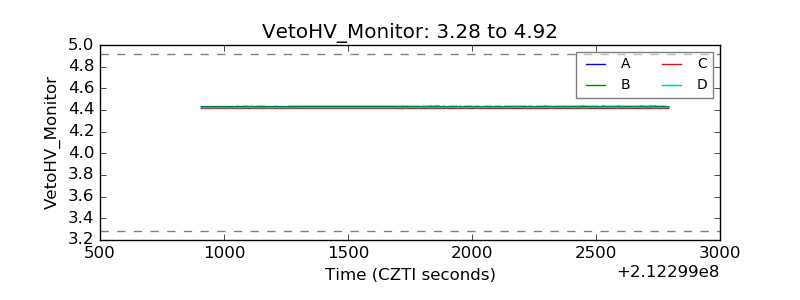 |
| Veto LLD | 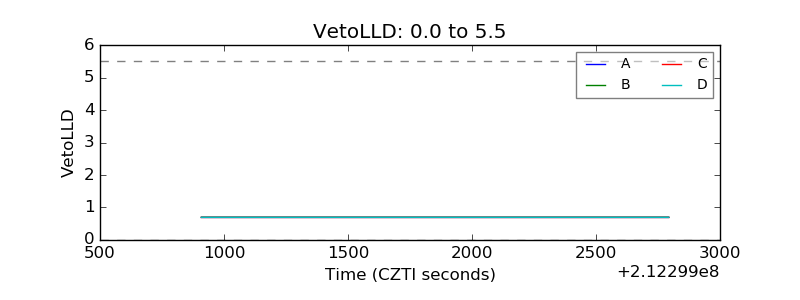 |
| Alpha Counter | 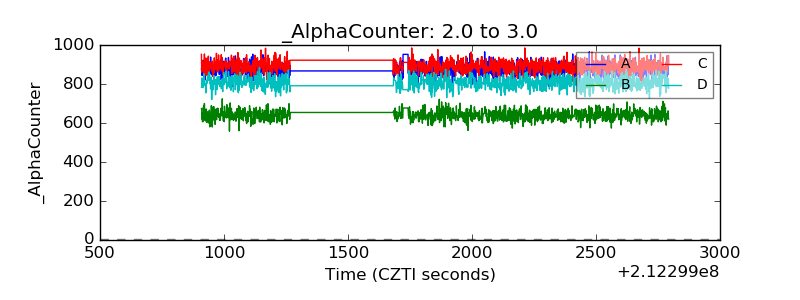 |
| _CPM_Rate | 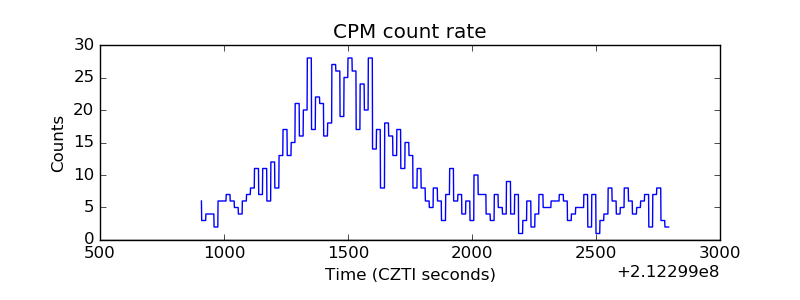 |
| CZT Counter | 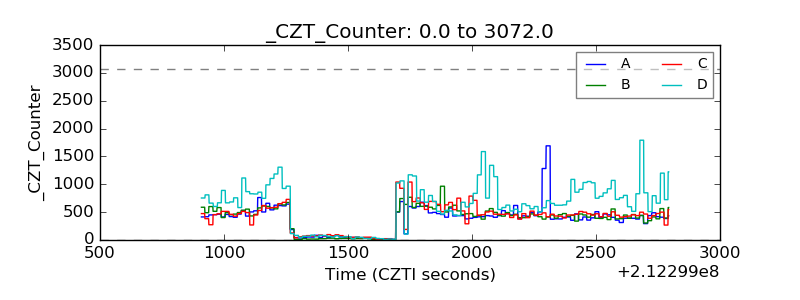 |
| +2.5 Volts monitor |  |
| +5 Volts monitor |  |
| _ROLL_ROT | 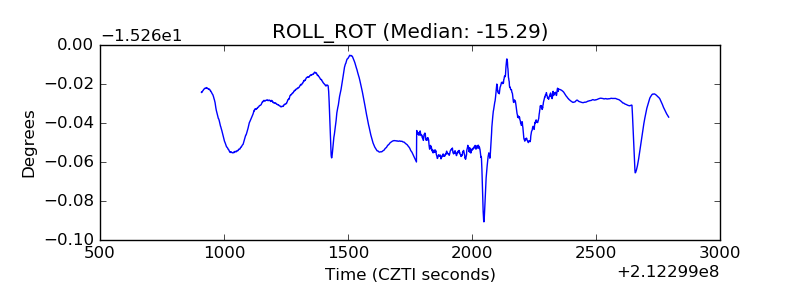 |
| _Roll_DEC | 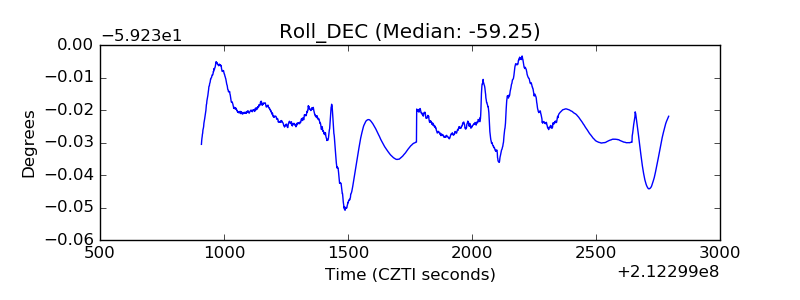 |
| _Roll_RA | 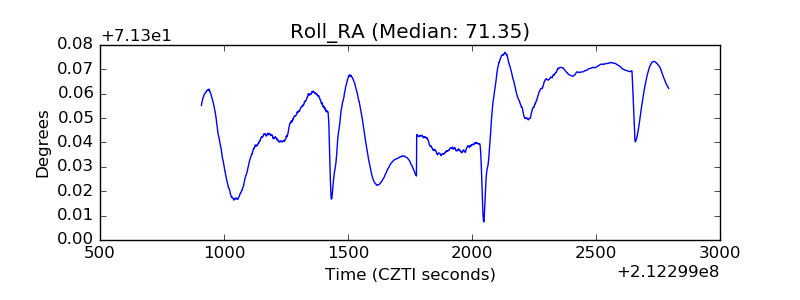 |
| Veto Counter | 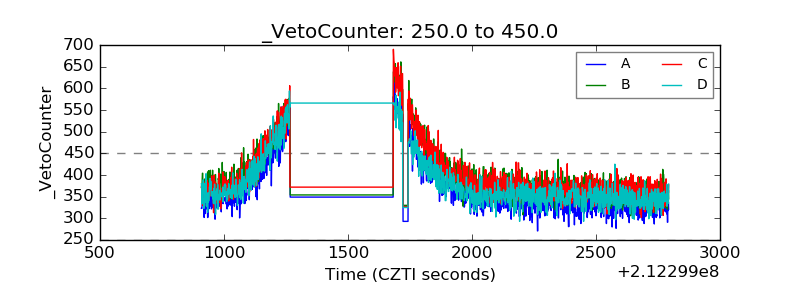 |