| Param | Original file | Final file |
|---|---|---|
| Filename | modeM0/AS1G05_152T01_9000000676_05350cztM0_level2.evt | modeM0/AS1G05_152T01_9000000676_05350cztM0_level2_quad_clean.evt |
| Size (bytes) | 189,495,360 | 38,848,320 |
| Size | 180.7 MB | 37.0 MB |
| Events in quadrant A | 1,200,684 | 250,920 |
| Events in quadrant B | 1,679,395 | 237,216 |
| Events in quadrant C | 1,163,325 | 255,391 |
| Events in quadrant D | 1,513,904 | 243,431 |
| Mode M0 | |||
|---|---|---|---|
| Quadrant | BADHDUFLAG | Total packets | Discarded packets |
| A | 0 | 5991 | 412 |
| B | 0 | 7812 | 1057 |
| C | 0 | 5681 | 295 |
| D | 0 | 6726 | 563 |
| Mode SS | |||
|---|---|---|---|
| Quadrant | BADHDUFLAG | Total packets | Discarded packets |
| A | 0 | 56 | 4 |
| B | 0 | 56 | 2 |
| C | 0 | 56 | 4 |
| D | 0 | 56 | 2 |
| Quadrant | Total seconds | Saturated seconds | Saturation percentage |
|---|---|---|---|
| A | 2636 | 20 | 0.758725% |
| B | 2584 | 170 | 6.578947% |
| C | 2669 | 1 | 0.037467% |
| D | 2644 | 34 | 1.285930% |
Noise dominated data is calculated using 1-second bins in cleaned event files. If a bin has >2000 counts, and if more than 50% of those come from <1% of pixels, then it is considered to be noise-dominated and hence unusable.
| Quadrant | # 1 sec bins | Bins with >0 counts | Bins with >2000 counts | High rate bins dominated by noise | Noise dominated (total time) | Noise dominated (detector-on time) | Marked lightcurve |
|---|---|---|---|---|---|---|---|
| A | 2815 | 2798 | 19 | 19 | 0.67% | 0.68% | 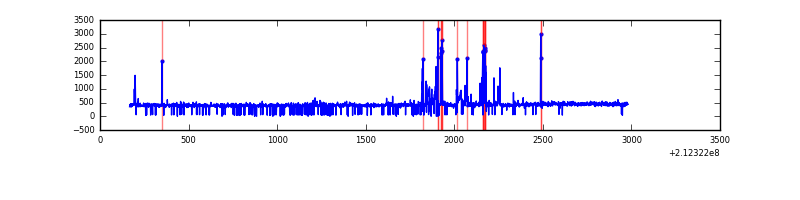 |
| B | 2815 | 2729 | 153 | 153 | 5.44% | 5.61% | 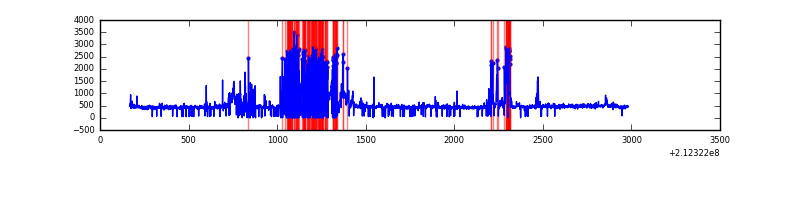 |
| C | 2815 | 2802 | 0 | 0 | 0.00% | 0.00% | 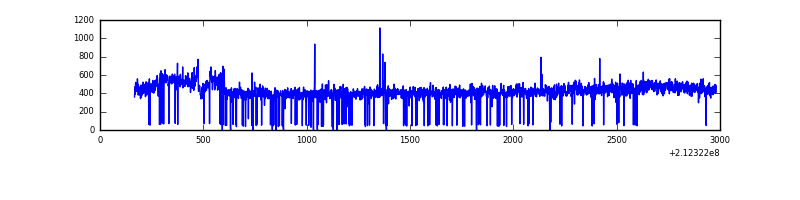 |
| D | 2815 | 2787 | 30 | 30 | 1.07% | 1.08% | 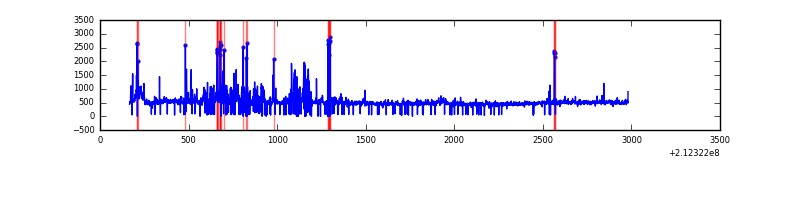 |
Top three noisy pixels from each quadrant. If the there are fewer than three noisy pixels in the level2.evt file, extra rows are filled as -1
| Pixel properties | Quadrant properties | ||||||
|---|---|---|---|---|---|---|---|
| Quadrant | DetID | PixID | Counts | Sigma | Mean | Median | Sigma |
| A | 15 | 174 | 101569 | 1676.45 | 279 | 273 | 60.4 |
| A | 0 | 50 | 16482 | 268.26 | 279 | 273 | 60.4 |
| A | 15 | 234 | 5917 | 93.41 | 279 | 273 | 60.4 |
| B | 10 | 16 | 553821 | 10201.32 | 274 | 267 | 54.3 |
| B | 14 | 167 | 20442 | 371.8 | 274 | 267 | 54.3 |
| B | 15 | 204 | 13890 | 251.06 | 274 | 267 | 54.3 |
| C | 1 | 16 | 56017 | 843.23 | 279 | 280 | 66.1 |
| C | 8 | 128 | 6620 | 95.92 | 279 | 280 | 66.1 |
| C | 8 | 112 | 3228 | 44.6 | 279 | 280 | 66.1 |
| D | 2 | 63 | 203727 | 3022.97 | 269 | 260 | 67.3 |
| D | 2 | 16 | 115945 | 1718.77 | 269 | 260 | 67.3 |
| D | 12 | 110 | 46554 | 687.8 | 269 | 260 | 67.3 |
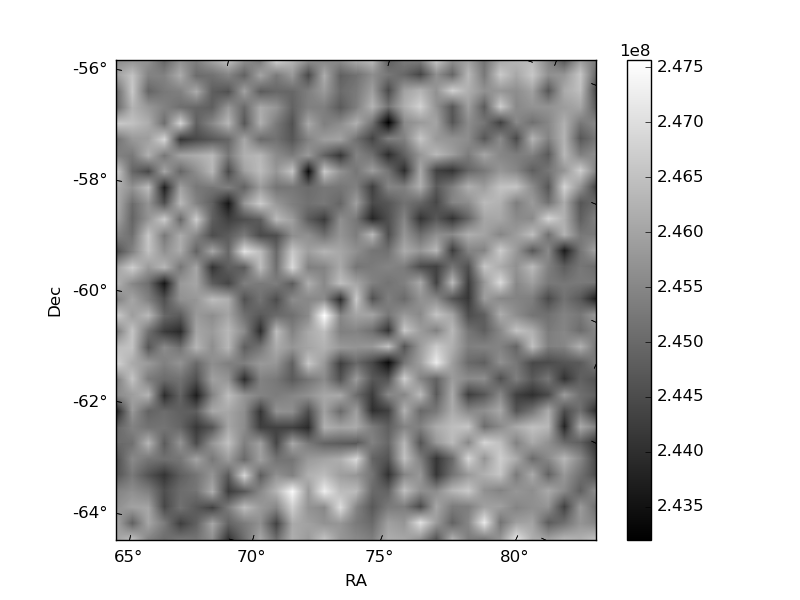
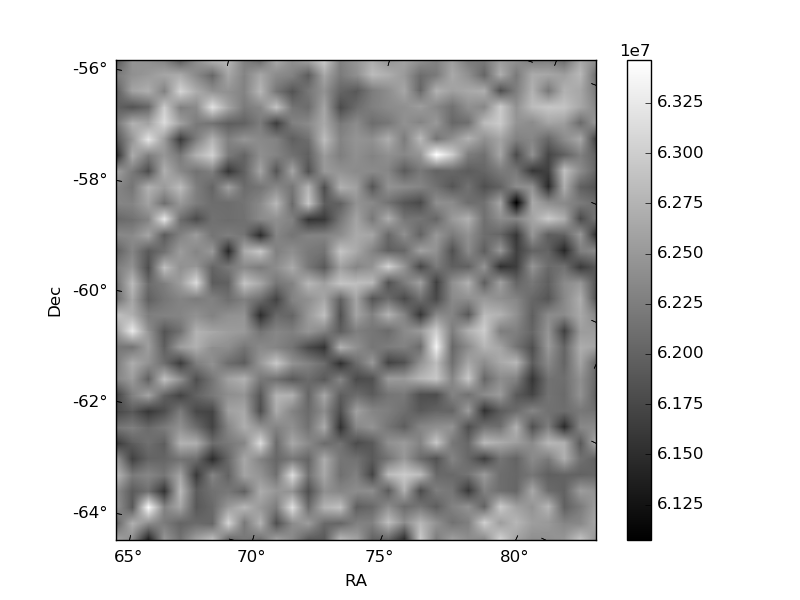
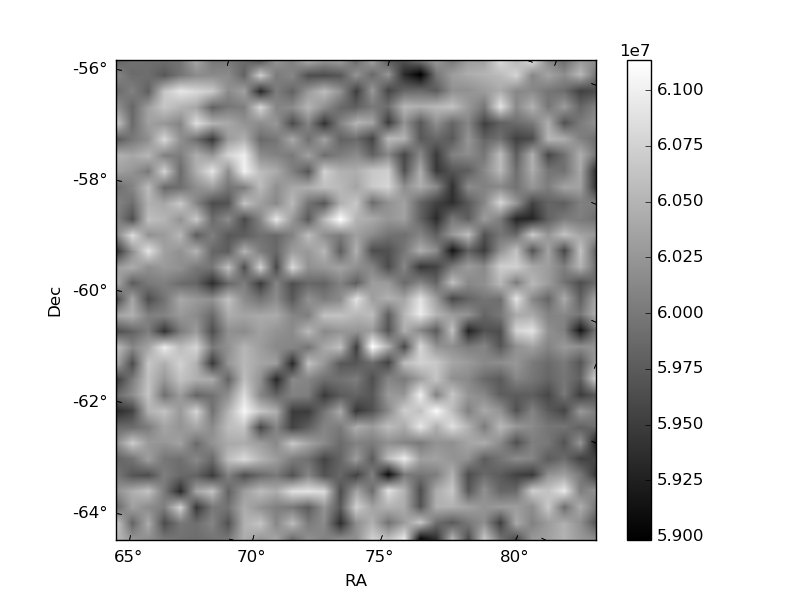
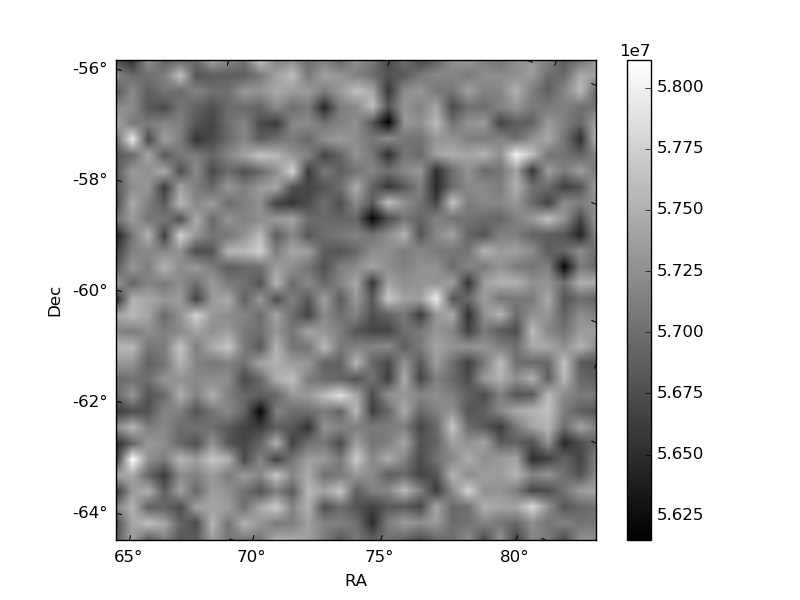
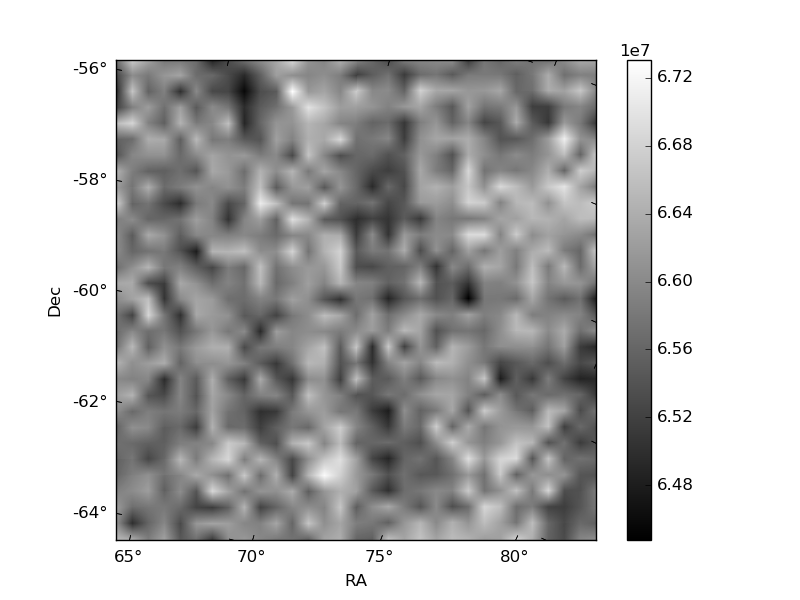
Histogram calculated using DETX and DETY for each event in the final _common_clean file
| Quadrant A | 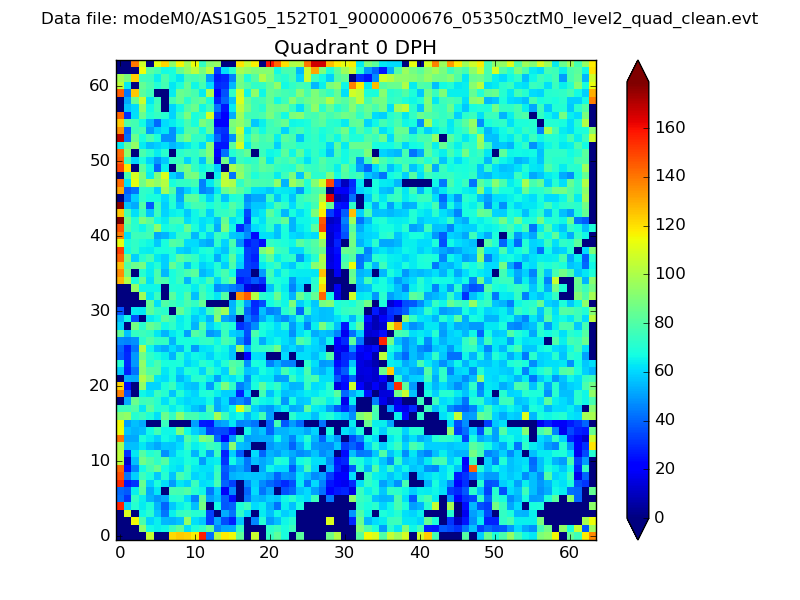 |
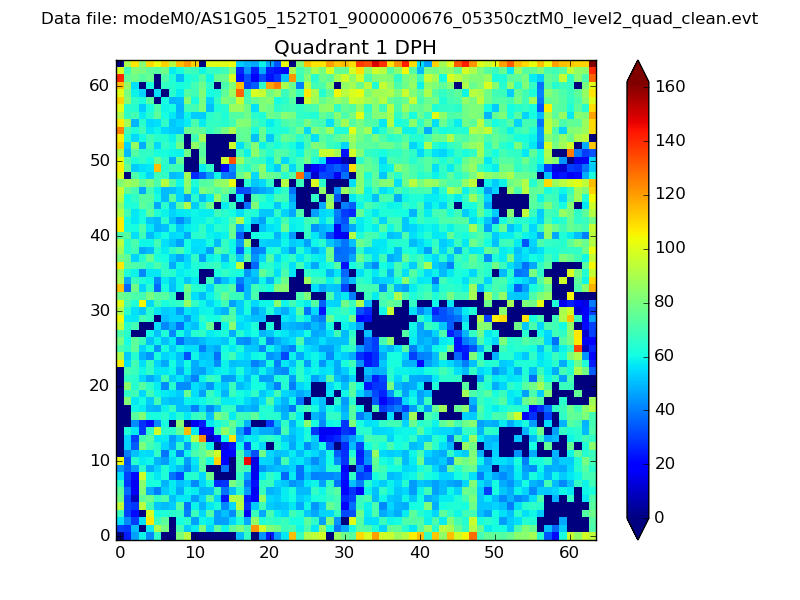 |
Quadrant B |
|---|---|---|---|
| Quadrant D | 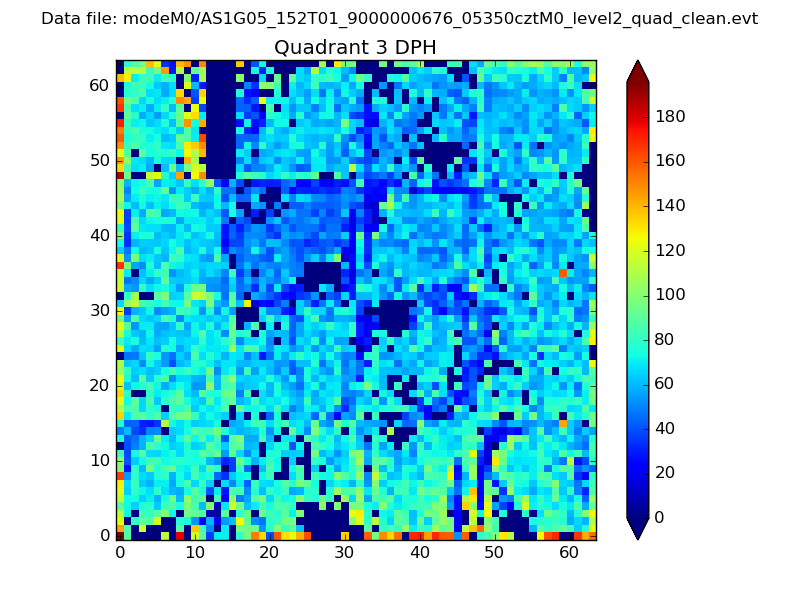 |
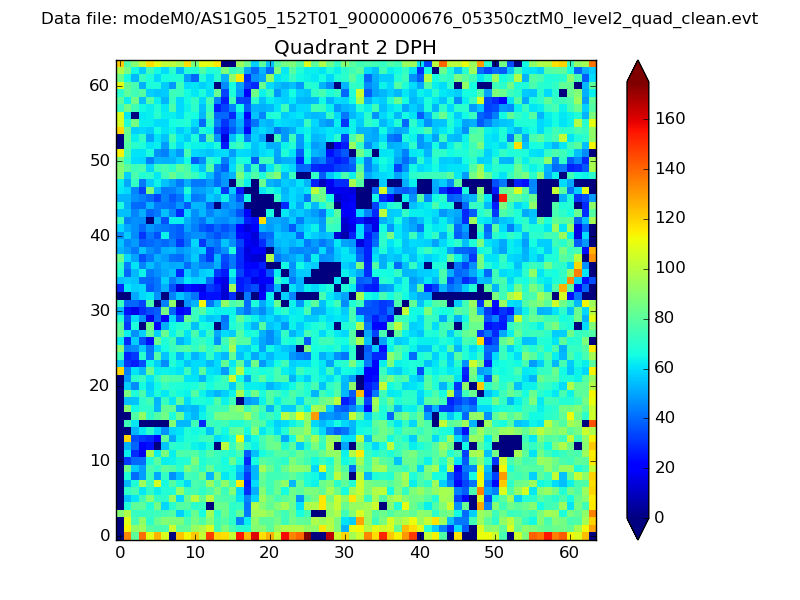 |
Quadrant C |
| Plot type | Count rate plots | Images |
|---|---|---|
| Comparison with Poisson distribution Blue bars denote a histogram of data divided into 1 sec bins. Red curve is a Poisson curve with rate = median count rate of data. |
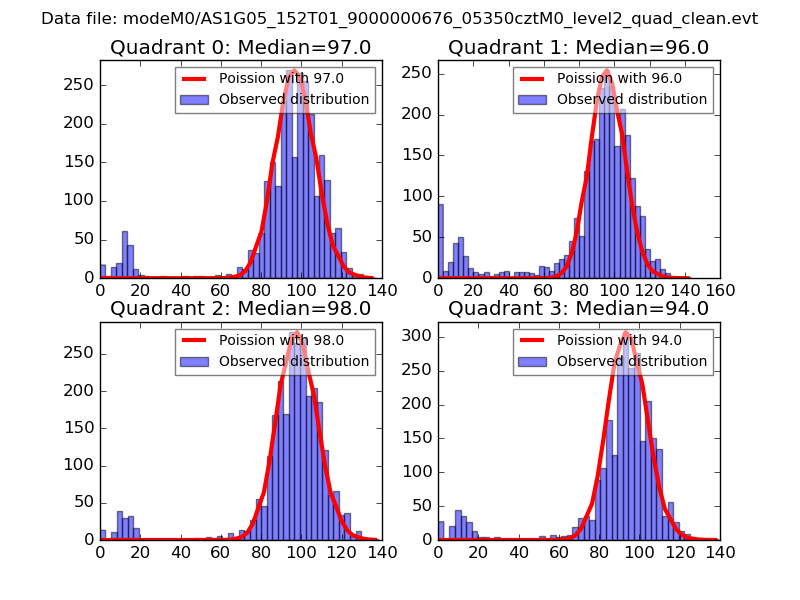 |
 |
| Quadrant-wise count rates Data is divided into 100 sec bins |
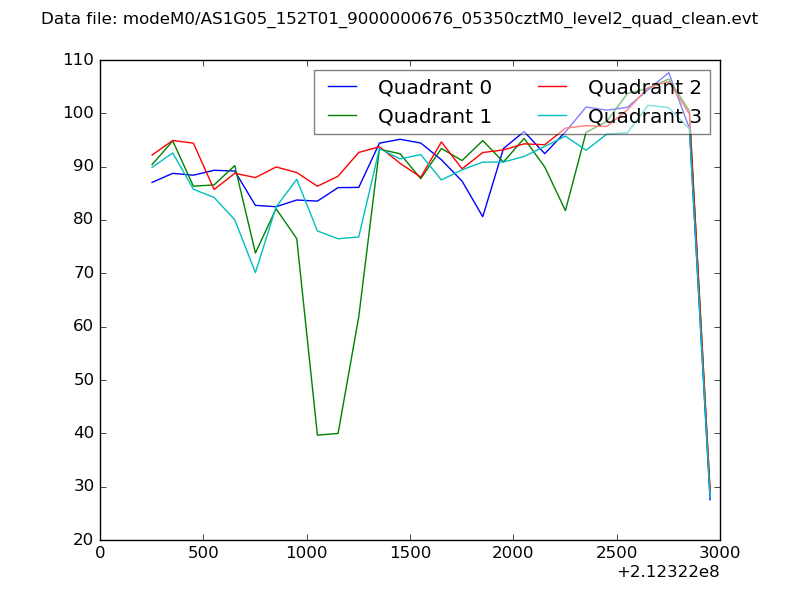 |
|
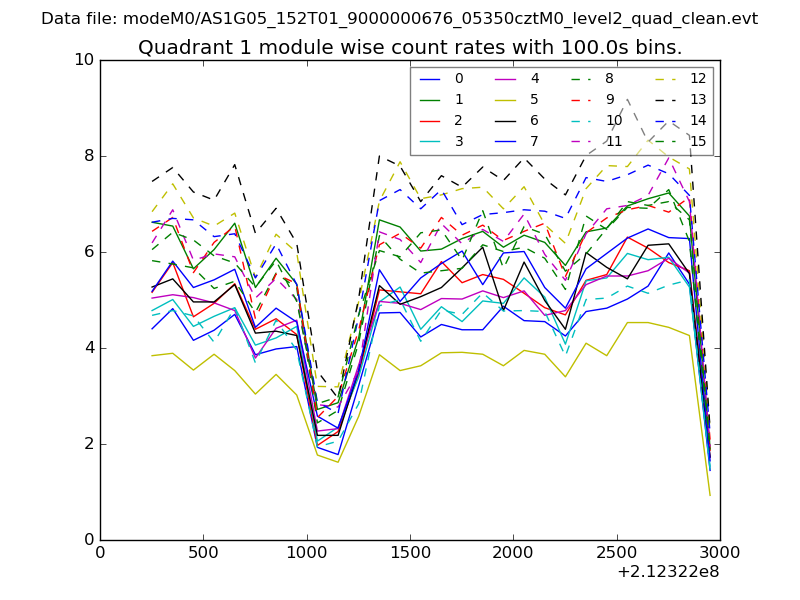
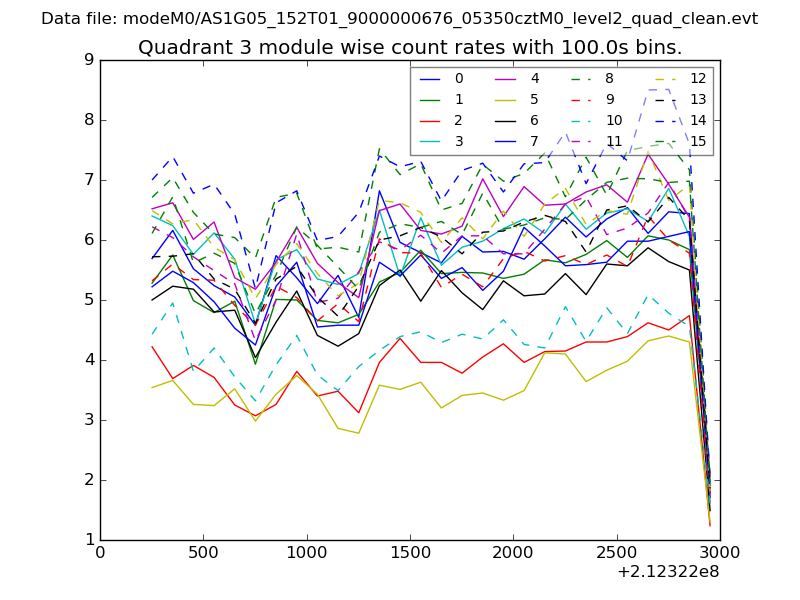
| Module-wise count rates for Quadrant A Data is divided into 100 sec bins |
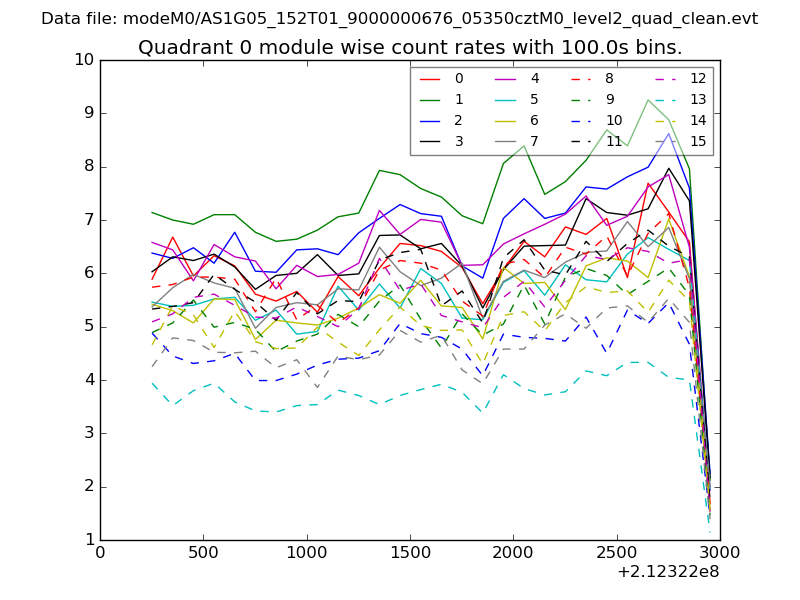 |
 |
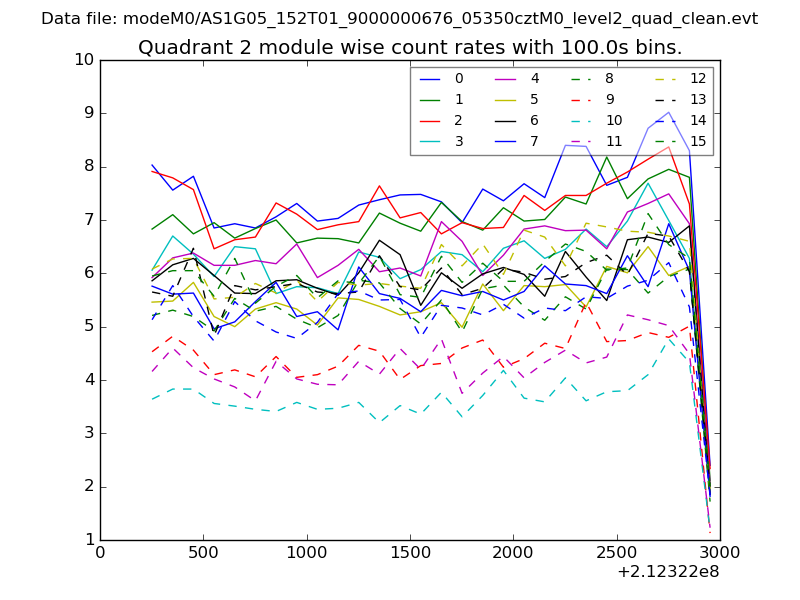
| Module-wise count rates for Quadrant B Data is divided into 100 sec bins |
 |
 |
| Module-wise count rates for Quadrant C Data is divided into 100 sec bins |
 |
 |
| Module-wise count rates for Quadrant D Data is divided into 100 sec bins |
 |
 |
| Parameter | Plot |
|---|---|
| CZT HV Monitor | 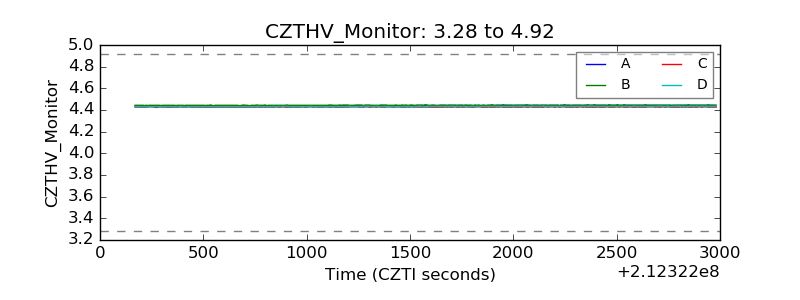 |
| D_VDD | 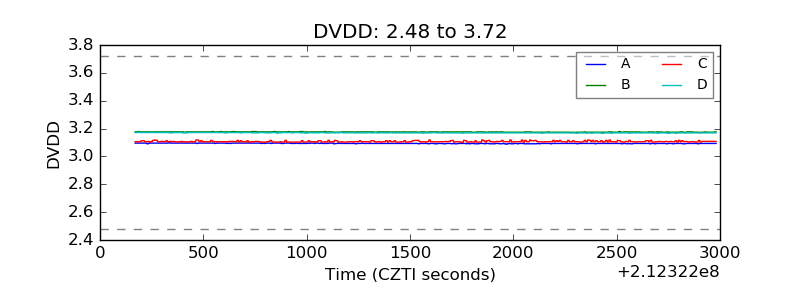 |
| Temperature 1 | 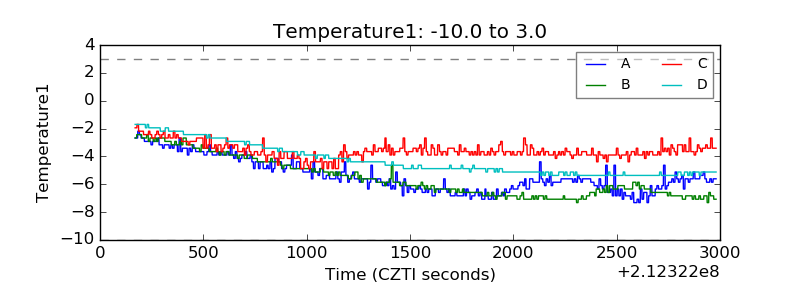 |
| Veto HV Monitor | 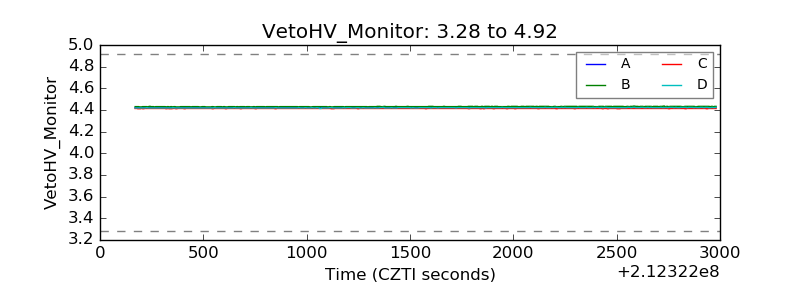 |
| Veto LLD | 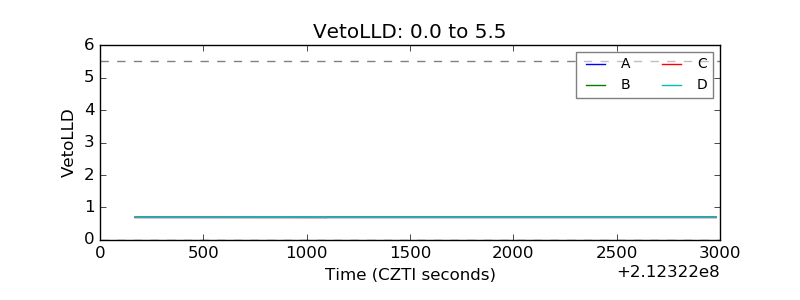 |
| Alpha Counter | 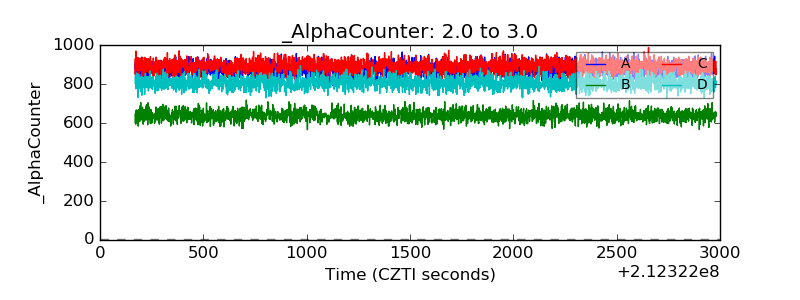 |
| _CPM_Rate | 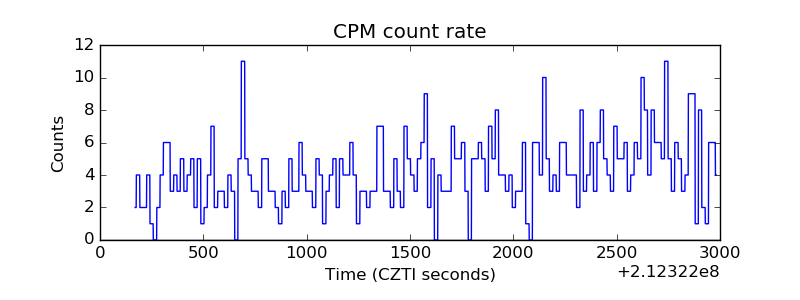 |
| CZT Counter | 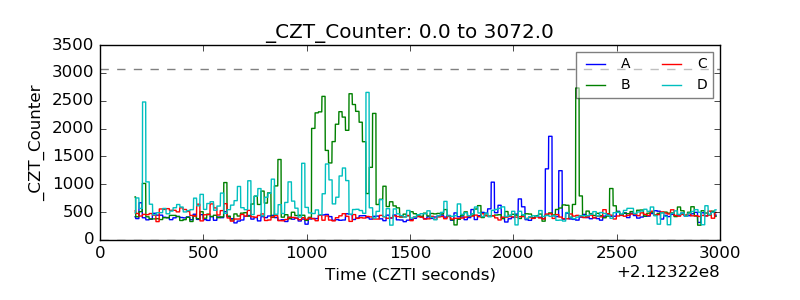 |
| +2.5 Volts monitor | 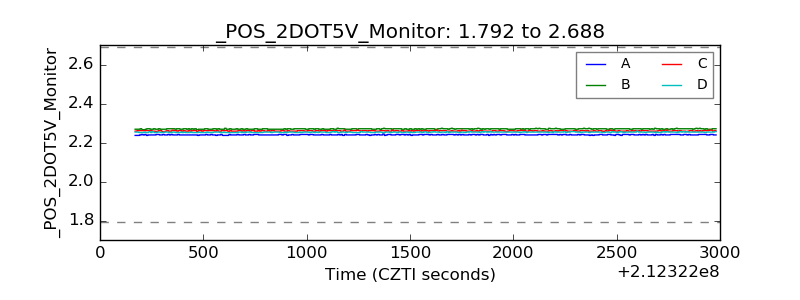 |
| +5 Volts monitor |  |
| _ROLL_ROT | 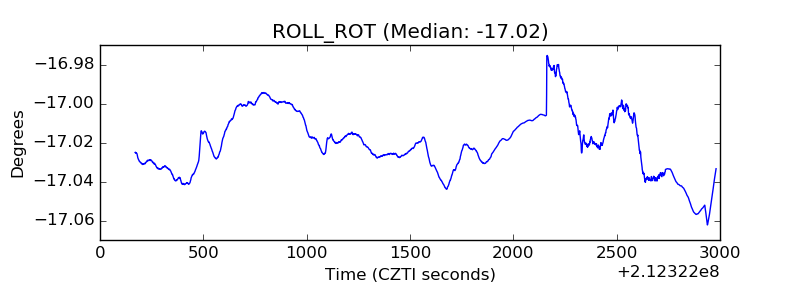 |
| _Roll_DEC | 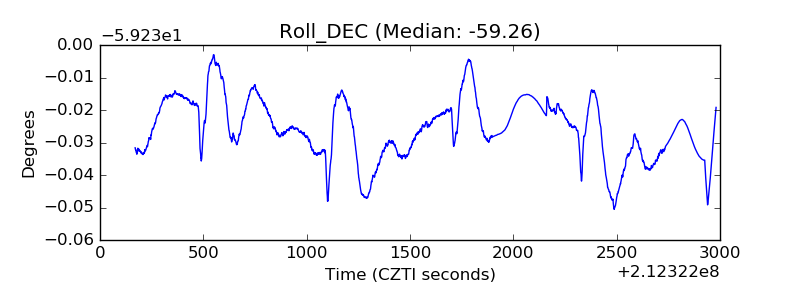 |
| _Roll_RA | 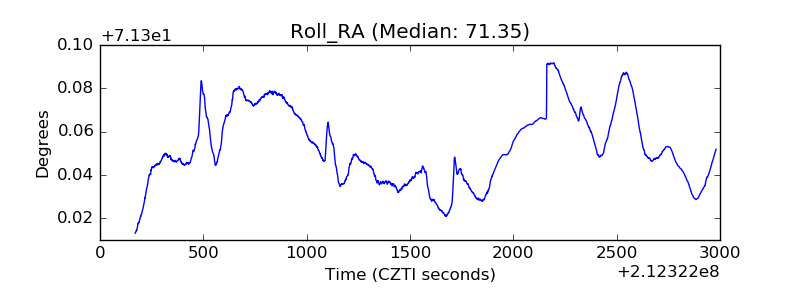 |
| Veto Counter | 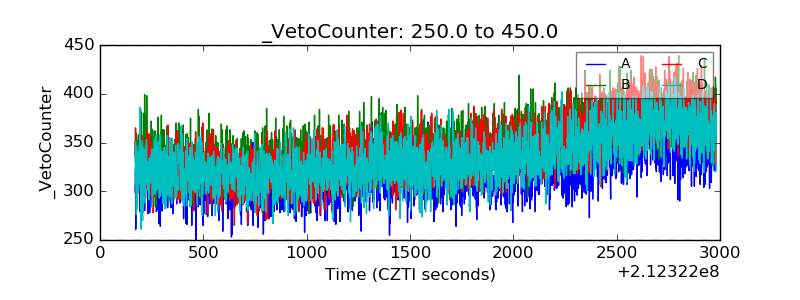 |