| Param | Original file | Final file |
|---|---|---|
| Filename | modeM0/AS1G05_106T01_9000000678cztM0_level2.fits | modeM0/AS1G05_106T01_9000000678cztM0_level2_quad_clean.evt |
| Size (bytes) | 789,978,240 | 730,520,640 |
| Size | 753.4 MB | 696.7 MB |
| Events in quadrant A | 4,752,782 | 4,221,731 |
| Events in quadrant B | 4,441,478 | 4,102,438 |
| Events in quadrant C | 4,742,180 | 4,116,269 |
| Events in quadrant D | 3,973,907 | 3,671,629 |
| Mode SS | |||
|---|---|---|---|
| Quadrant | BADHDUFLAG | Total packets | Discarded packets |
| A | 0 | 1794 | 0 |
| B | 0 | 1782 | 0 |
| C | 0 | 1794 | 0 |
| D | 0 | 1788 | 0 |
| Mode M0 | |||
|---|---|---|---|
| Quadrant | BADHDUFLAG | Total packets | Discarded packets |
| A | 0 | 189626 | 0 |
| B | 0 | 199039 | 0 |
| C | 0 | 182270 | 0 |
| D | 0 | 209899 | 0 |
| Mode M9 | |||
|---|---|---|---|
| Quadrant | BADHDUFLAG | Total packets | Discarded packets |
| A | 0 | 136 | 0 |
| B | 0 | 136 | 0 |
| C | 0 | 134 | 0 |
| D | 0 | 136 | 0 |
| Quadrant | Total seconds | Saturated seconds | Saturation percentage |
|---|---|---|---|
| A | 87679 | 2112 | 2.408787% |
| B | 87722 | 1877 | 2.139714% |
| C | 87707 | 905 | 1.031845% |
| D | 87618 | 3478 | 3.969504% |
Noise dominated data is calculated using 1-second bins in cleaned event files. If a bin has >2000 counts, and if more than 50% of those come from <1% of pixels, then it is considered to be noise-dominated and hence unusable.
| Quadrant | # 1 sec bins | Bins with >0 counts | Bins with >2000 counts | High rate bins dominated by noise | Noise dominated (total time) | Noise dominated (detector-on time) | Marked lightcurve |
|---|---|---|---|---|---|---|---|
| A | 102423 | 88102 | 0 | 0 | 0.00% | 0.00% | 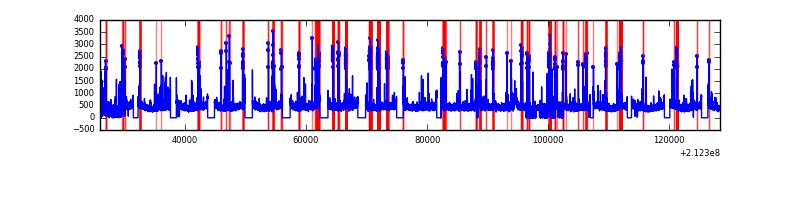 |
| B | 102422 | 88104 | 0 | 0 | 0.00% | 0.00% |  |
| C | 102423 | 88166 | 0 | 0 | 0.00% | 0.00% |  |
| D | 102423 | 87692 | 0 | 0 | 0.00% | 0.00% |  |
Top three noisy pixels from each quadrant. If the there are fewer than three noisy pixels in the level2.evt file, extra rows are filled as -1
| Pixel properties | Quadrant properties | ||||||
|---|---|---|---|---|---|---|---|
| Quadrant | DetID | PixID | Counts | Sigma | Mean | Median | Sigma |
| A | 14 | 188 | 4743 | 11.28 | 1231 | 1143 | 319.1 |
| A | 0 | 29 | 4663 | 11.03 | 1231 | 1143 | 319.1 |
| A | 7 | 110 | 4177 | 9.51 | 1231 | 1143 | 319.1 |
| B | 2 | 9 | 3568 | 10.82 | 1176 | 1122 | 226.0 |
| B | 12 | 226 | 3015 | 8.38 | 1176 | 1122 | 226.0 |
| B | 2 | 8 | 2961 | 8.14 | 1176 | 1122 | 226.0 |
| C | 1 | 80 | 3452 | 6.92 | 1250 | 1154 | 332.1 |
| C | 12 | 241 | 3341 | 6.58 | 1250 | 1154 | 332.1 |
| C | 1 | 81 | 3323 | 6.53 | 1250 | 1154 | 332.1 |
| D | 11 | 82 | 3013 | 6.52 | 1133 | 1024 | 304.9 |
| D | 6 | 231 | 2877 | 6.08 | 1133 | 1024 | 304.9 |
| D | 1 | 19 | 2862 | 6.03 | 1133 | 1024 | 304.9 |
Histogram calculated using DETX and DETY for each event in the final _common_clean file
| Quadrant A | 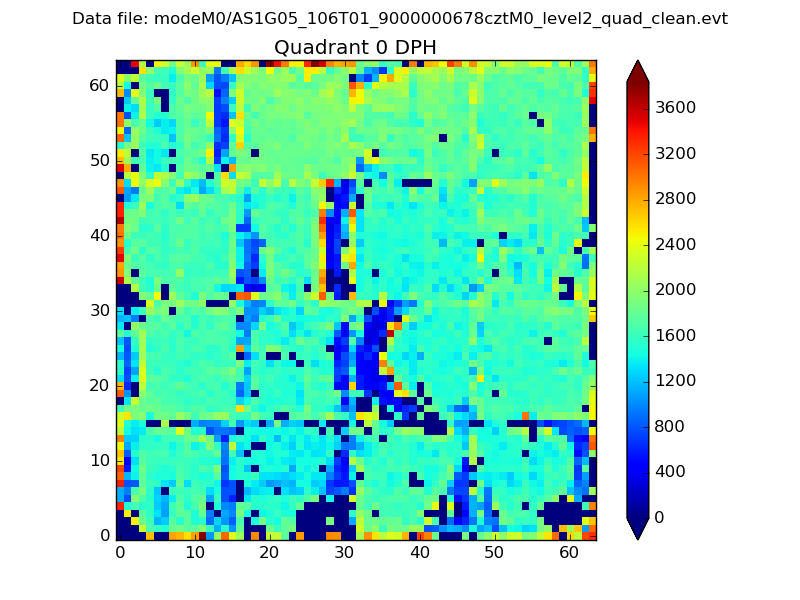 |
 |
Quadrant B |
|---|---|---|---|
| Quadrant D |  |
 |
Quadrant C |
| Plot type | Count rate plots | Images |
|---|---|---|
| Comparison with Poisson distribution Blue bars denote a histogram of data divided into 1 sec bins. Red curve is a Poisson curve with rate = median count rate of data. |
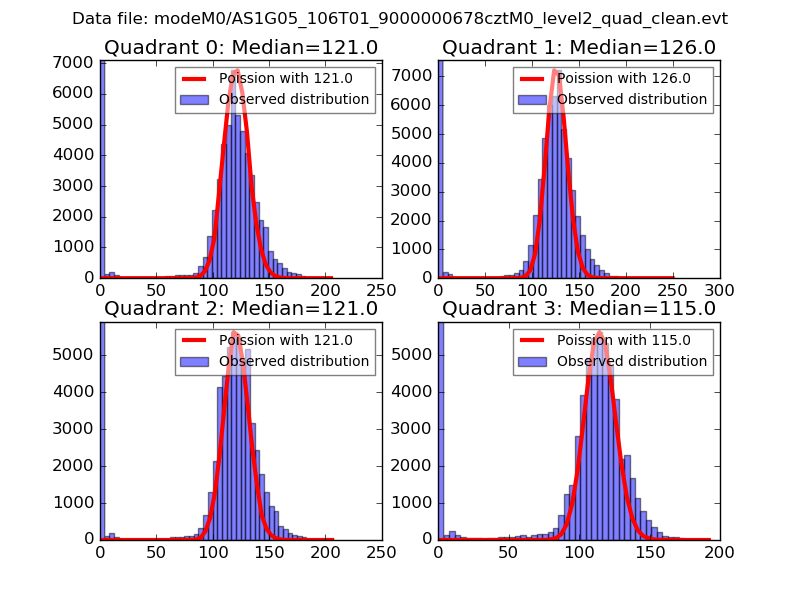 |
 |
| Quadrant-wise count rates Data is divided into 100 sec bins |
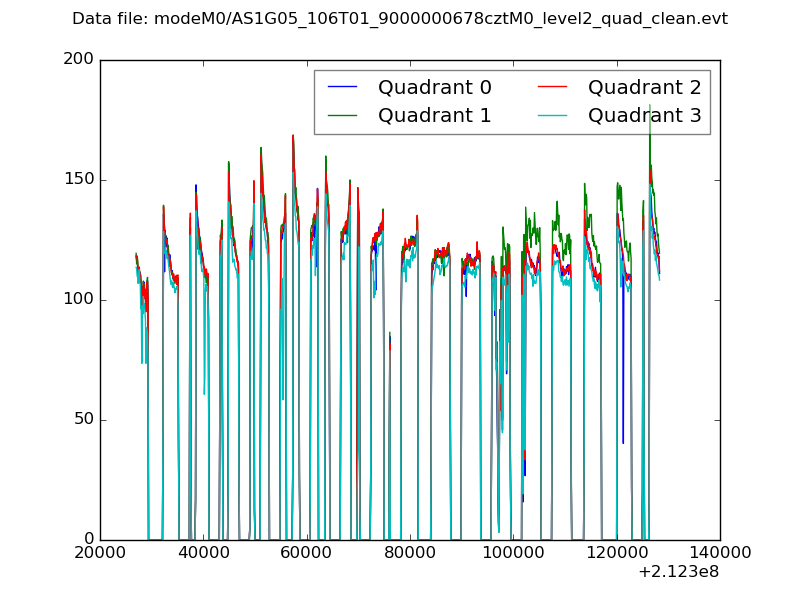 |
|
| Module-wise count rates for Quadrant A Data is divided into 100 sec bins |
 |
 |
| Module-wise count rates for Quadrant B Data is divided into 100 sec bins |
 |
 |
| Module-wise count rates for Quadrant C Data is divided into 100 sec bins |
 |
 |
| Module-wise count rates for Quadrant D Data is divided into 100 sec bins |
 |
 |
| Parameter | Plot |
|---|---|
| CZT HV Monitor | 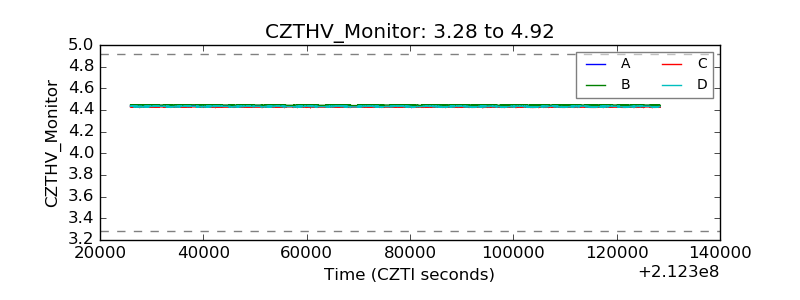 |
| D_VDD |  |
| Temperature 1 |  |
| Veto HV Monitor |  |
| Veto LLD | 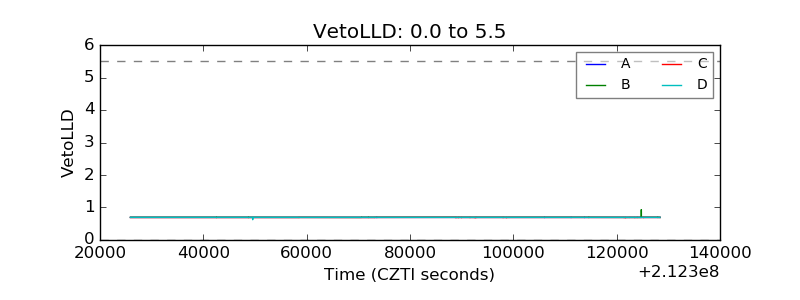 |
| Alpha Counter |  |
| _CPM_Rate | 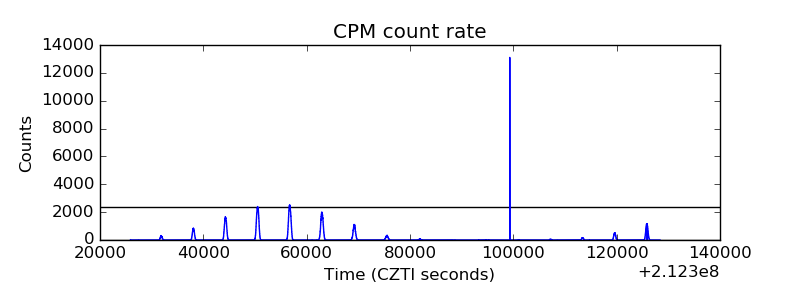 |
| CZT Counter |  |
| +2.5 Volts monitor | 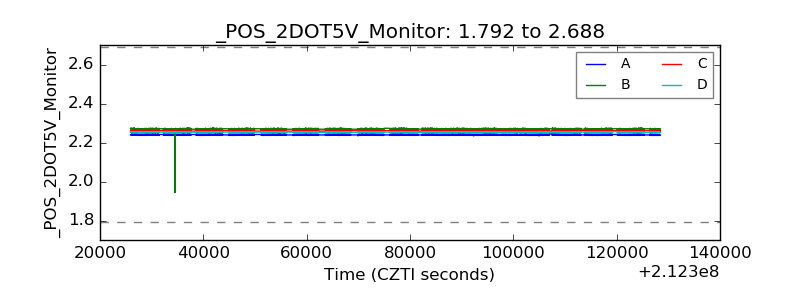 |
| +5 Volts monitor |  |
| _ROLL_ROT | 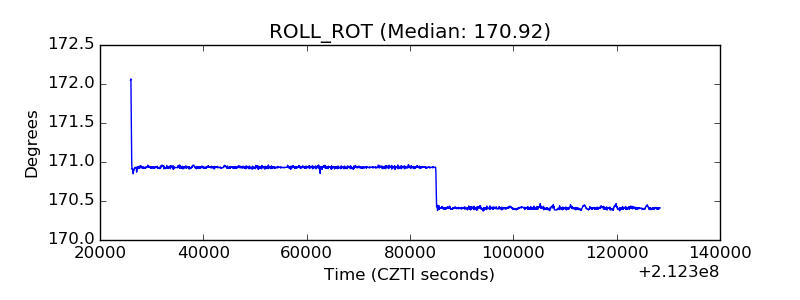 |
| _Roll_DEC | 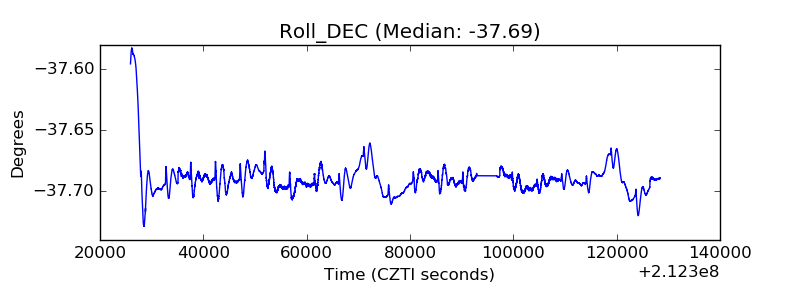 |
| _Roll_RA | 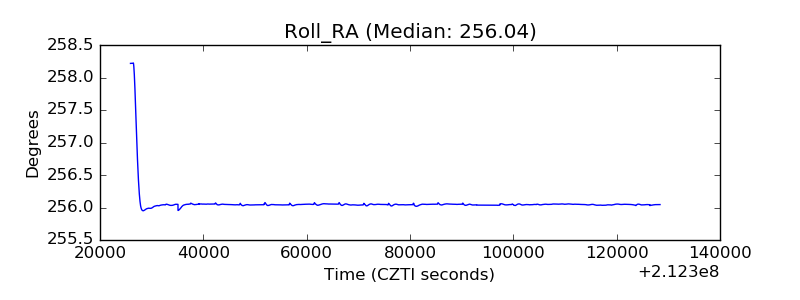 |
| Veto Counter |  |