| Param | Original file | Final file |
|---|---|---|
| Filename | modeM0/AS1G05_106T01_9000000678_05350cztM0_level2.evt | modeM0/AS1G05_106T01_9000000678_05350cztM0_level2_quad_clean.evt |
| Size (bytes) | 908,521,920 | 132,027,840 |
| Size | 866.4 MB | 125.9 MB |
| Events in quadrant A | 5,765,337 | 802,867 |
| Events in quadrant B | 6,893,151 | 795,801 |
| Events in quadrant C | 5,403,064 | 804,208 |
| Events in quadrant D | 8,631,998 | 756,423 |
| Mode SS | |||
|---|---|---|---|
| Quadrant | BADHDUFLAG | Total packets | Discarded packets |
| A | 0 | 250 | 0 |
| B | 0 | 250 | 6 |
| C | 0 | 250 | 0 |
| D | 0 | 250 | 0 |
| Mode M0 | |||
|---|---|---|---|
| Quadrant | BADHDUFLAG | Total packets | Discarded packets |
| A | 0 | 25947 | 285 |
| B | 0 | 28910 | 298 |
| C | 0 | 25011 | 264 |
| D | 0 | 34213 | 740 |
| Mode M9 | |||
|---|---|---|---|
| Quadrant | BADHDUFLAG | Total packets | Discarded packets |
| A | 0 | 18 | 0 |
| B | 0 | 18 | 0 |
| C | 0 | 18 | 1 |
| D | 0 | 18 | 0 |
| Quadrant | Total seconds | Saturated seconds | Saturation percentage |
|---|---|---|---|
| A | 12133 | 125 | 1.030248% |
| B | 12142 | 269 | 2.215451% |
| C | 12135 | 51 | 0.420272% |
| D | 12078 | 805 | 6.665011% |
Noise dominated data is calculated using 1-second bins in cleaned event files. If a bin has >2000 counts, and if more than 50% of those come from <1% of pixels, then it is considered to be noise-dominated and hence unusable.
| Quadrant | # 1 sec bins | Bins with >0 counts | Bins with >2000 counts | High rate bins dominated by noise | Noise dominated (total time) | Noise dominated (detector-on time) | Marked lightcurve |
|---|---|---|---|---|---|---|---|
| A | 14024 | 12253 | 30 | 30 | 0.21% | 0.24% |  |
| B | 14024 | 12260 | 136 | 136 | 0.97% | 1.11% |  |
| C | 14024 | 12254 | 0 | 0 | 0.00% | 0.00% |  |
| D | 14024 | 12221 | 735 | 735 | 5.24% | 6.01% |  |
Top three noisy pixels from each quadrant. If the there are fewer than three noisy pixels in the level2.evt file, extra rows are filled as -1
| Pixel properties | Quadrant properties | ||||||
|---|---|---|---|---|---|---|---|
| Quadrant | DetID | PixID | Counts | Sigma | Mean | Median | Sigma |
| A | 15 | 174 | 287502 | 999.39 | 1399 | 1368 | 286.3 |
| A | 0 | 50 | 69937 | 239.49 | 1399 | 1368 | 286.3 |
| A | 15 | 234 | 19191 | 62.25 | 1399 | 1368 | 286.3 |
| B | 14 | 167 | 593816 | 2201.46 | 1405 | 1372 | 269.1 |
| B | 0 | 199 | 172705 | 636.65 | 1405 | 1372 | 269.1 |
| B | 4 | 81 | 140858 | 518.31 | 1405 | 1372 | 269.1 |
| C | 1 | 16 | 104157 | 327.54 | 1354 | 1363 | 313.8 |
| C | 13 | 61 | 11107 | 31.05 | 1354 | 1363 | 313.8 |
| C | 14 | 67 | 8604 | 23.07 | 1354 | 1363 | 313.8 |
| D | 2 | 16 | 2489695 | 7800.63 | 1290 | 1248 | 319.0 |
| D | 2 | 63 | 708571 | 2217.27 | 1290 | 1248 | 319.0 |
| D | 2 | 136 | 204789 | 638.05 | 1290 | 1248 | 319.0 |
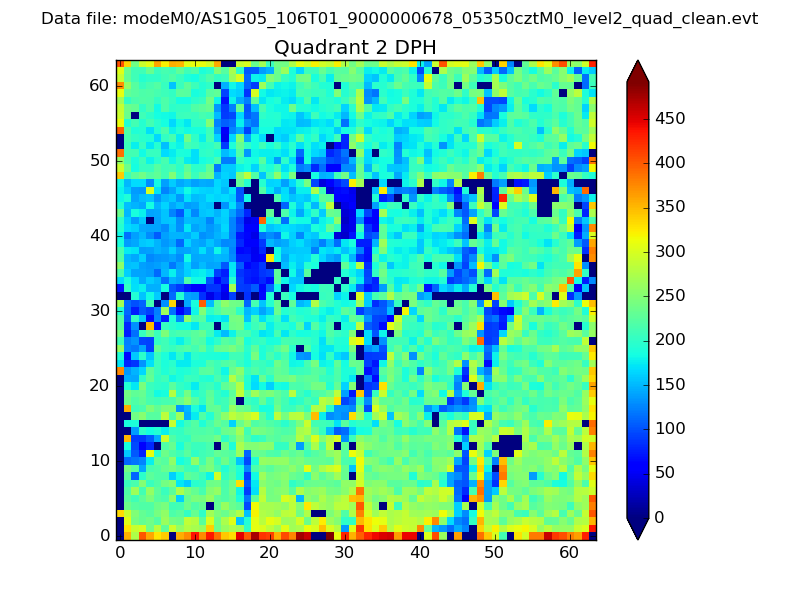
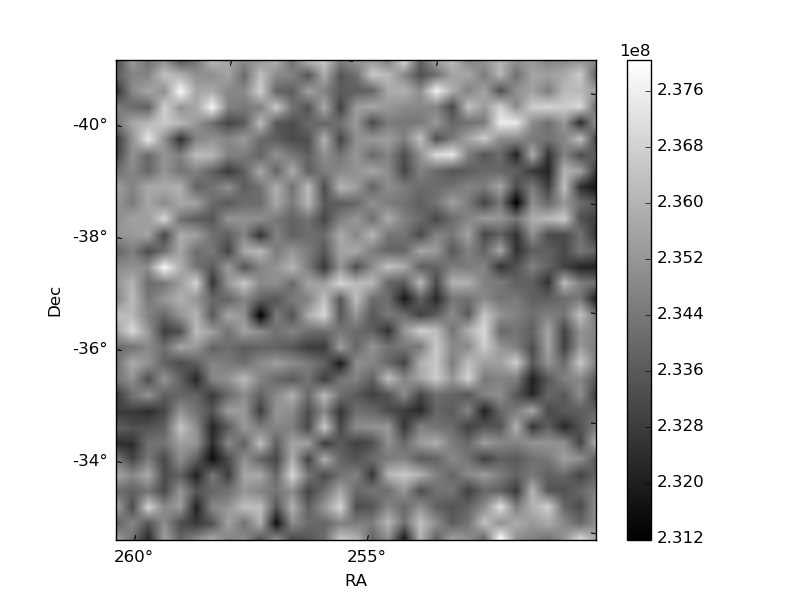
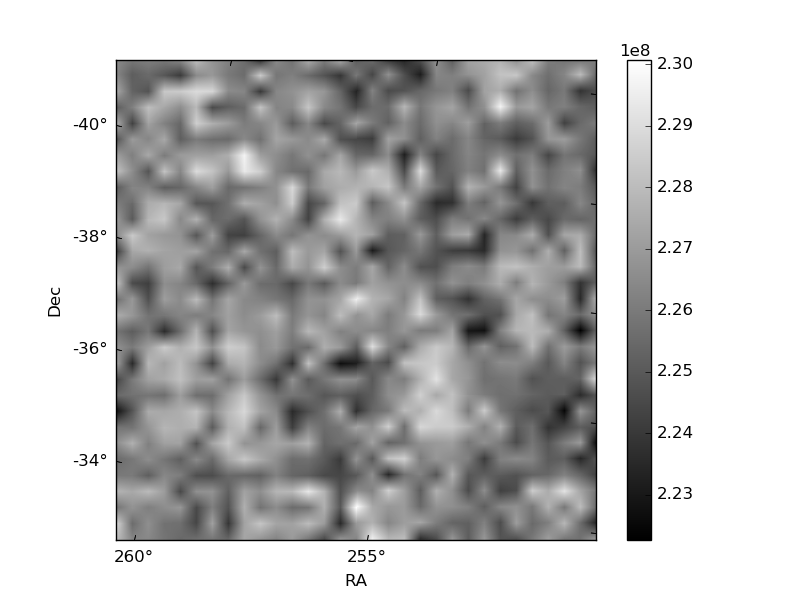
Histogram calculated using DETX and DETY for each event in the final _common_clean file
| Quadrant A | 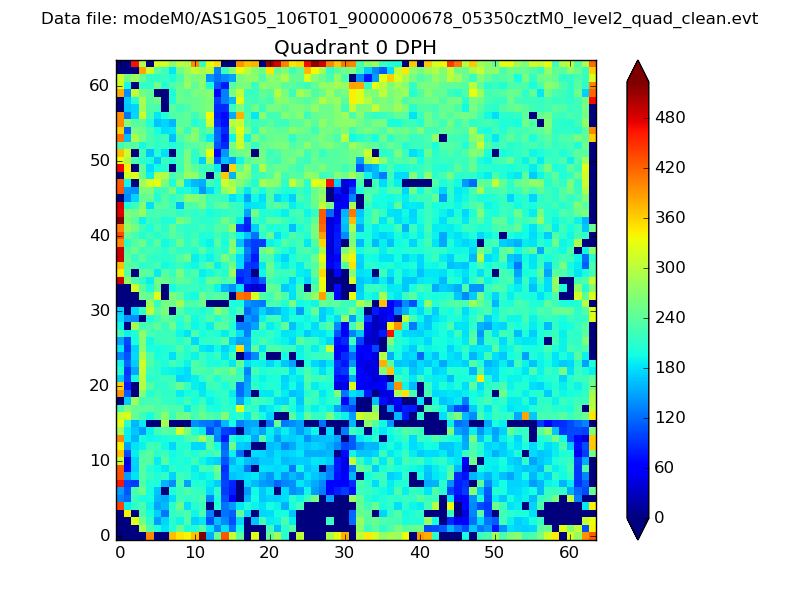 |
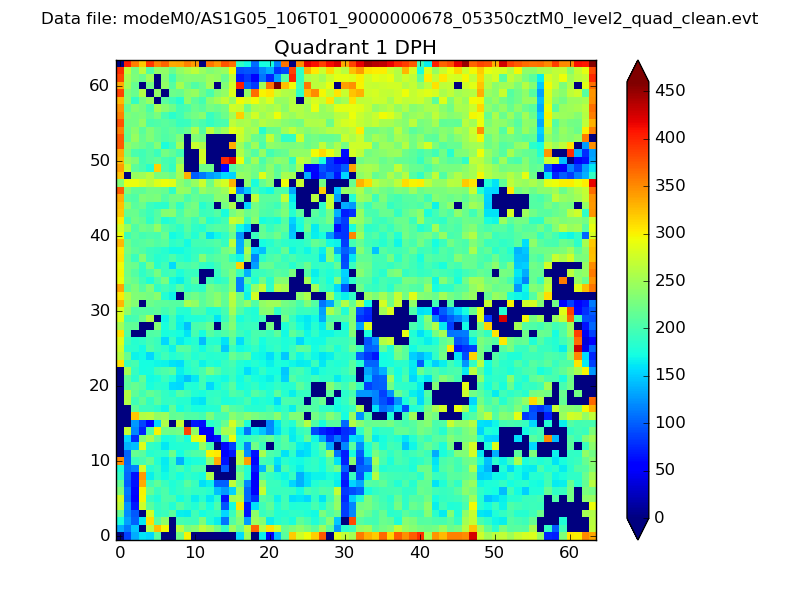 |
Quadrant B |
|---|---|---|---|
| Quadrant D | 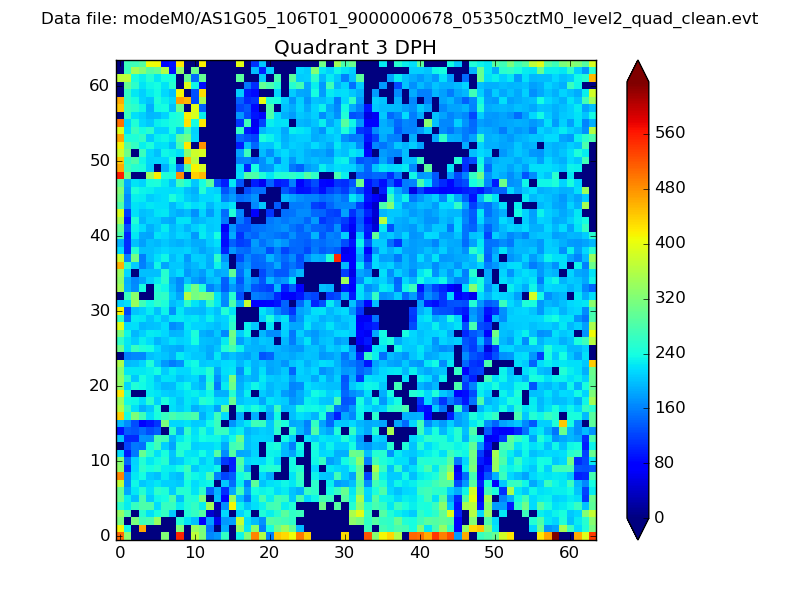 |
 |
Quadrant C |
| Plot type | Count rate plots | Images |
|---|---|---|
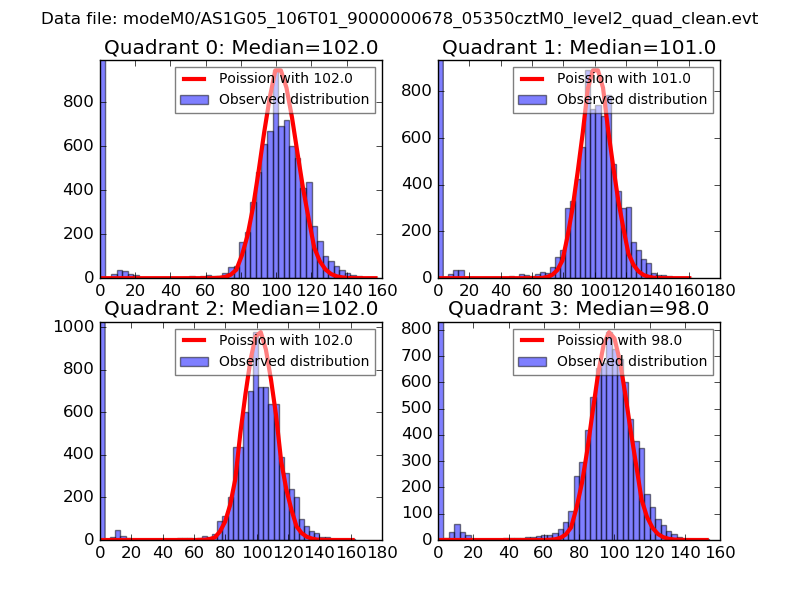
| Comparison with Poisson distribution Blue bars denote a histogram of data divided into 1 sec bins. Red curve is a Poisson curve with rate = median count rate of data. |
 |
 |
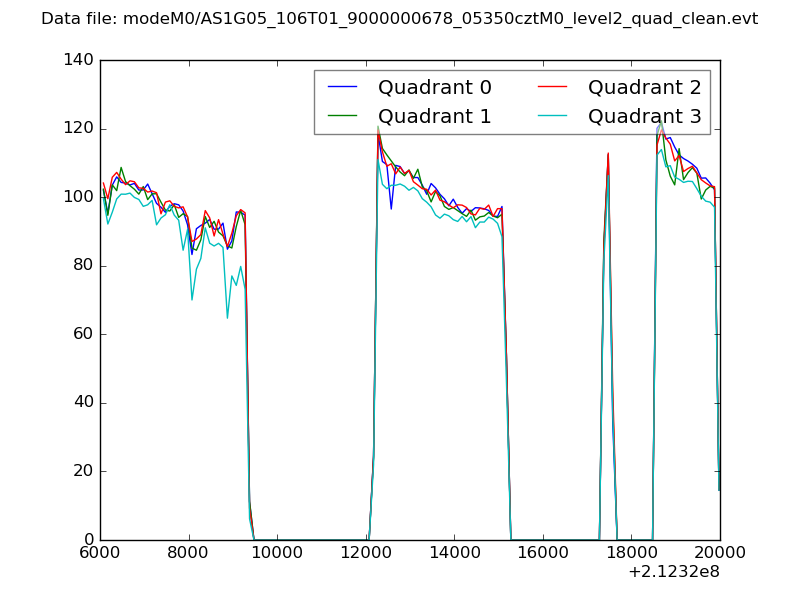
| Quadrant-wise count rates Data is divided into 100 sec bins |
 |
|
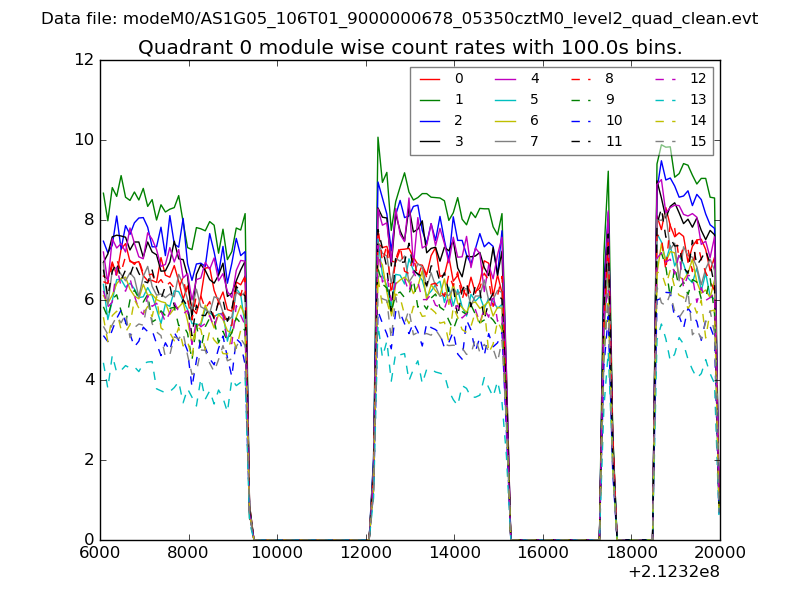
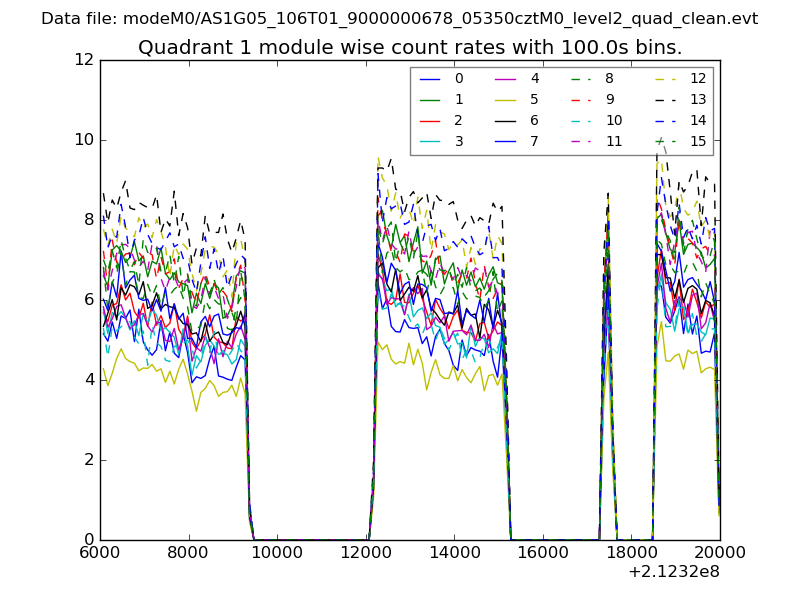
| Module-wise count rates for Quadrant A Data is divided into 100 sec bins |
 |
 |
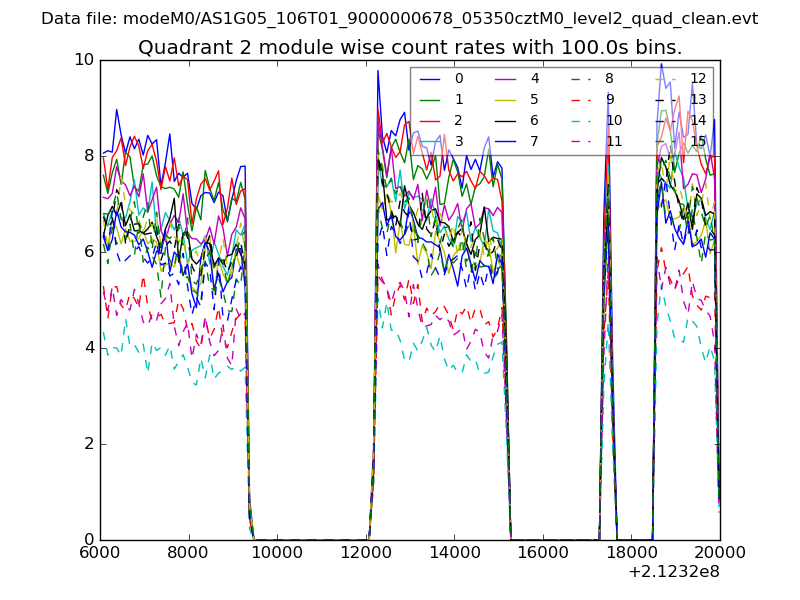
| Module-wise count rates for Quadrant B Data is divided into 100 sec bins |
 |
 |
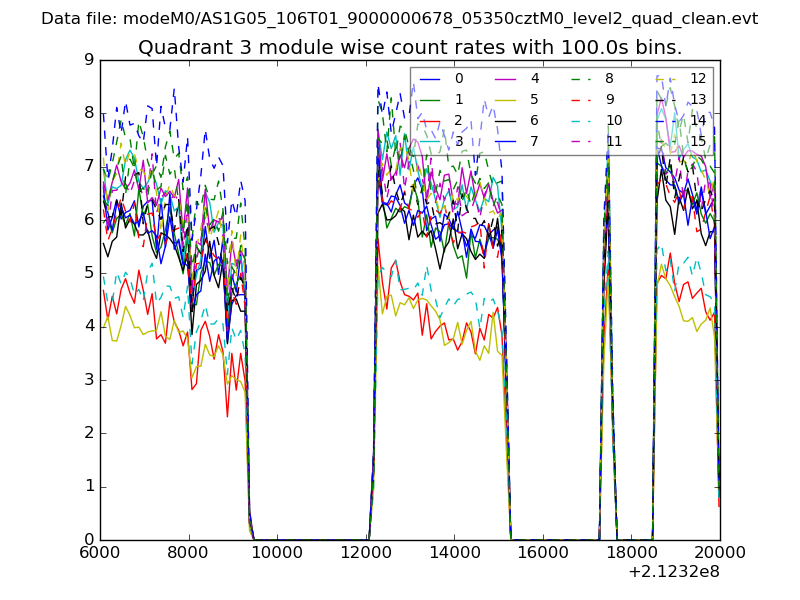
| Module-wise count rates for Quadrant C Data is divided into 100 sec bins |
 |
 |
| Module-wise count rates for Quadrant D Data is divided into 100 sec bins |
 |
 |
| Parameter | Plot |
|---|---|
| CZT HV Monitor | 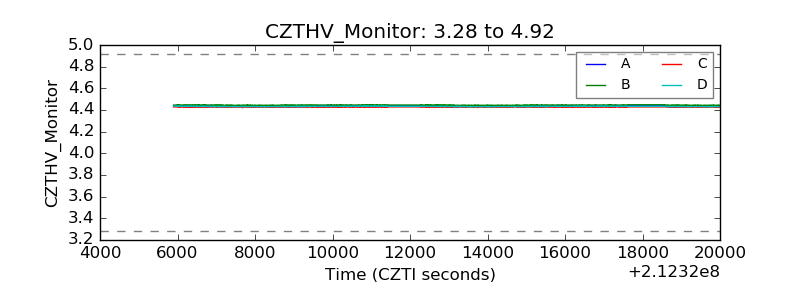 |
| D_VDD | 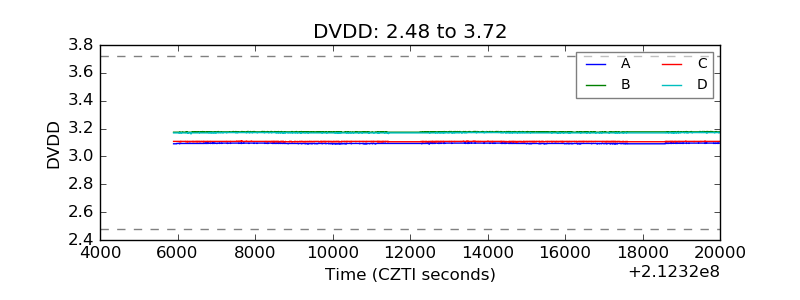 |
| Temperature 1 | 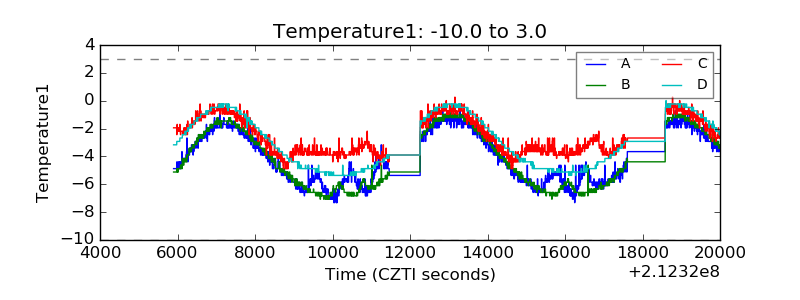 |
| Veto HV Monitor | 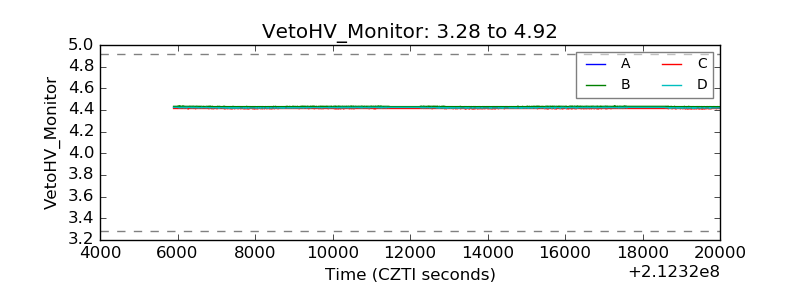 |
| Veto LLD | 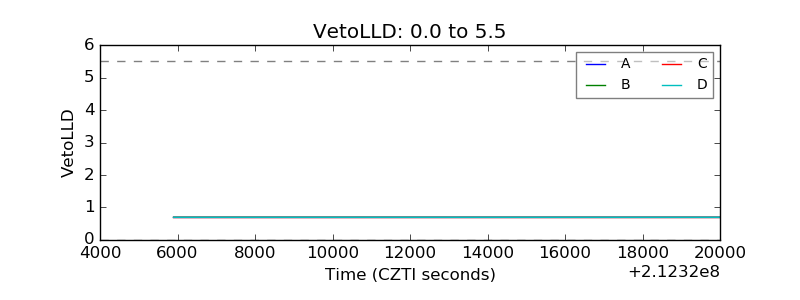 |
| Alpha Counter | 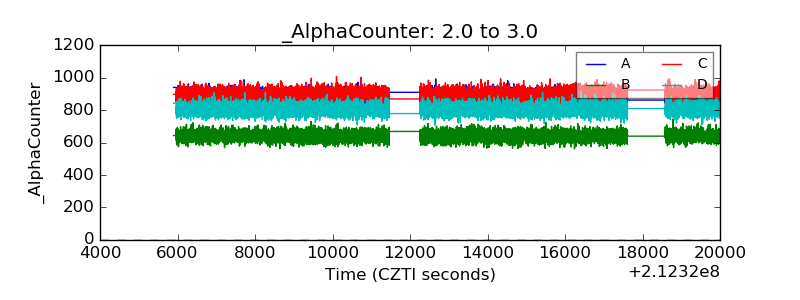 |
| _CPM_Rate | 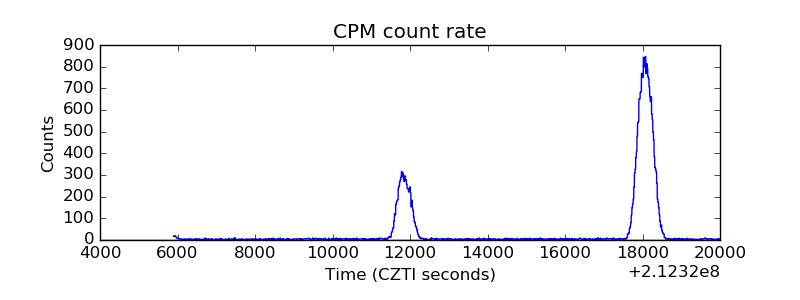 |
| CZT Counter | 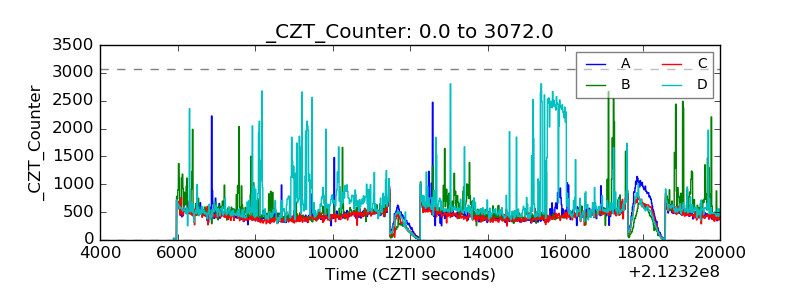 |
| +2.5 Volts monitor |  |
| +5 Volts monitor |  |
| _ROLL_ROT | 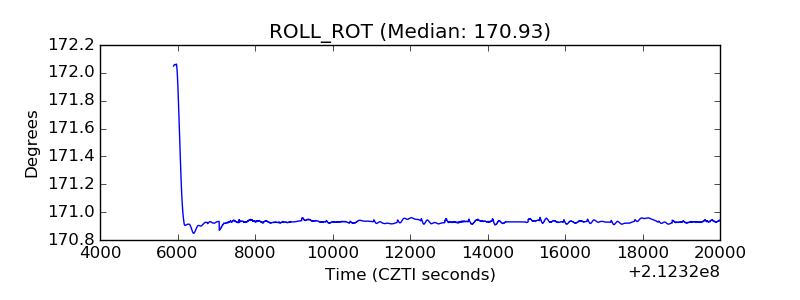 |
| _Roll_DEC | 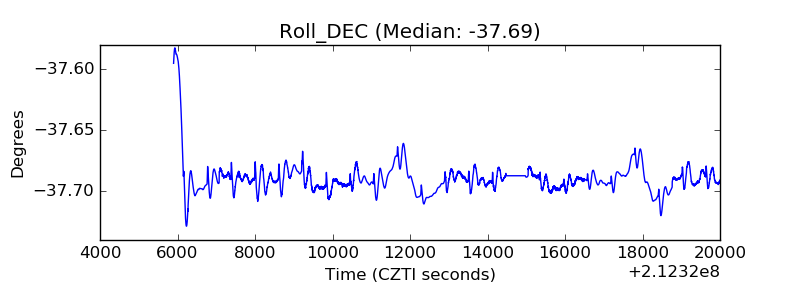 |
| _Roll_RA | 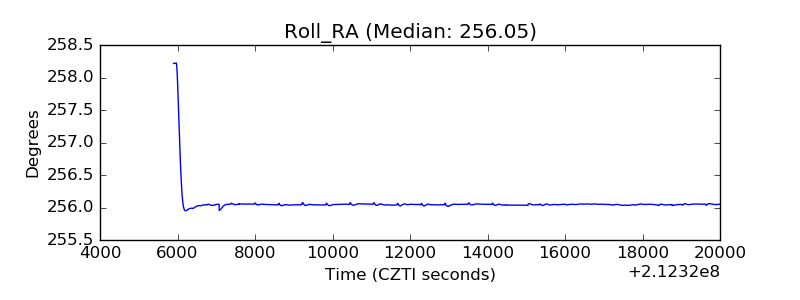 |
| Veto Counter | 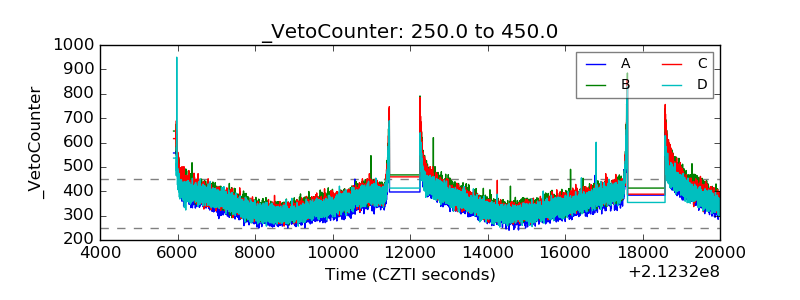 |